3 min read
Scientist Discovered Why Most Traders Lose Money – 24 Surprising Statistics
“95% of all traders fail” is the most commonly used trading related statistic around the internet. But no research paper exists that proves this...

In my swing trading strategy, I trade exclusively pin bars and outside bars found on 4H+. These are my trade triggers. If I find one of these on the Daily or higher time frames, I usually use the resulting move to scale in with multiple positions on the 4H and 1H time frames. If I find a price action signal on the 4H, 6H, 8H or 12H time frames, I simply play out the trade without adding positions. Now apart from finding sexy pin bars or outside bars, there are analysis tools I use to add confluence to my trades. Without these, a random pin bar or outside bar has slim to none chances of working out. I grade these confluences from very important to not very important and according to my rules, I require at least 3 confluence factors to take a trade – the more the better. I assume you know what a good pin bar and/or outside bar look like, so I will go ahead.
And once again, credit where credit is due, I said this before, but who really got my trading on track is my good friend Steve from nobrainertrades.com and you will find many of the concepts I talk about here over there, as Steve developed them.
By far the strongest, as they are a signal in themselves for other traders. One of these must be present for the trade to be a triple-A trade. But I can also take a trade without these in, let’s say, strong trends, or very obvious retests of certain structures.
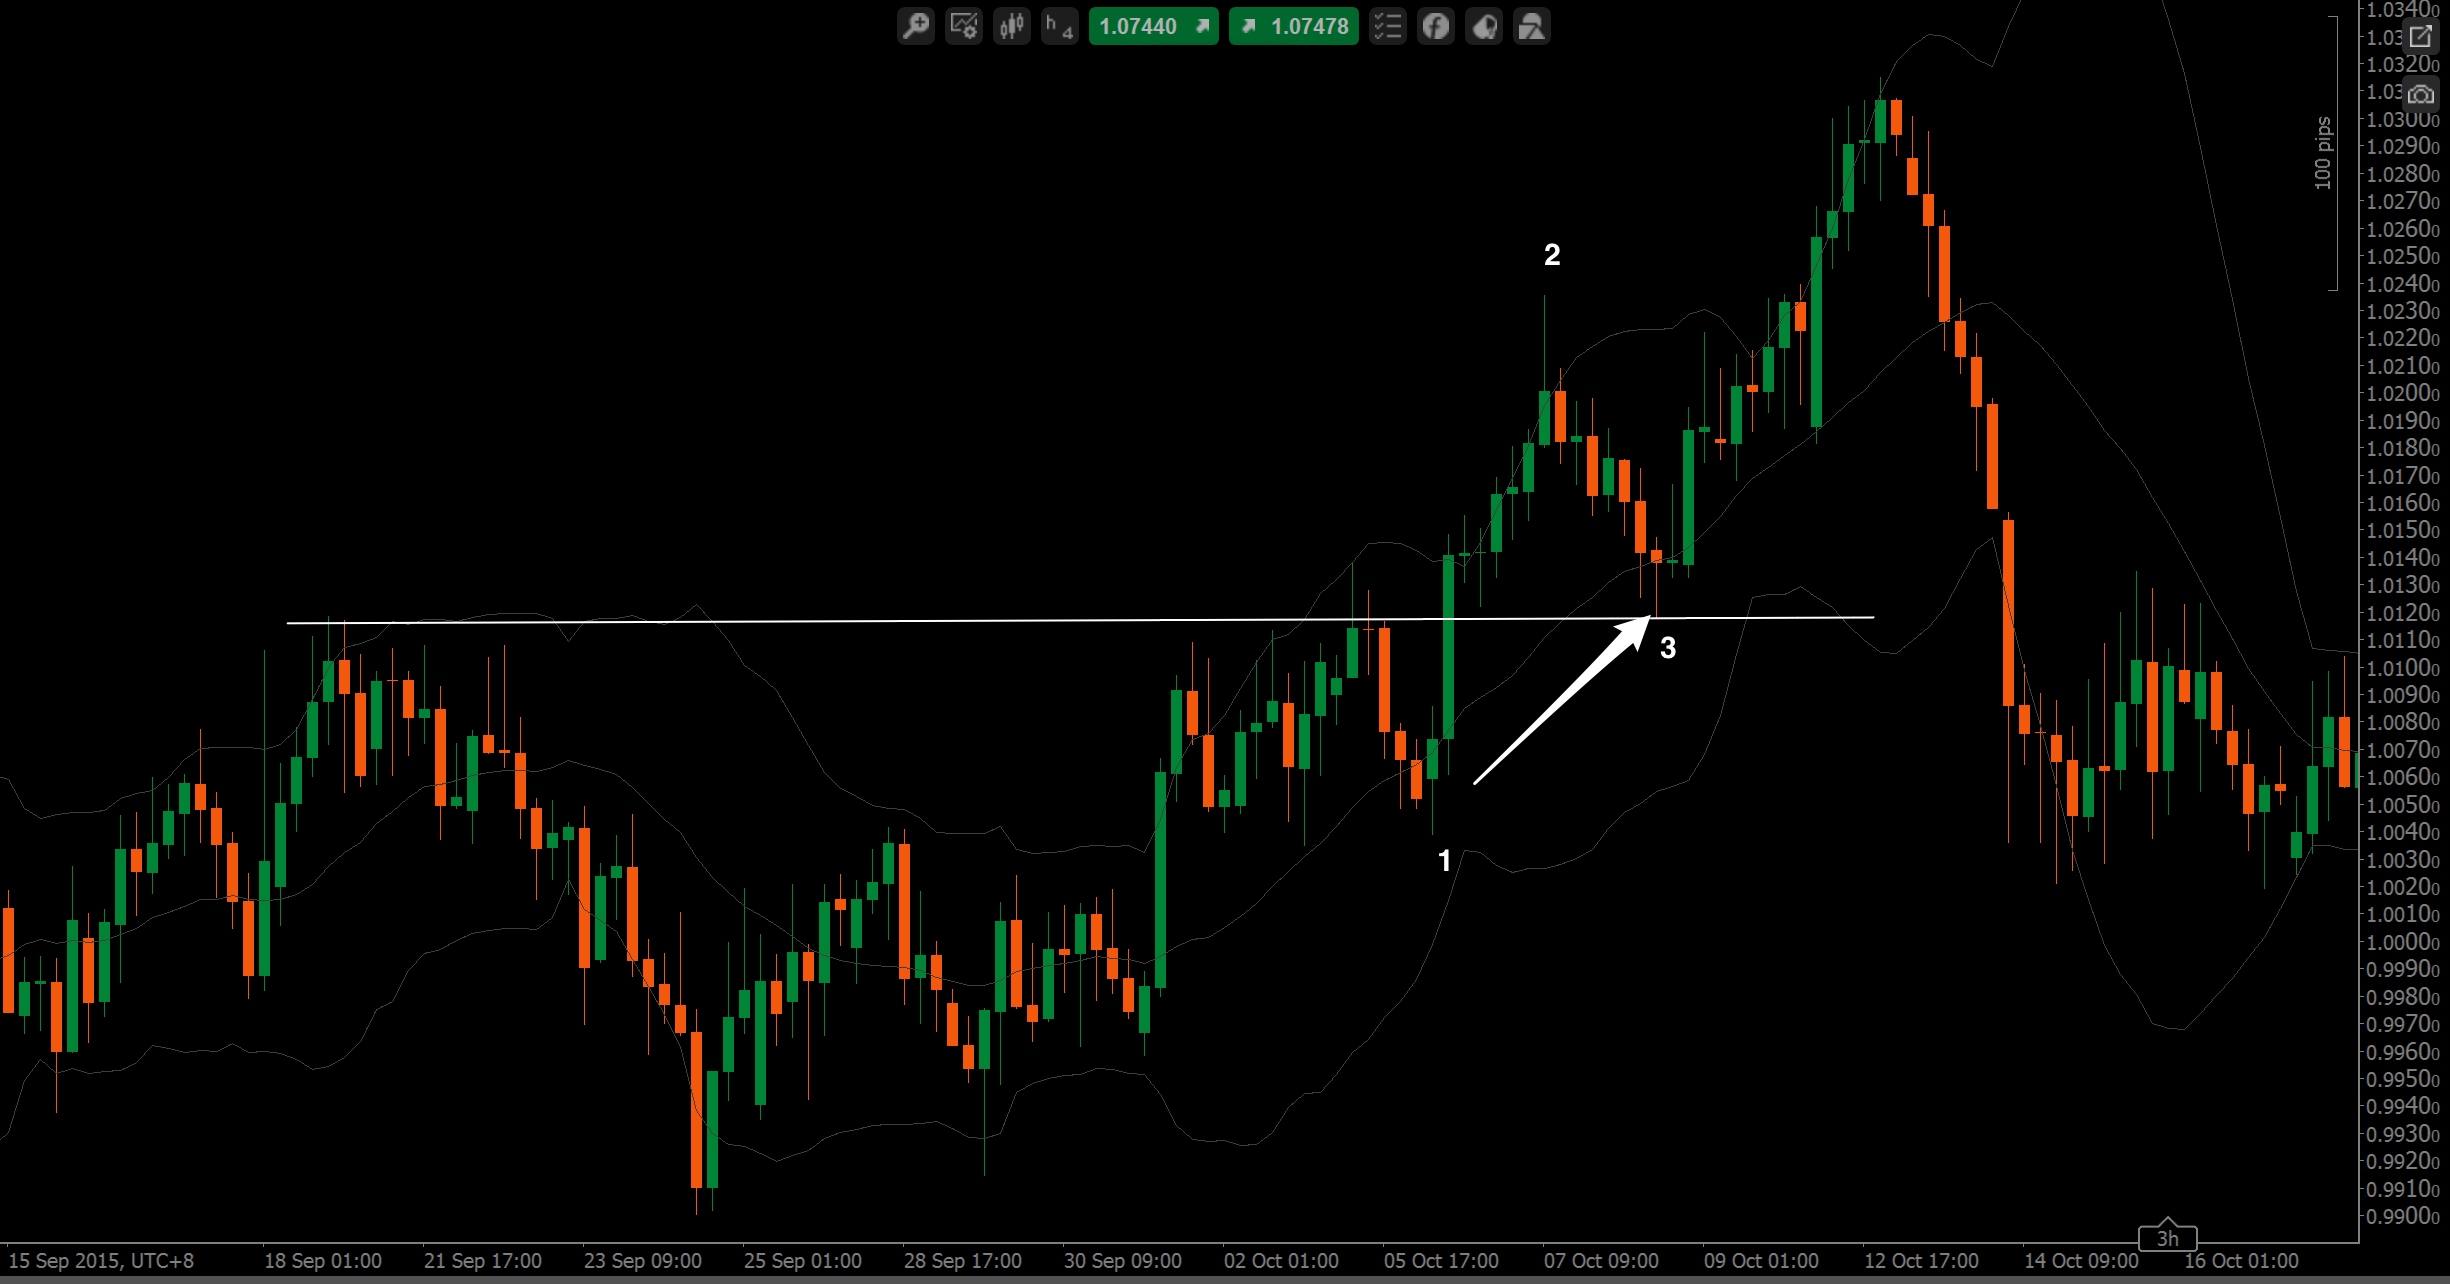
My favorite chart pattern as it is very straight forward. Going with the trend, the winrate is far beyond 70% with this one and often offering a RRR of 1:1 or better. We enter our trade at point 3, as shown below. Once we see the breakout of a level like here, we can set our price alarm there and simply check in once price comes back to us. You could trade only these and make money with enough patience. There are maybe 5 trades like this every month across all the markets I watch. Take profit at point 2, or go to break even and see whether price can continue to the next S/R and/or Fibonacci extension – up to you. These are basically simple breakout-retests.
Video: How To Trade The 1-2-3 Pattern
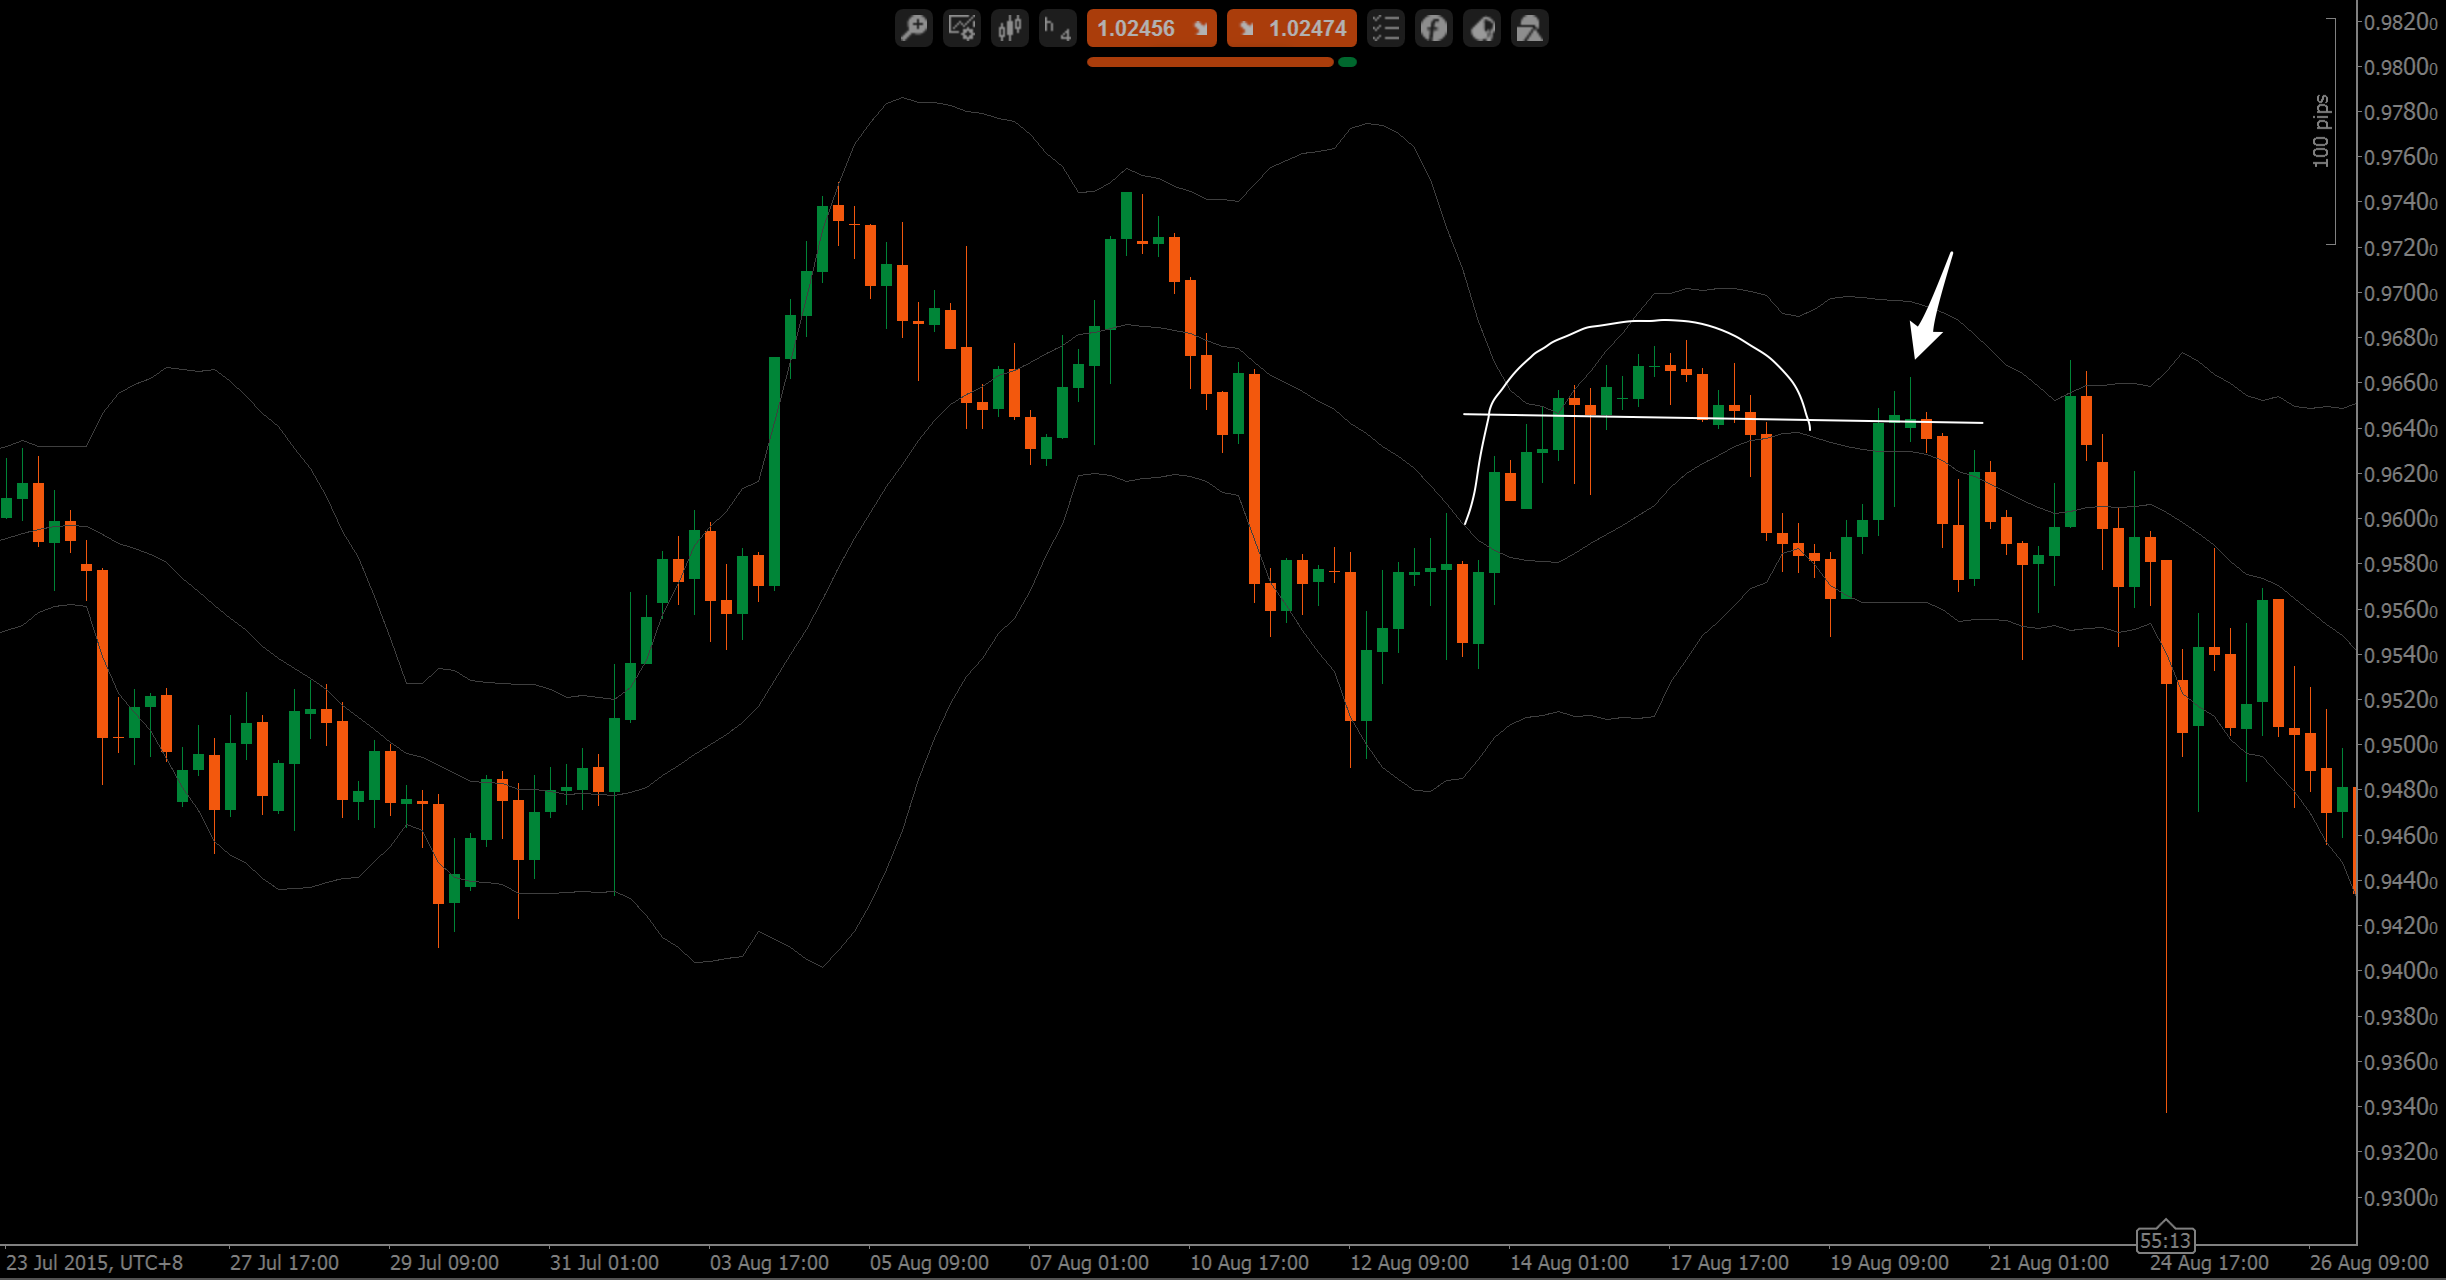
The Head and Shoulders pattern, as well, offer a fantastic win rate plus, when played right, awesome RRR. They happen maybe 1-2 times per month, but hell yeah, these are awesome. We do not trade them in the traditional sense that we enter at the break of the neckline, but we get in at the right shoulder. Why? Because we ONLY trade swing point, and not breakouts. Once we get to the neckline, we can take profit, or go to break even and use traditional Head & Shoulders targeting projections for our take profits. Note that a perfect H&S always comes with a successful 1-2-3. Can be played against the trend or as a continuation. This is also called Over & Under pattern.
Usually classic range and/or reversal trades, but can also be trend following trades, and very easy to spot. We usually trade these back to the other side of the range or the last swing high/low.
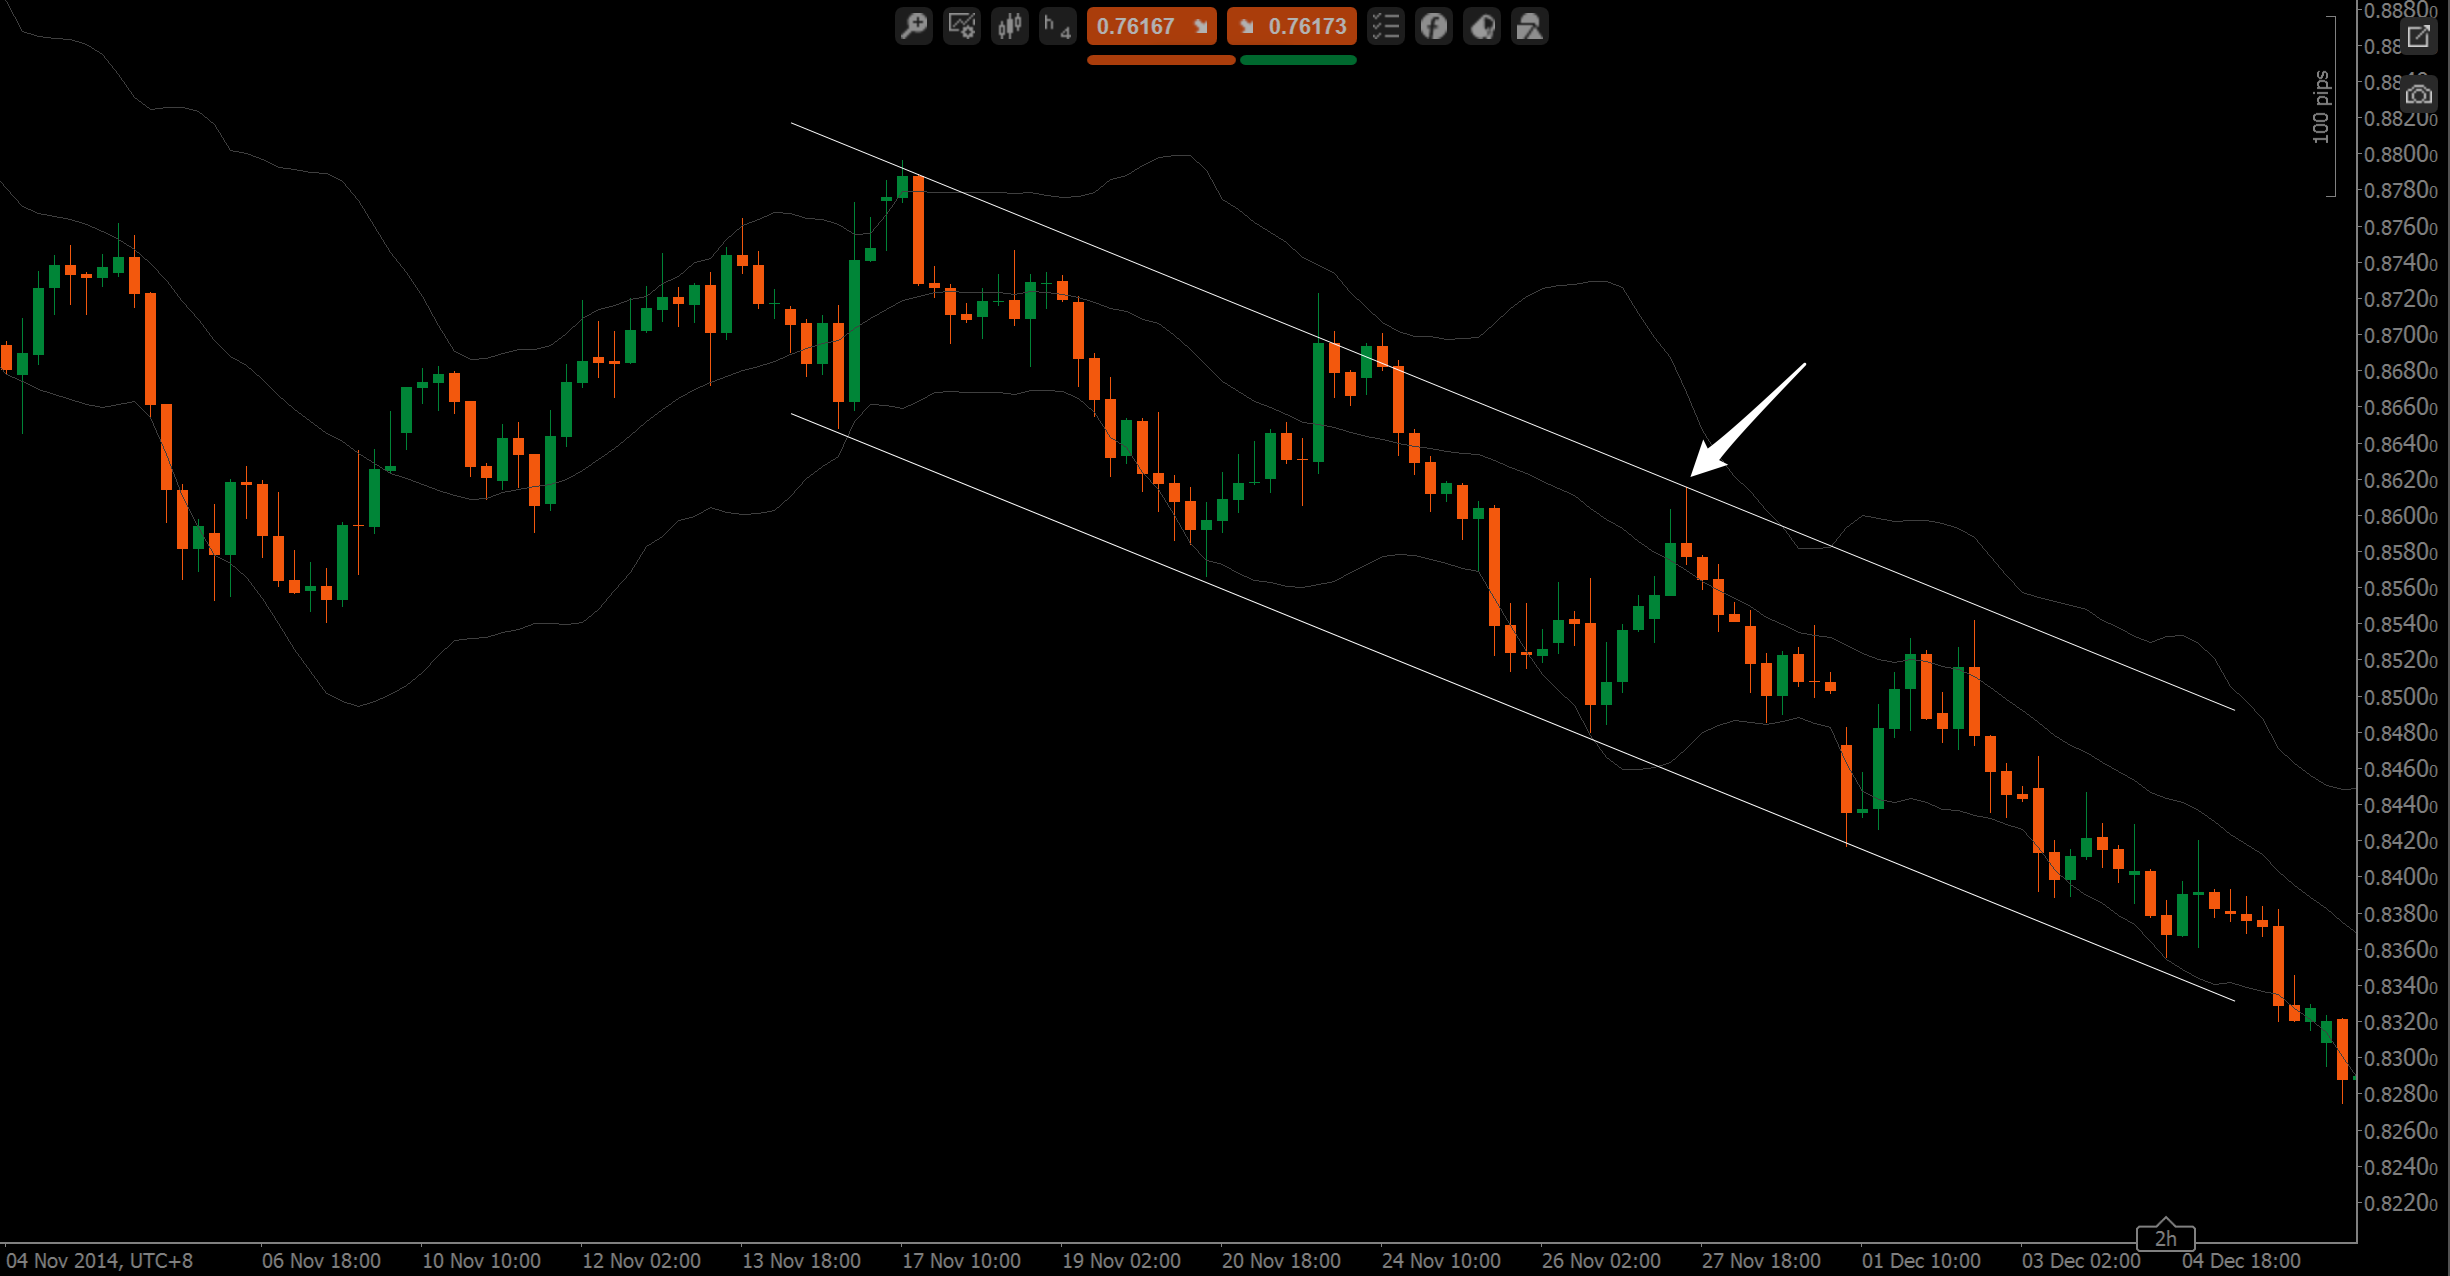
These offer fantastic RRR trading opportunities and I get excited every time I see one of these. We always trade our setups back to the other side of the channel, without any exception – and almost always but not necessarily with the trend. Note that we get a confirmed channel after 2 hits on both sides, and after these 4 hits, the chances to break out of the channel increase with every hit.
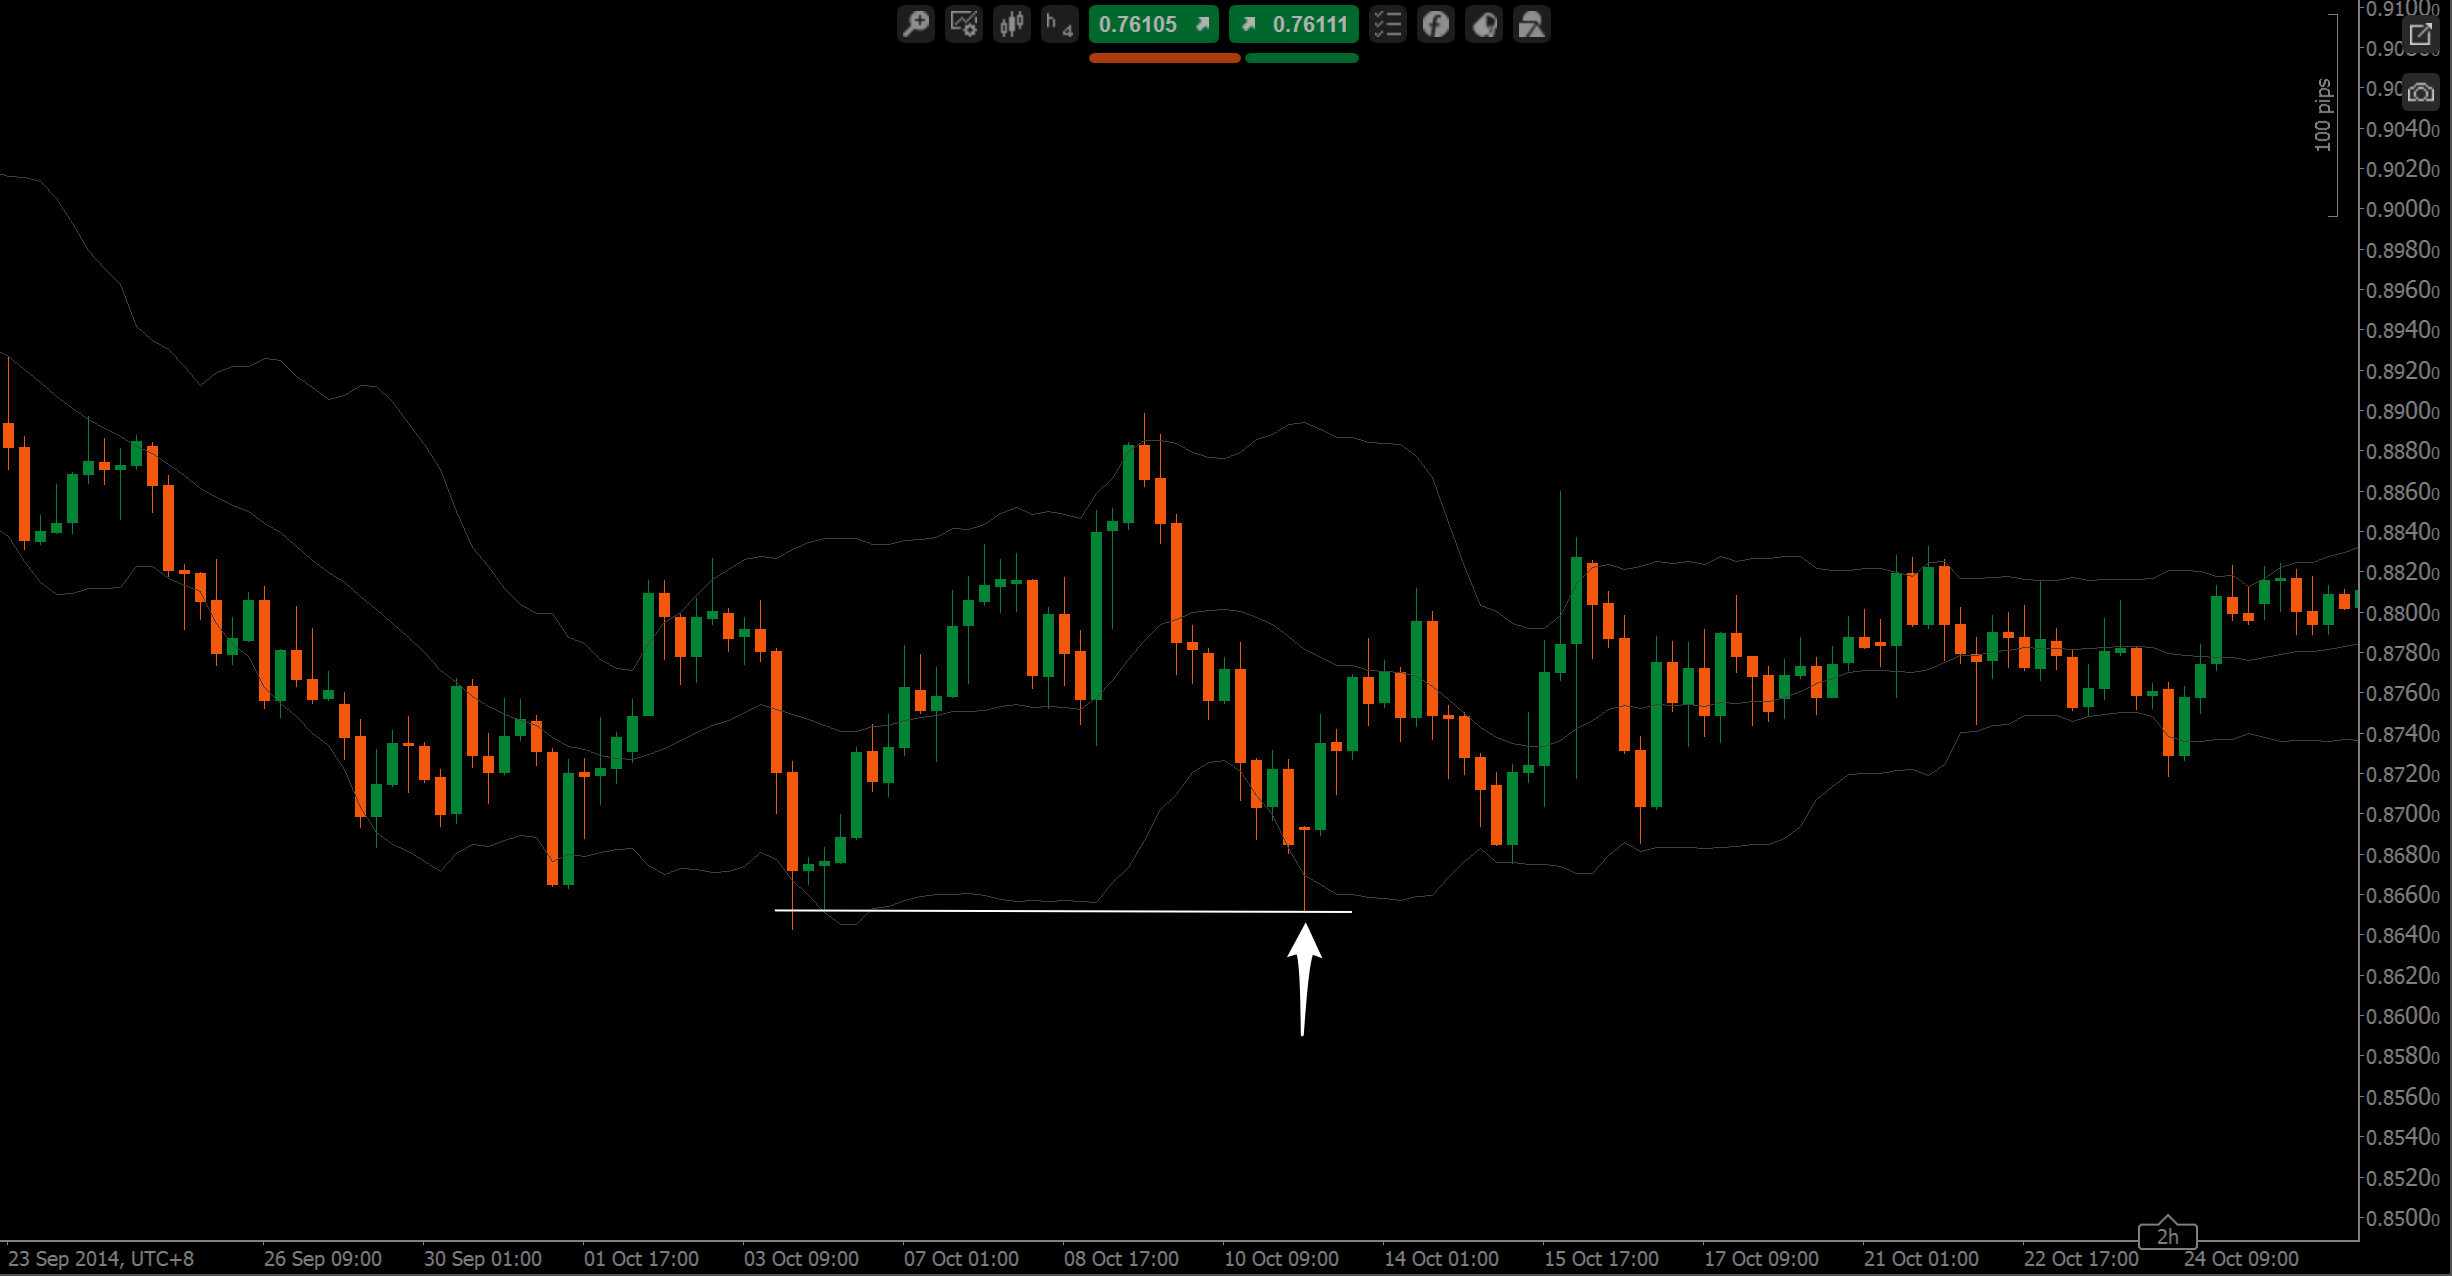
Well, not much to say here – you look for a U-shaped price pattern that looks like a bucket, and this acts VERY often as S/R. If we get a price action signal, ka-blam!
Fakeouts (read more about fakeouts here) happen all the time and everywhere on any chart. It is absolutely normal price behavior to spill a bit. Nevertheless, these can add confluence to our trade if a strong level, trendline, or previous swing gets faked out for a bit, and we get a strong close into the other direction. Basically, anything that would trap breakout traders and make them suffer, is when we start looking closely.
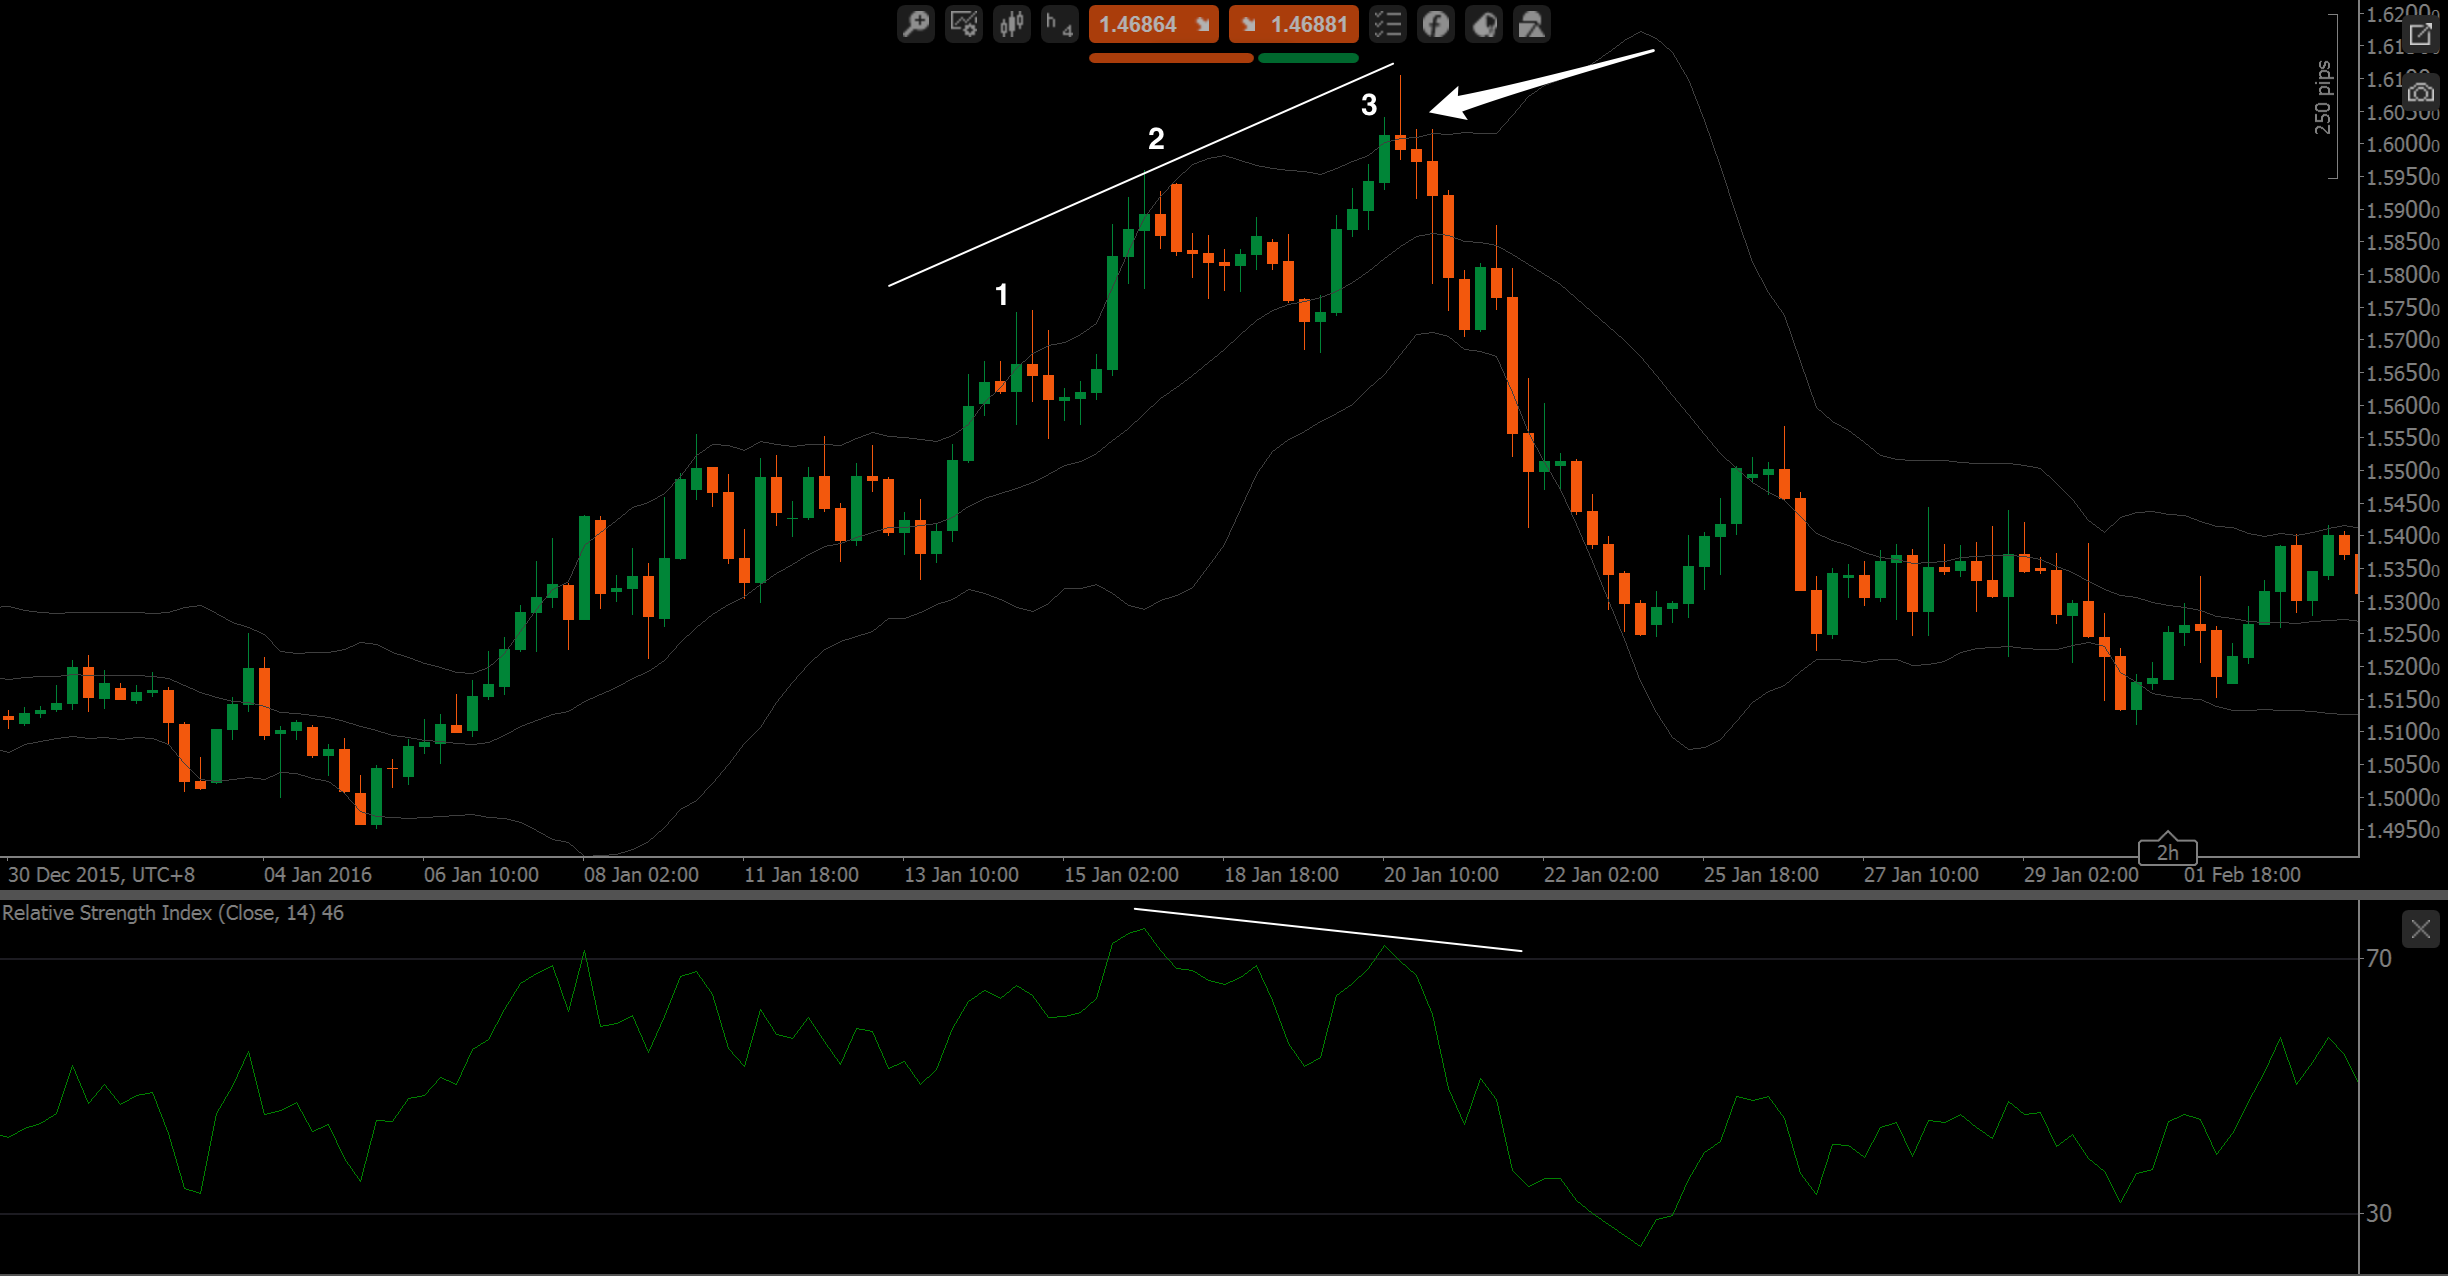
Basically, three shoves to the upside/downside – this is in accordance with Elliot Wave theory that says that after 3 waves a trend is (usually..) about to reverse. These can be played with as well as against the trend – if these show up and at the third tap we get a price action signal, but there is NOTHING else like a level or a macro structure like a H&S, we NEED divergence to get in – I use the RSI for that purpose. These are a great tool to find waning momentum and capitalize on it. These are the weakest of the chart patterns as they cannot be traded just by themselves – but then again, most of the time they do not show up by themselves and are usually accompanied by 1-2-3’s, H&S, channels, etc.
Whenever I spot one, I stay far, far, far away from that market. These are horrible to trade and do not give us clear swing points. They are for breakout traders and have a very low win rate, absolutely not suitable for our trading. This is especially true for symmetrical triangles. For triangles with a flat top/bottom, we can trade the retest once it broke out, but ONLY then.
And that’s it for chart patterns. There are countless others but I have found them to be quite useless and/or they are already included in the patterns I described here. Keep it simple. Now there are some other tools I use as well for deciding whether or not to enter a trade.
In 99% of cases, these come along with our chart patterns to either give them even more weight, or to deny us a trade, for example, if a level is just in front of our entry.
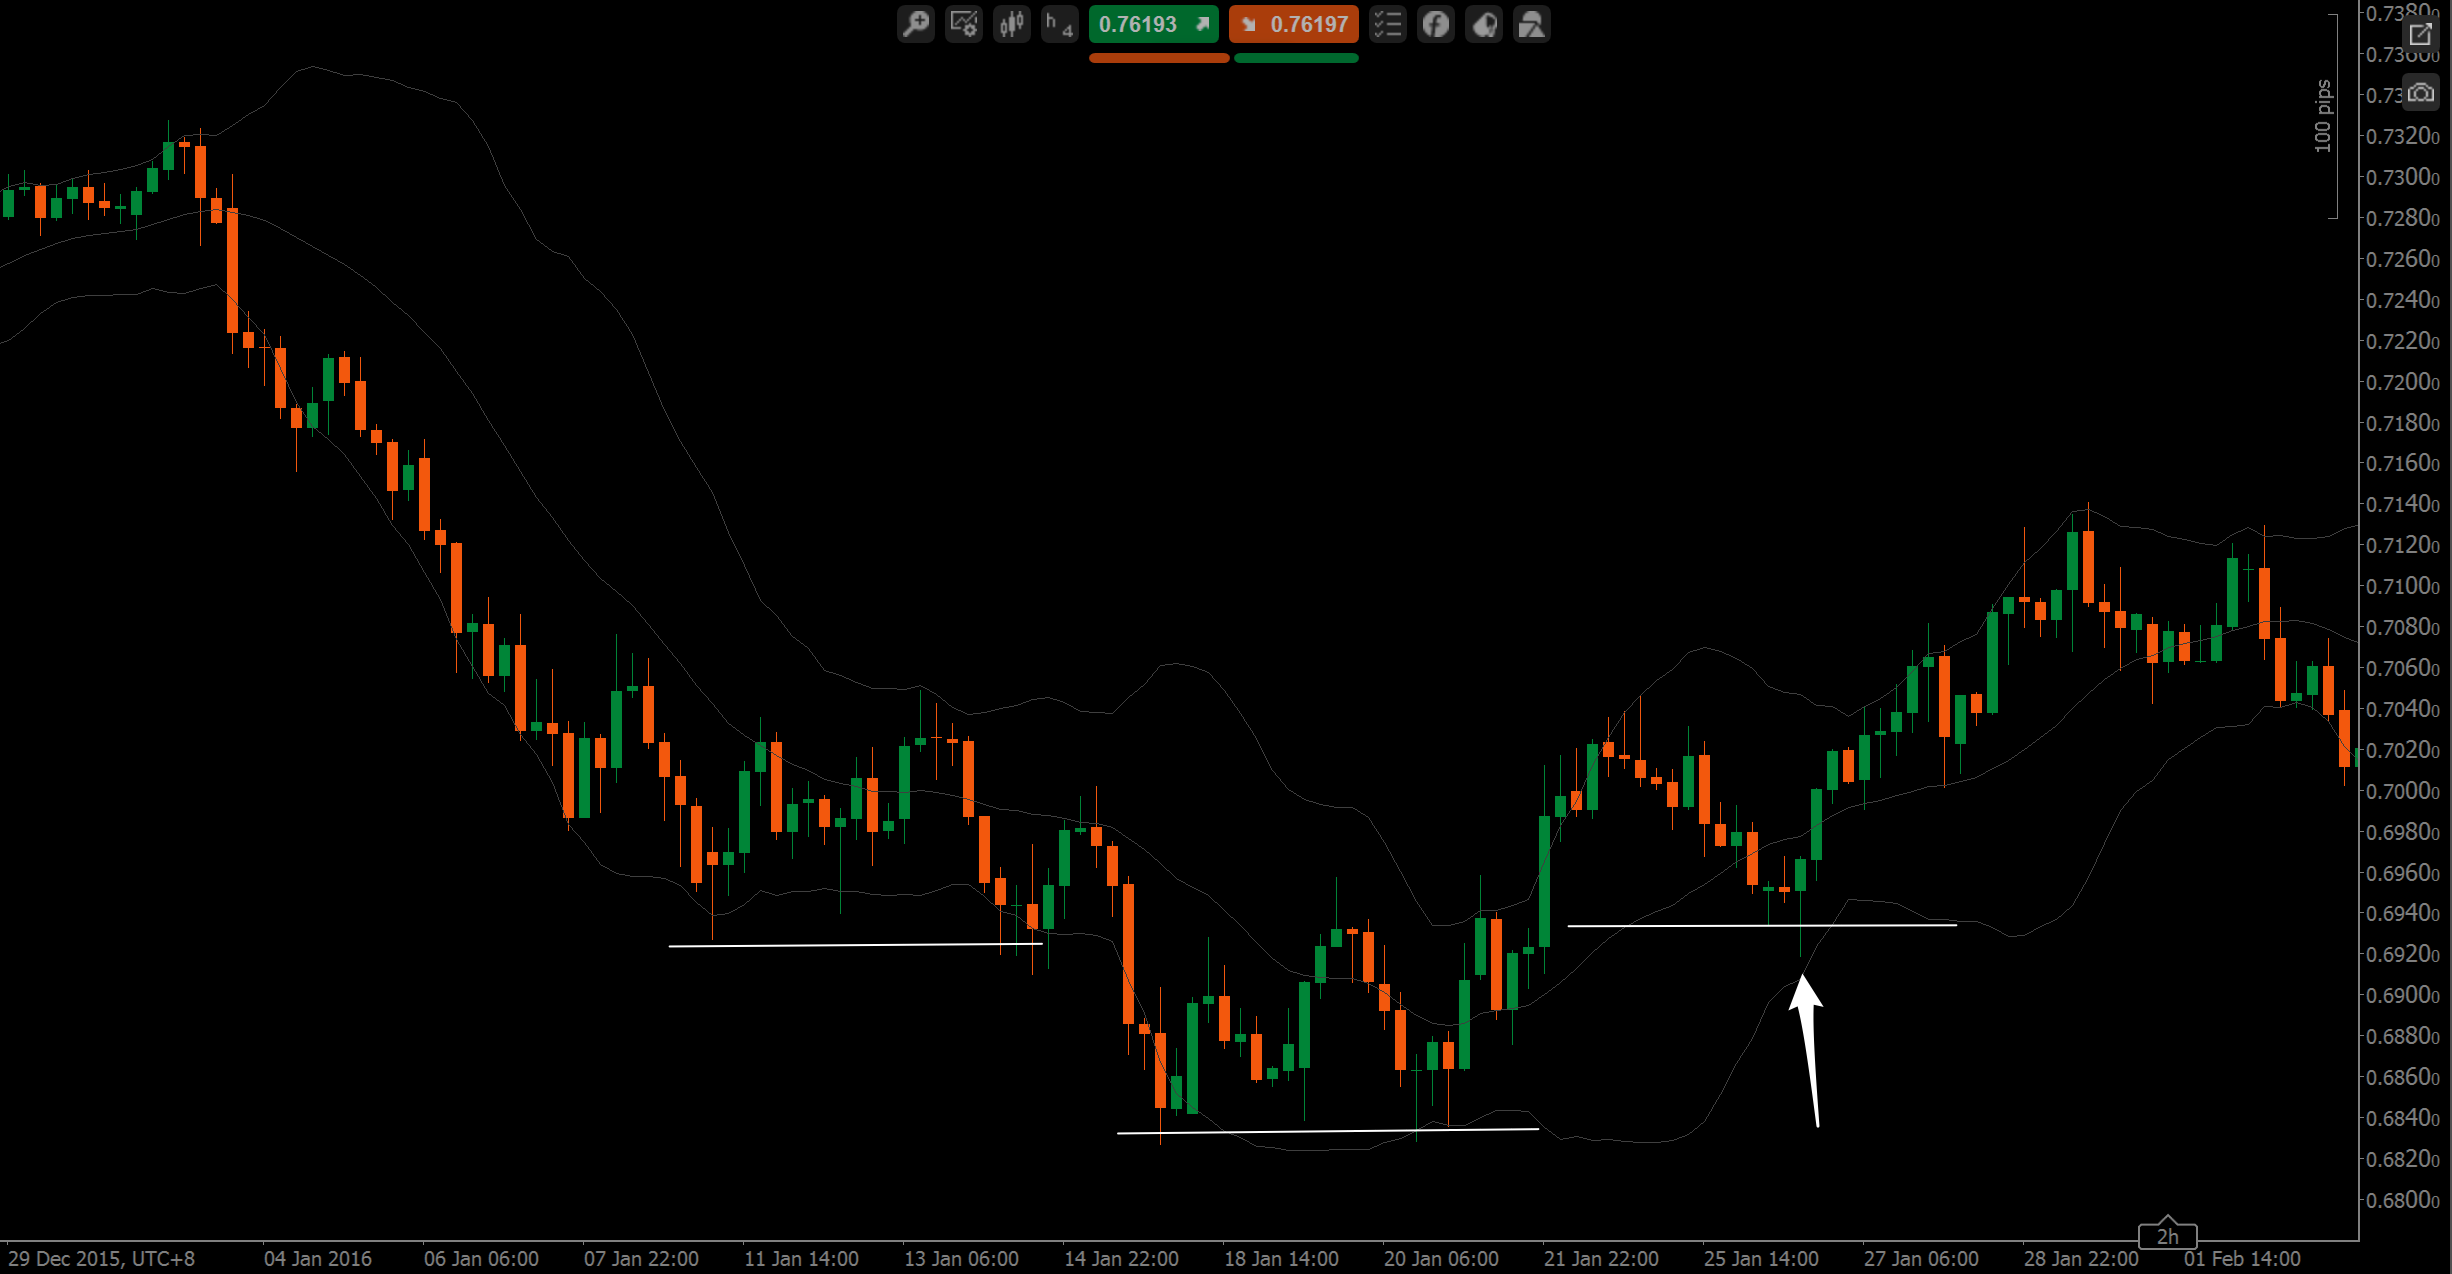
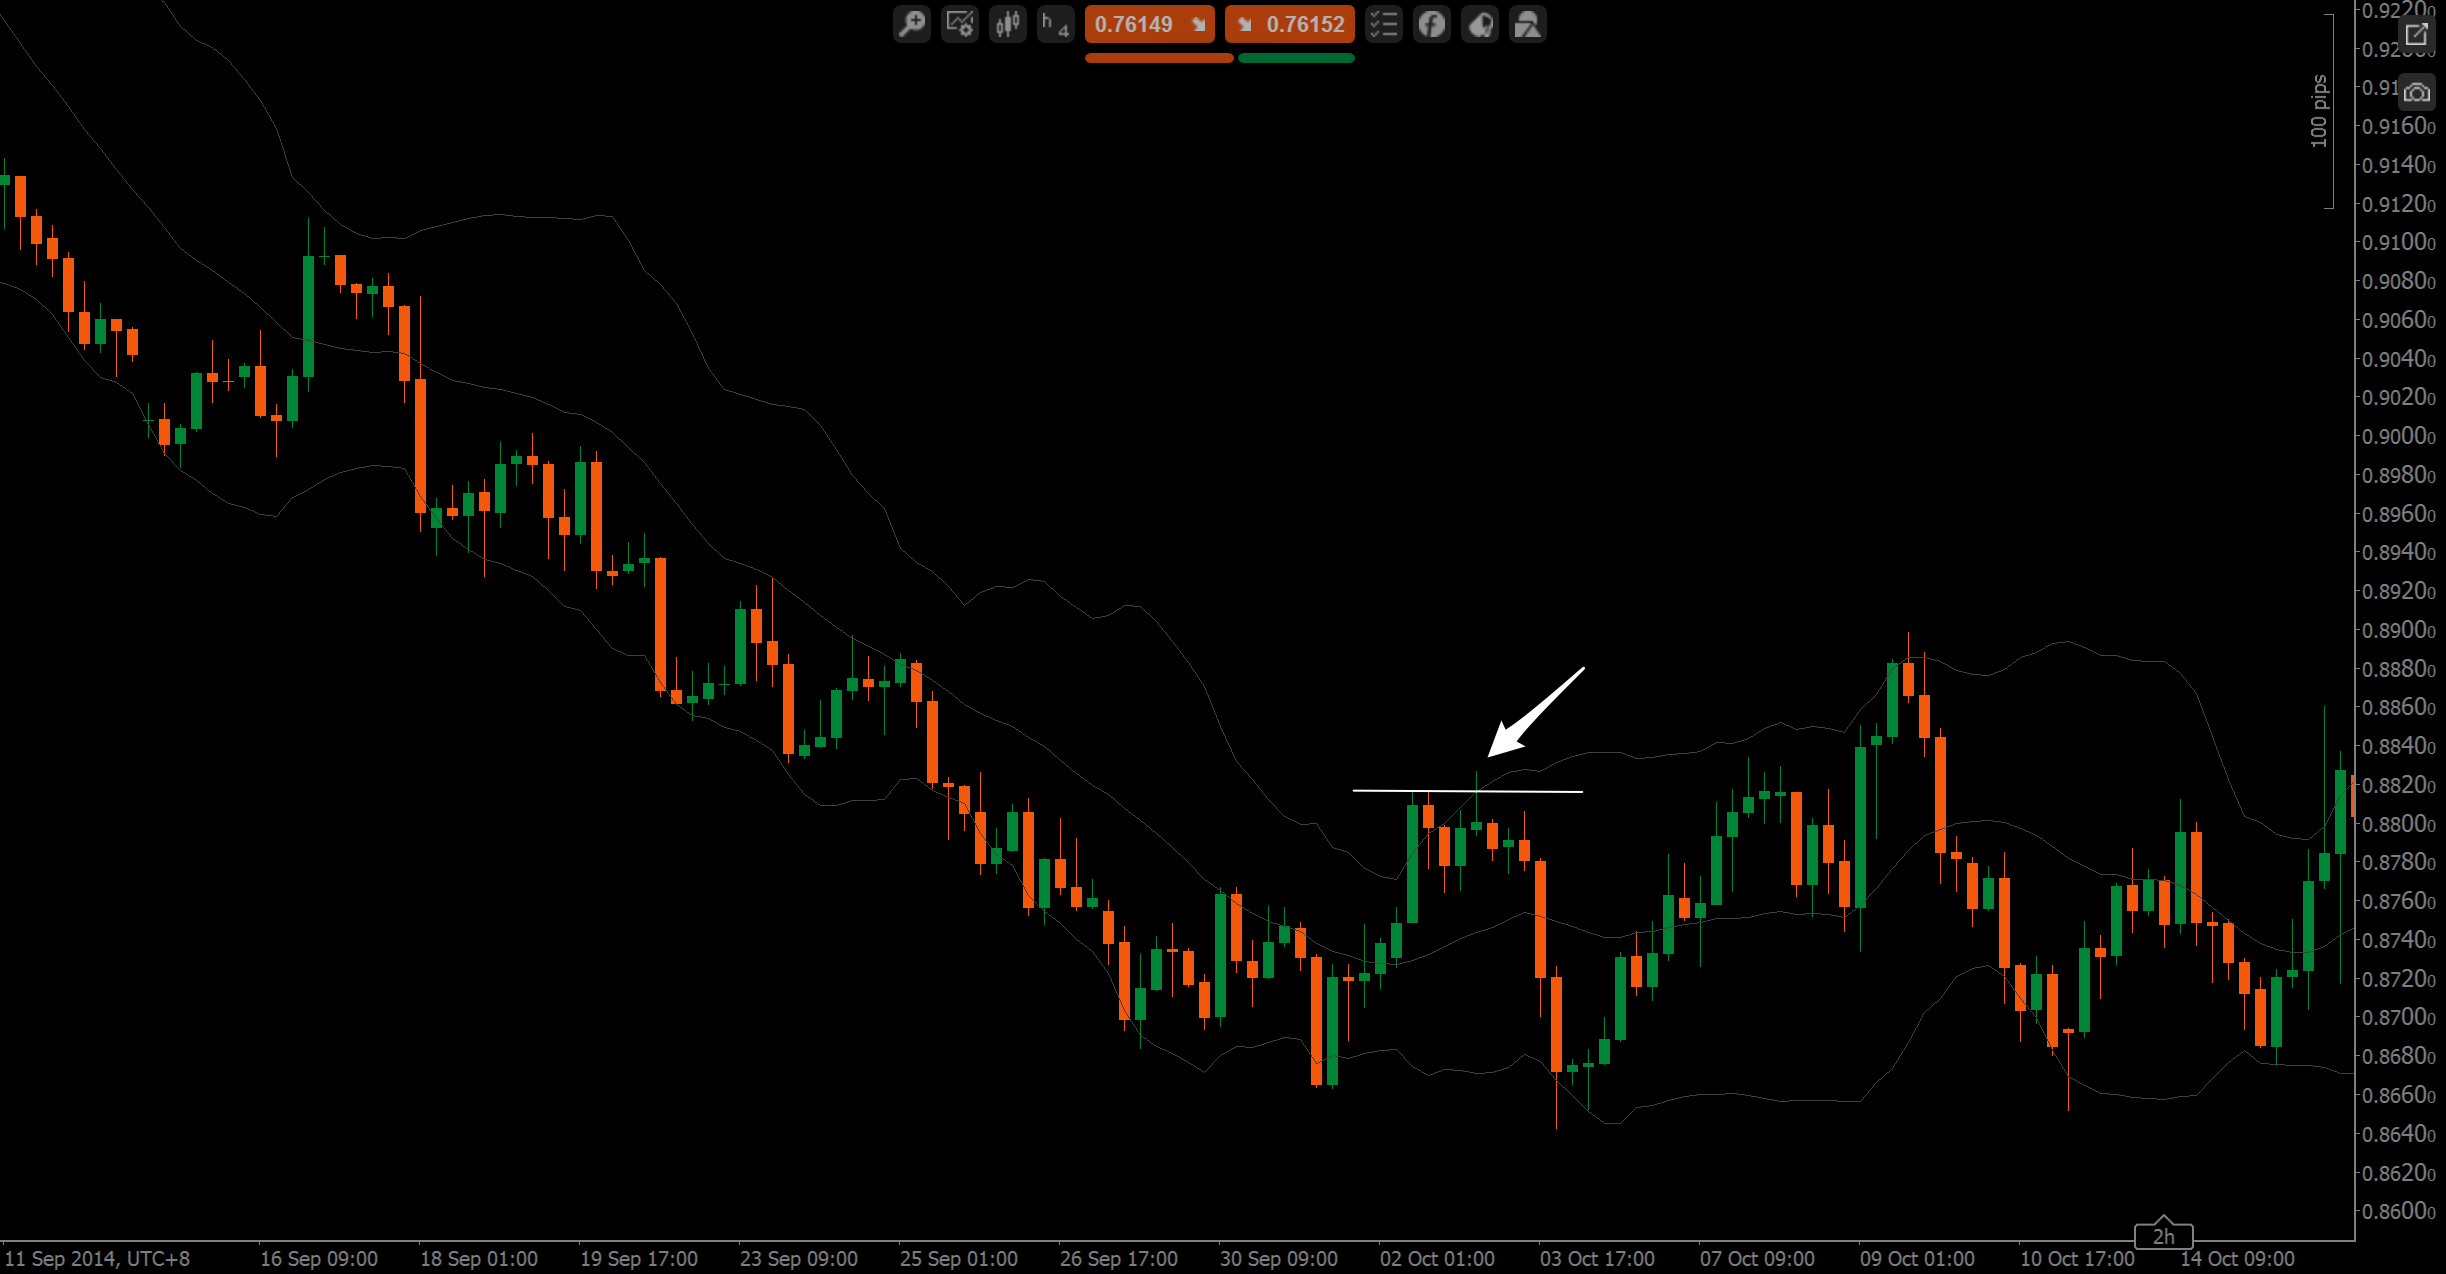
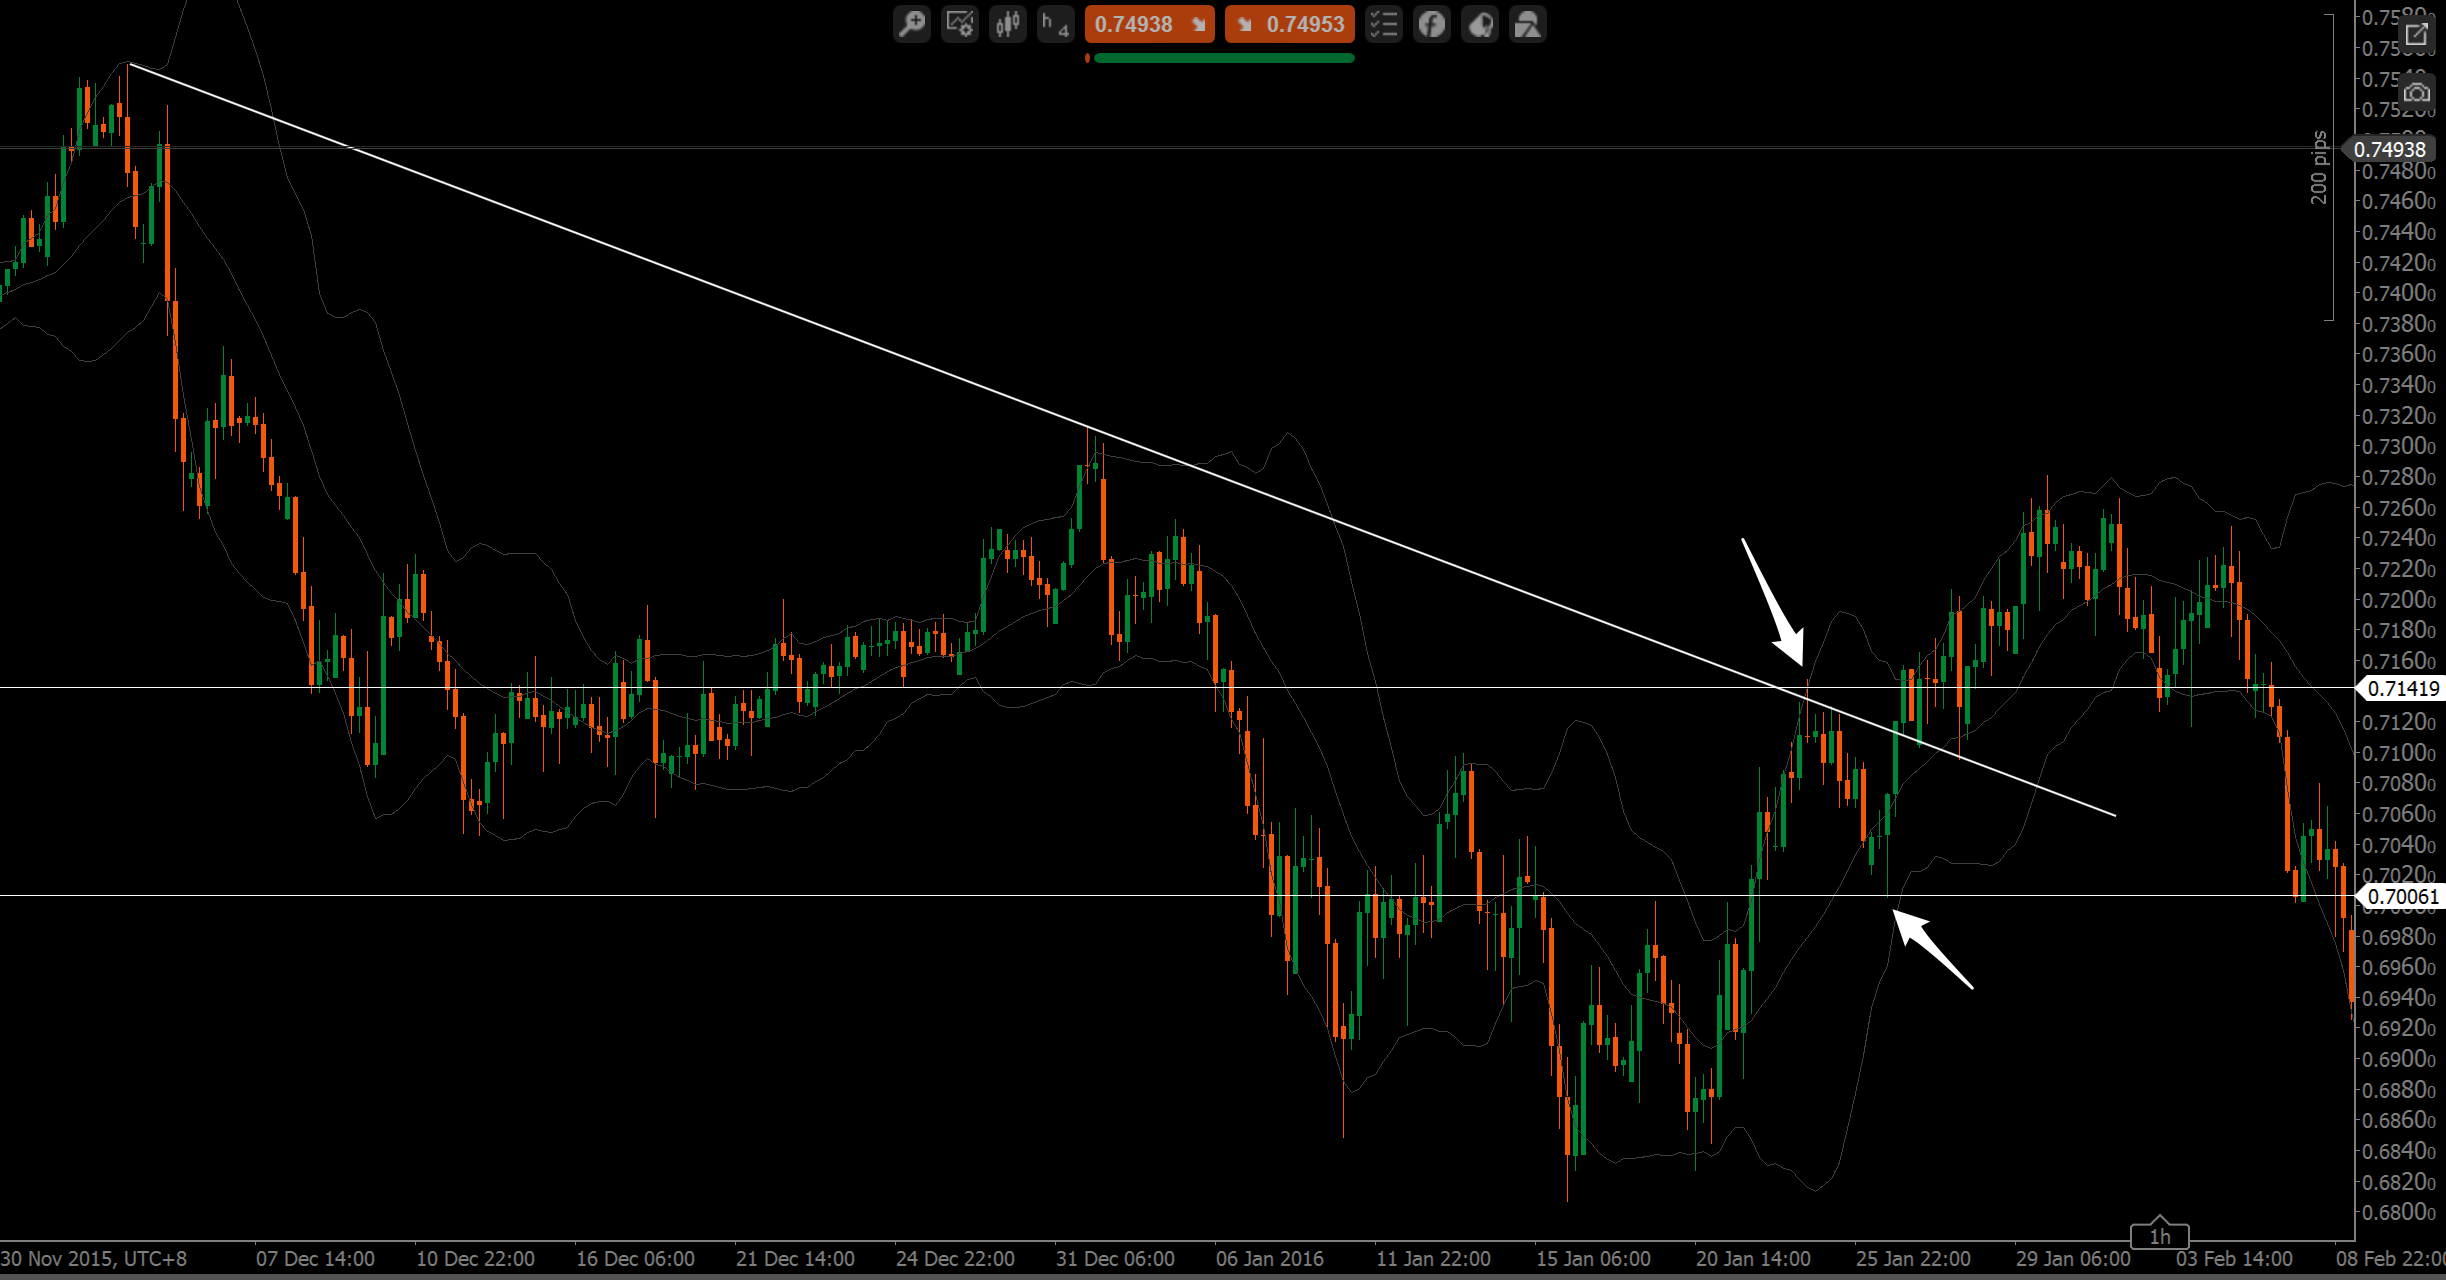
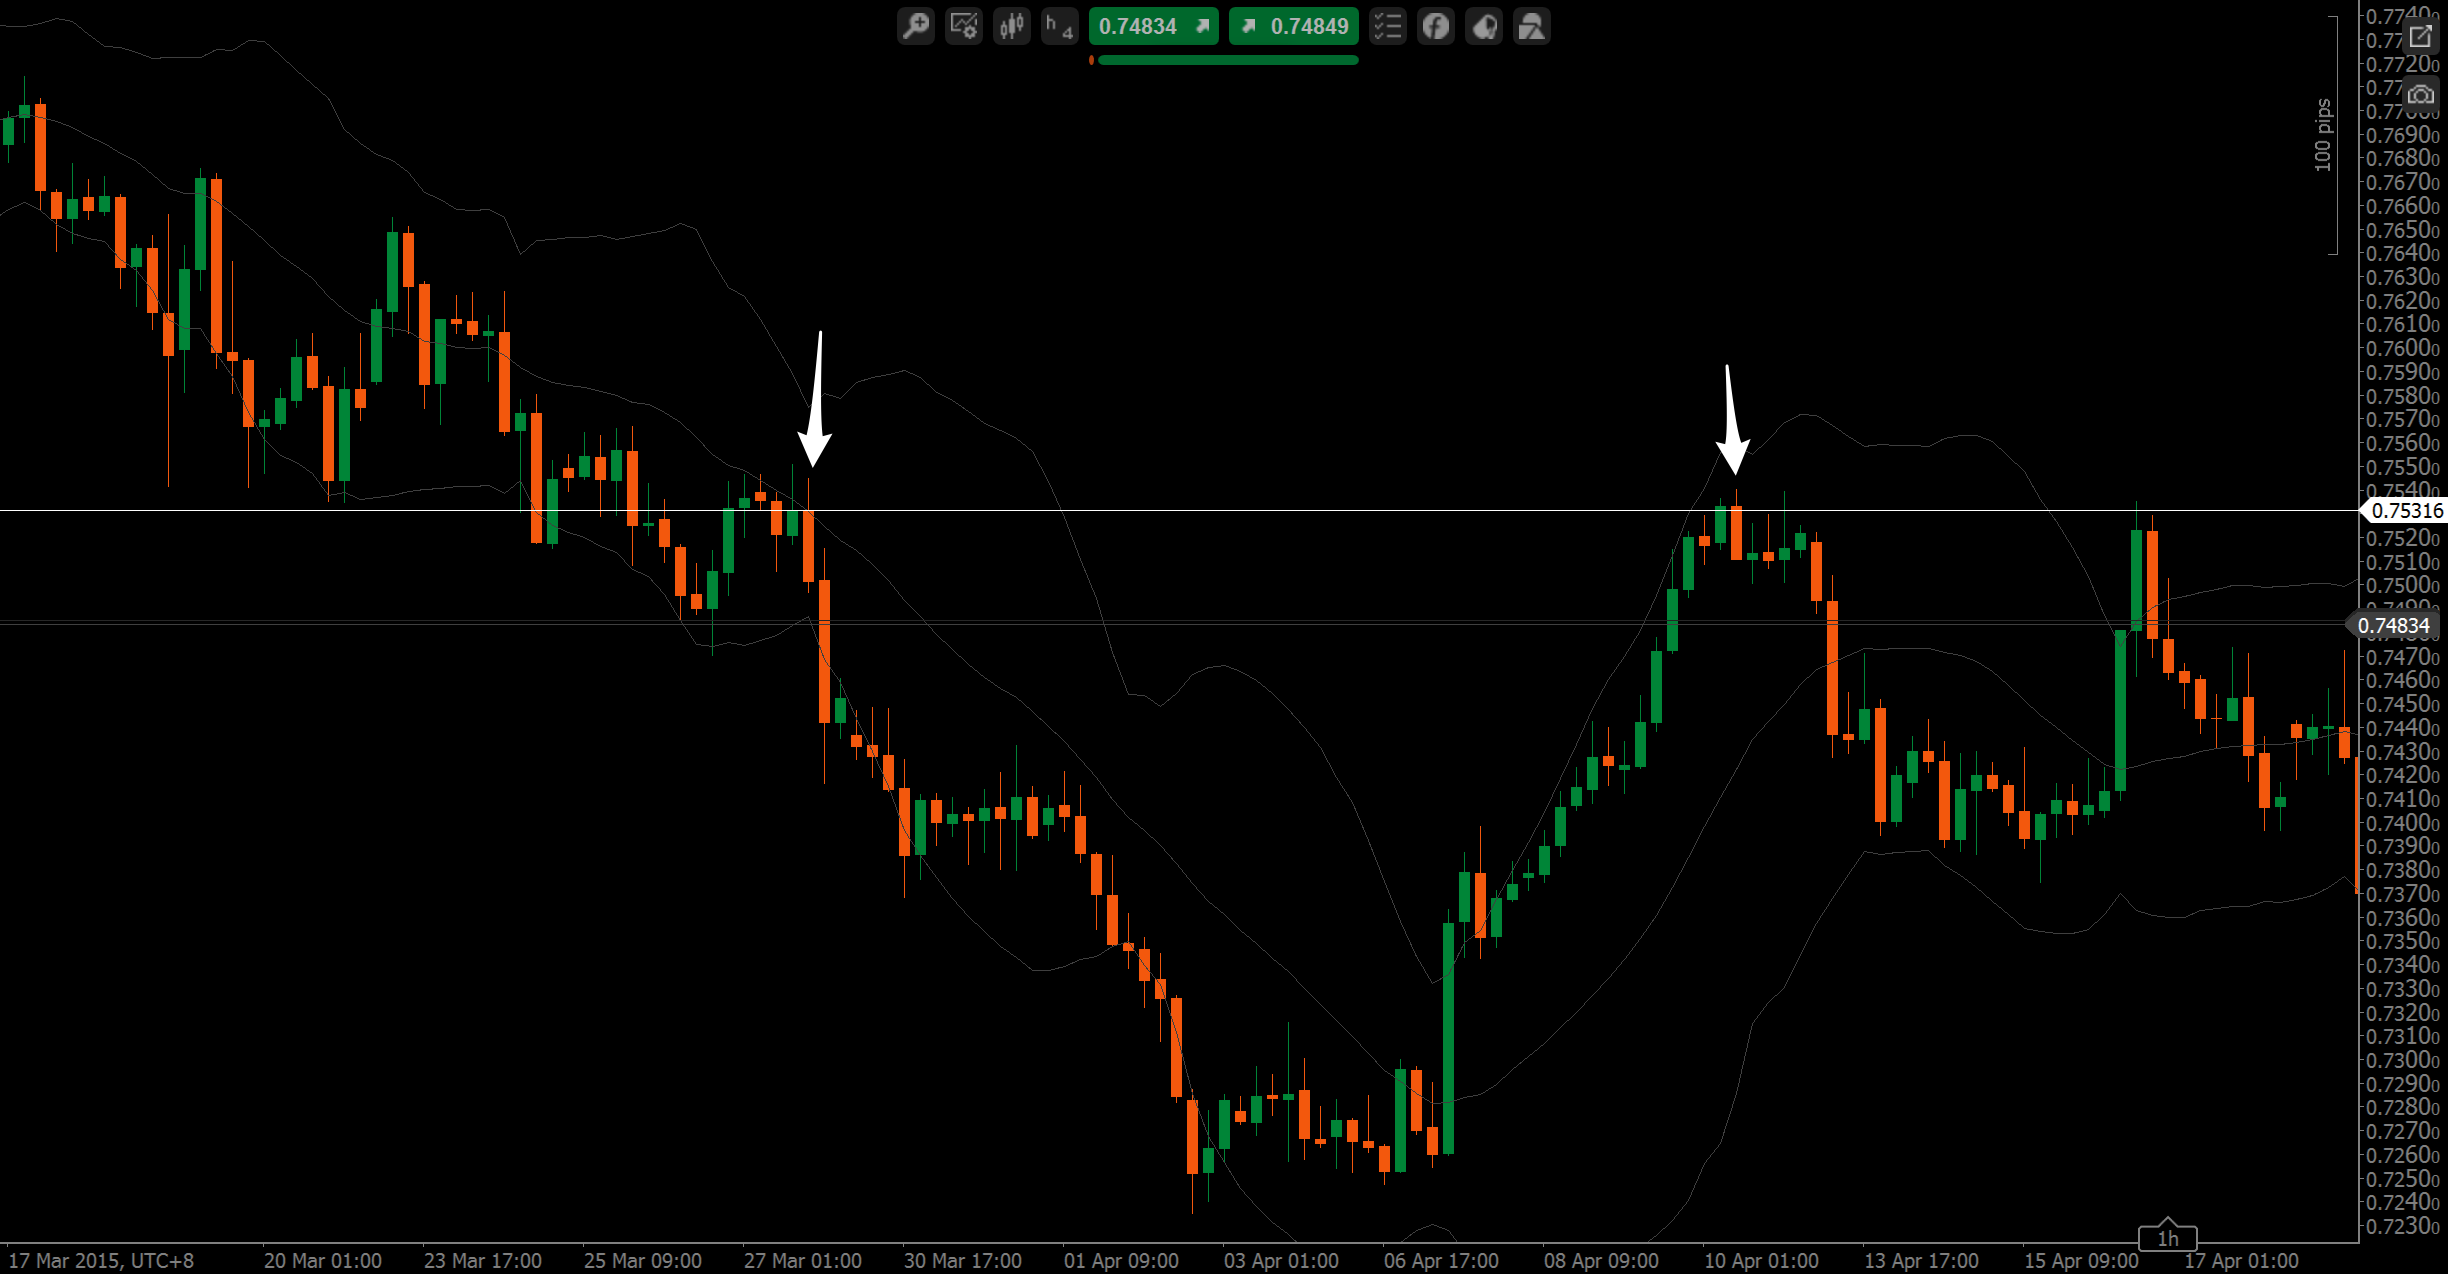
Support and resistance levels go a long way. I know traders that trade only these and make good money. I have always found them to be very ambiguous, and never got very warm with them. But when I see an obvious one, I will paint it into my chart. Also, I see these more as zones than as levels. For most of our chart patterns, they already have levels incorporated so if these flow with major levels, even better – for example, if we get a double top, then a pin bar, and we zoom out a bit and see that the double top was formed at a very obvious level on the daily chart – I’m in. But they are not a must-have. We have to zoom out a bit to see them properly. Of course, playing 1-2-3’s or fakeouts also requires us to see S&R levels, however, I draw them locally with swing points which are very obvious. Zooming out most of the time brings me more confusion than clarity, to be honest. Also, we want a S&R level to be a flip zone to have more confluence, which means the level acted as both support and resistance in the past. I am NOT comfortable playing ONLY a level and a price action signal. I need more. I need patterns. As you can see in the picture below, on the pin bar to the left, there was confluence with a major trendline. On the right, we have an engulfing outside bar played as a classic 1-2-3, but our point number #3 was accompanied by a macro level as well.
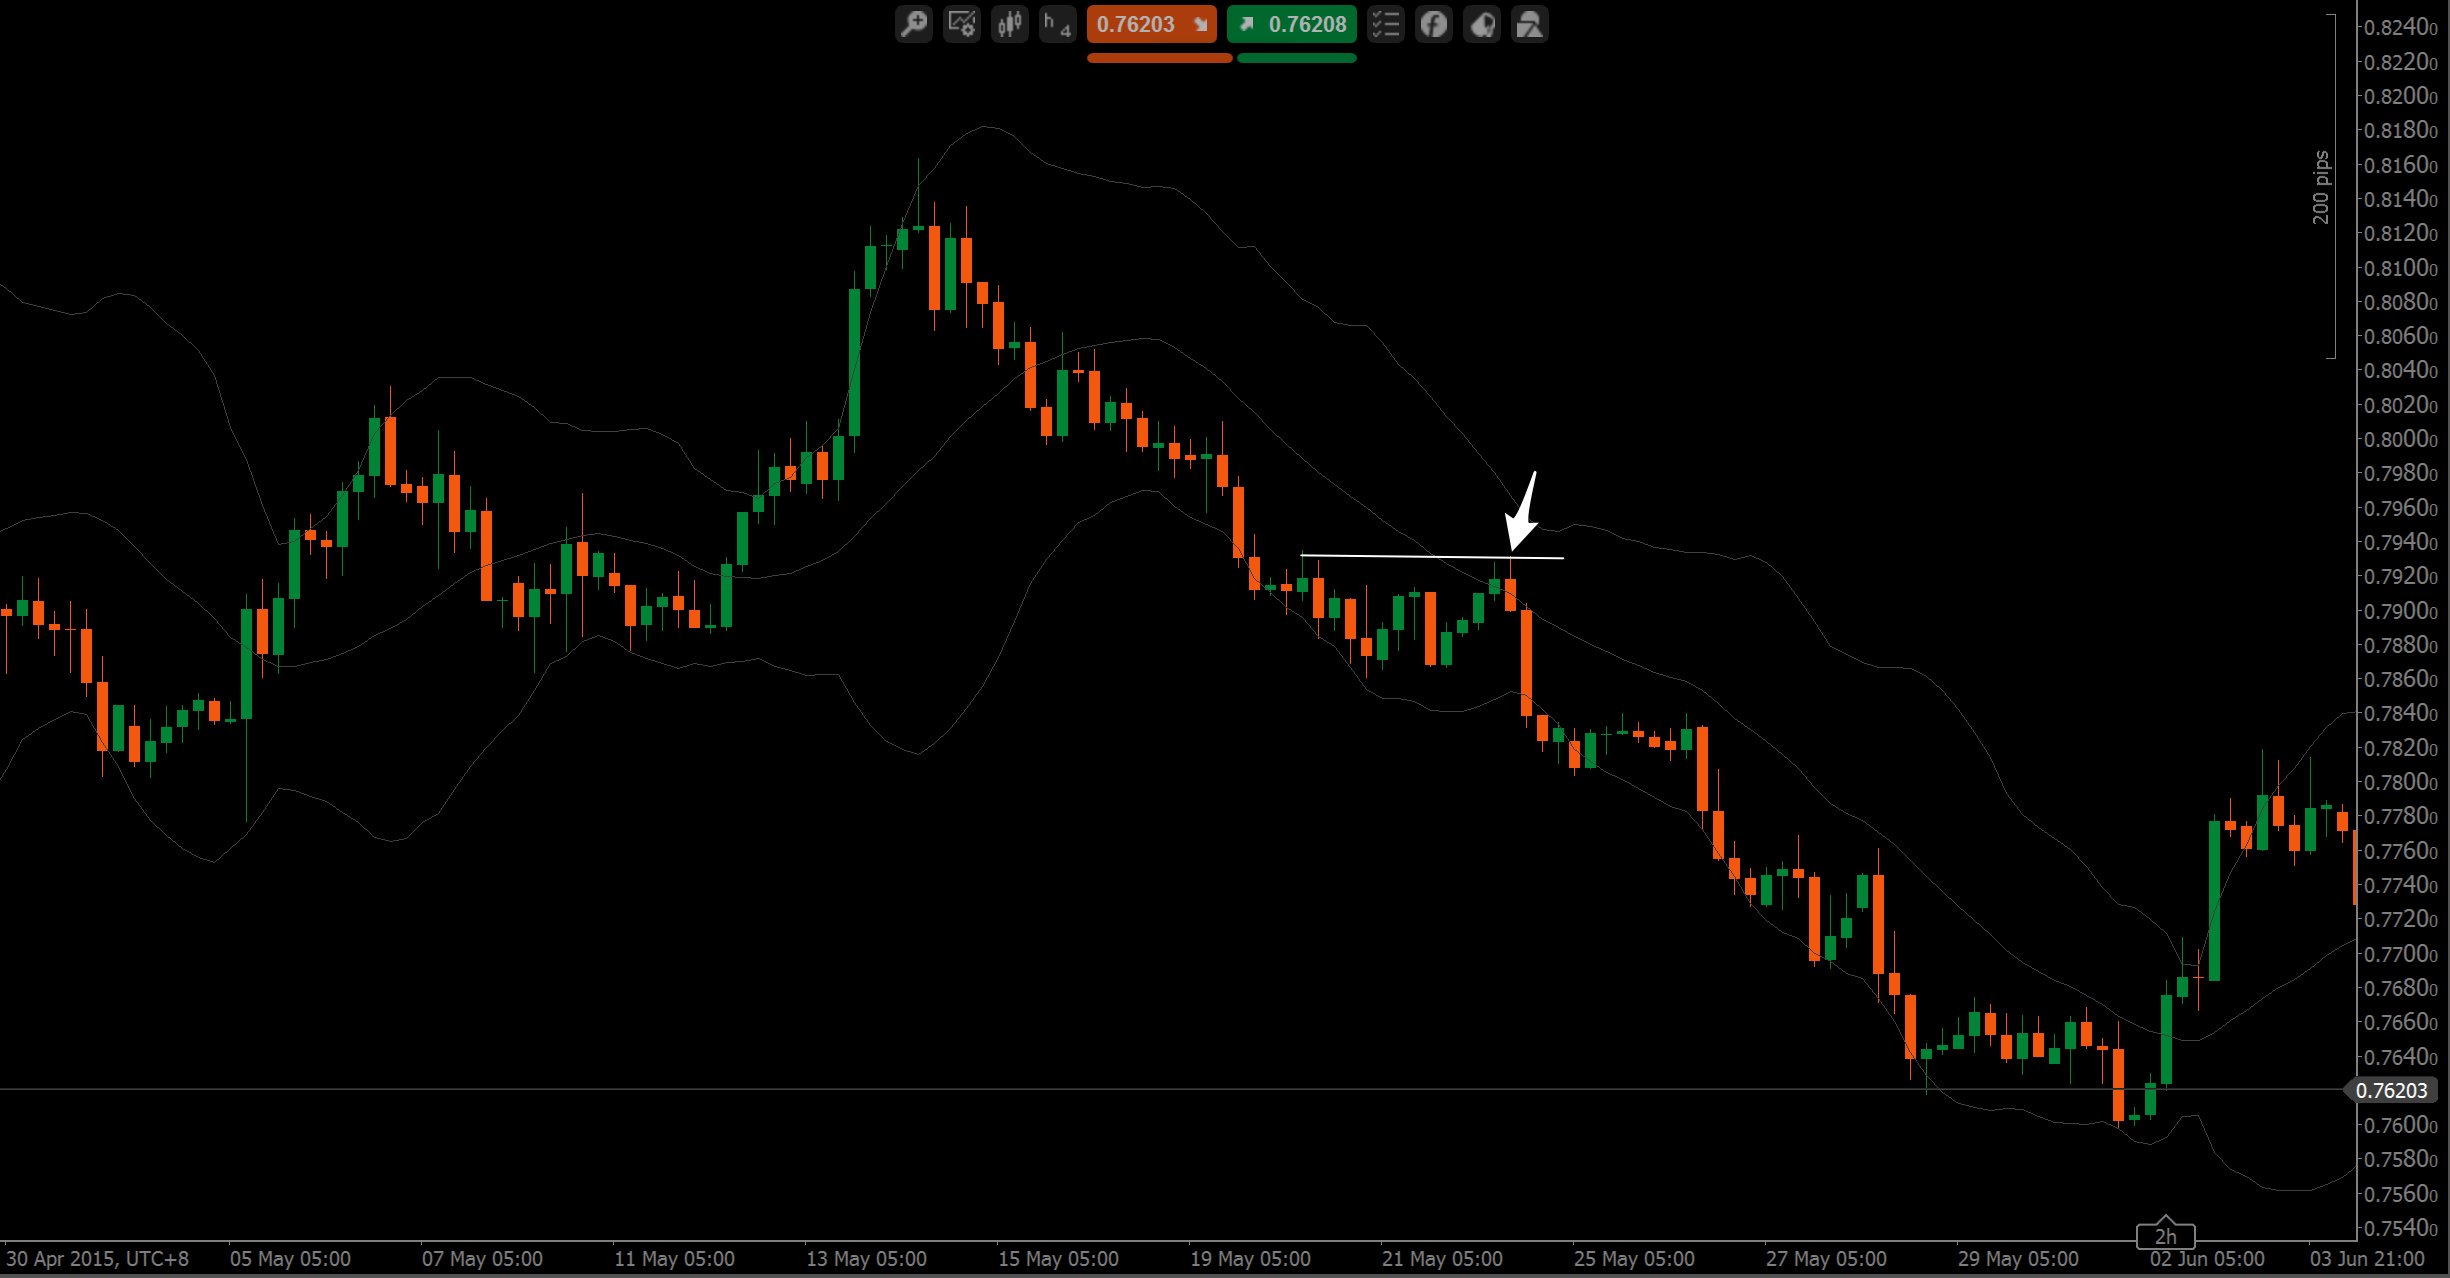
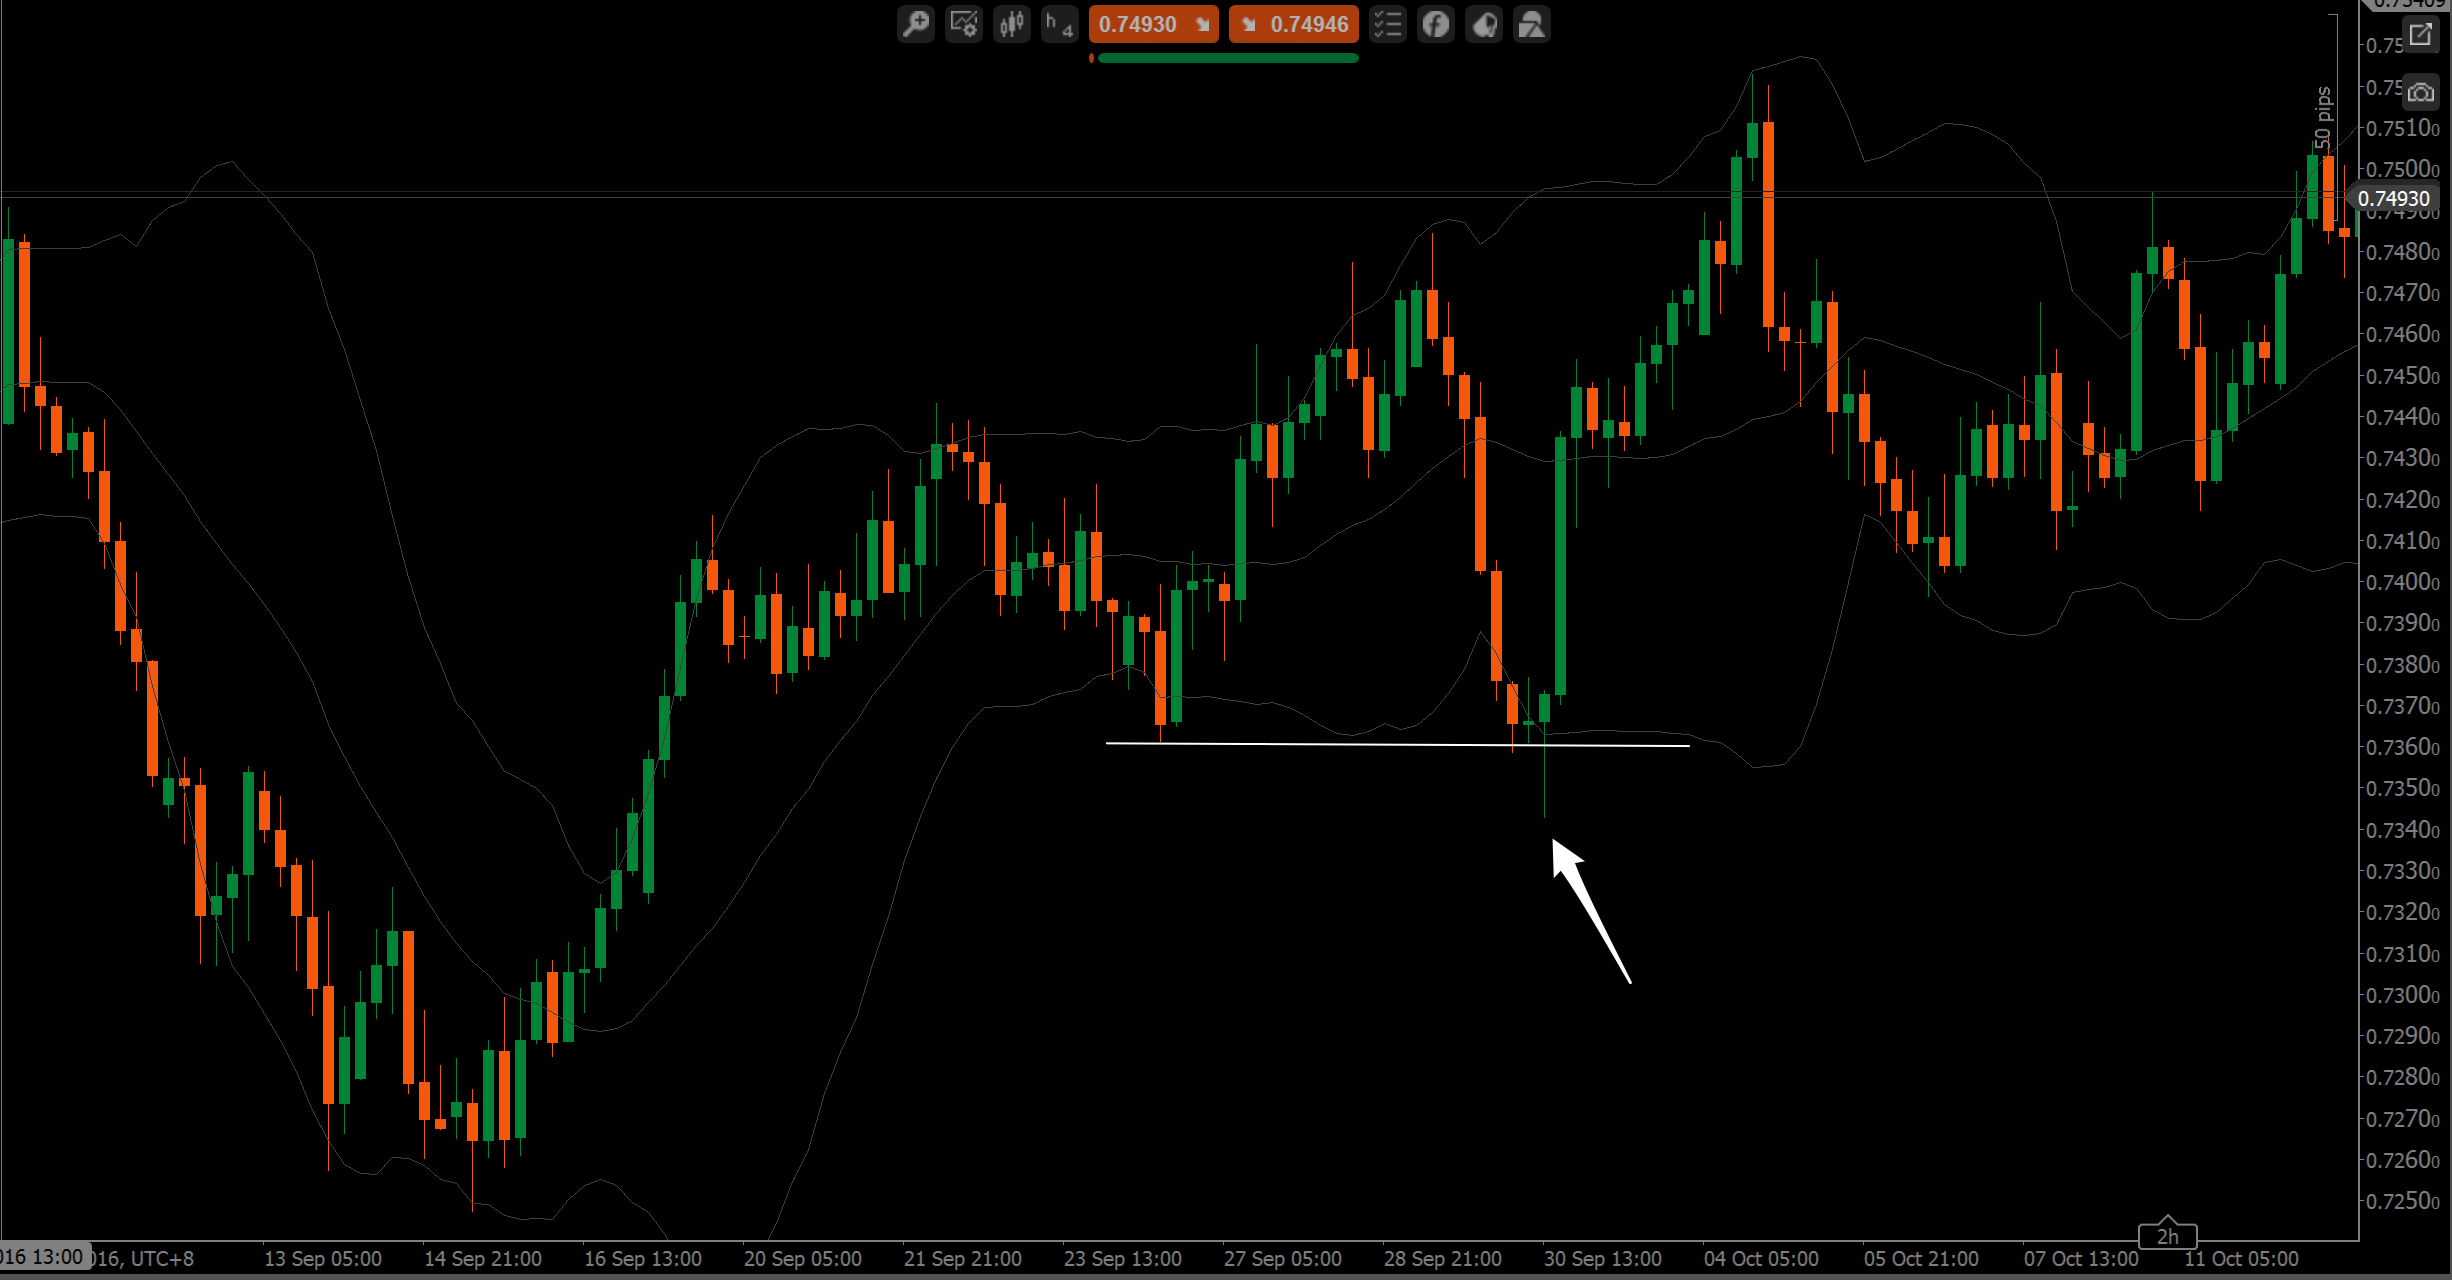
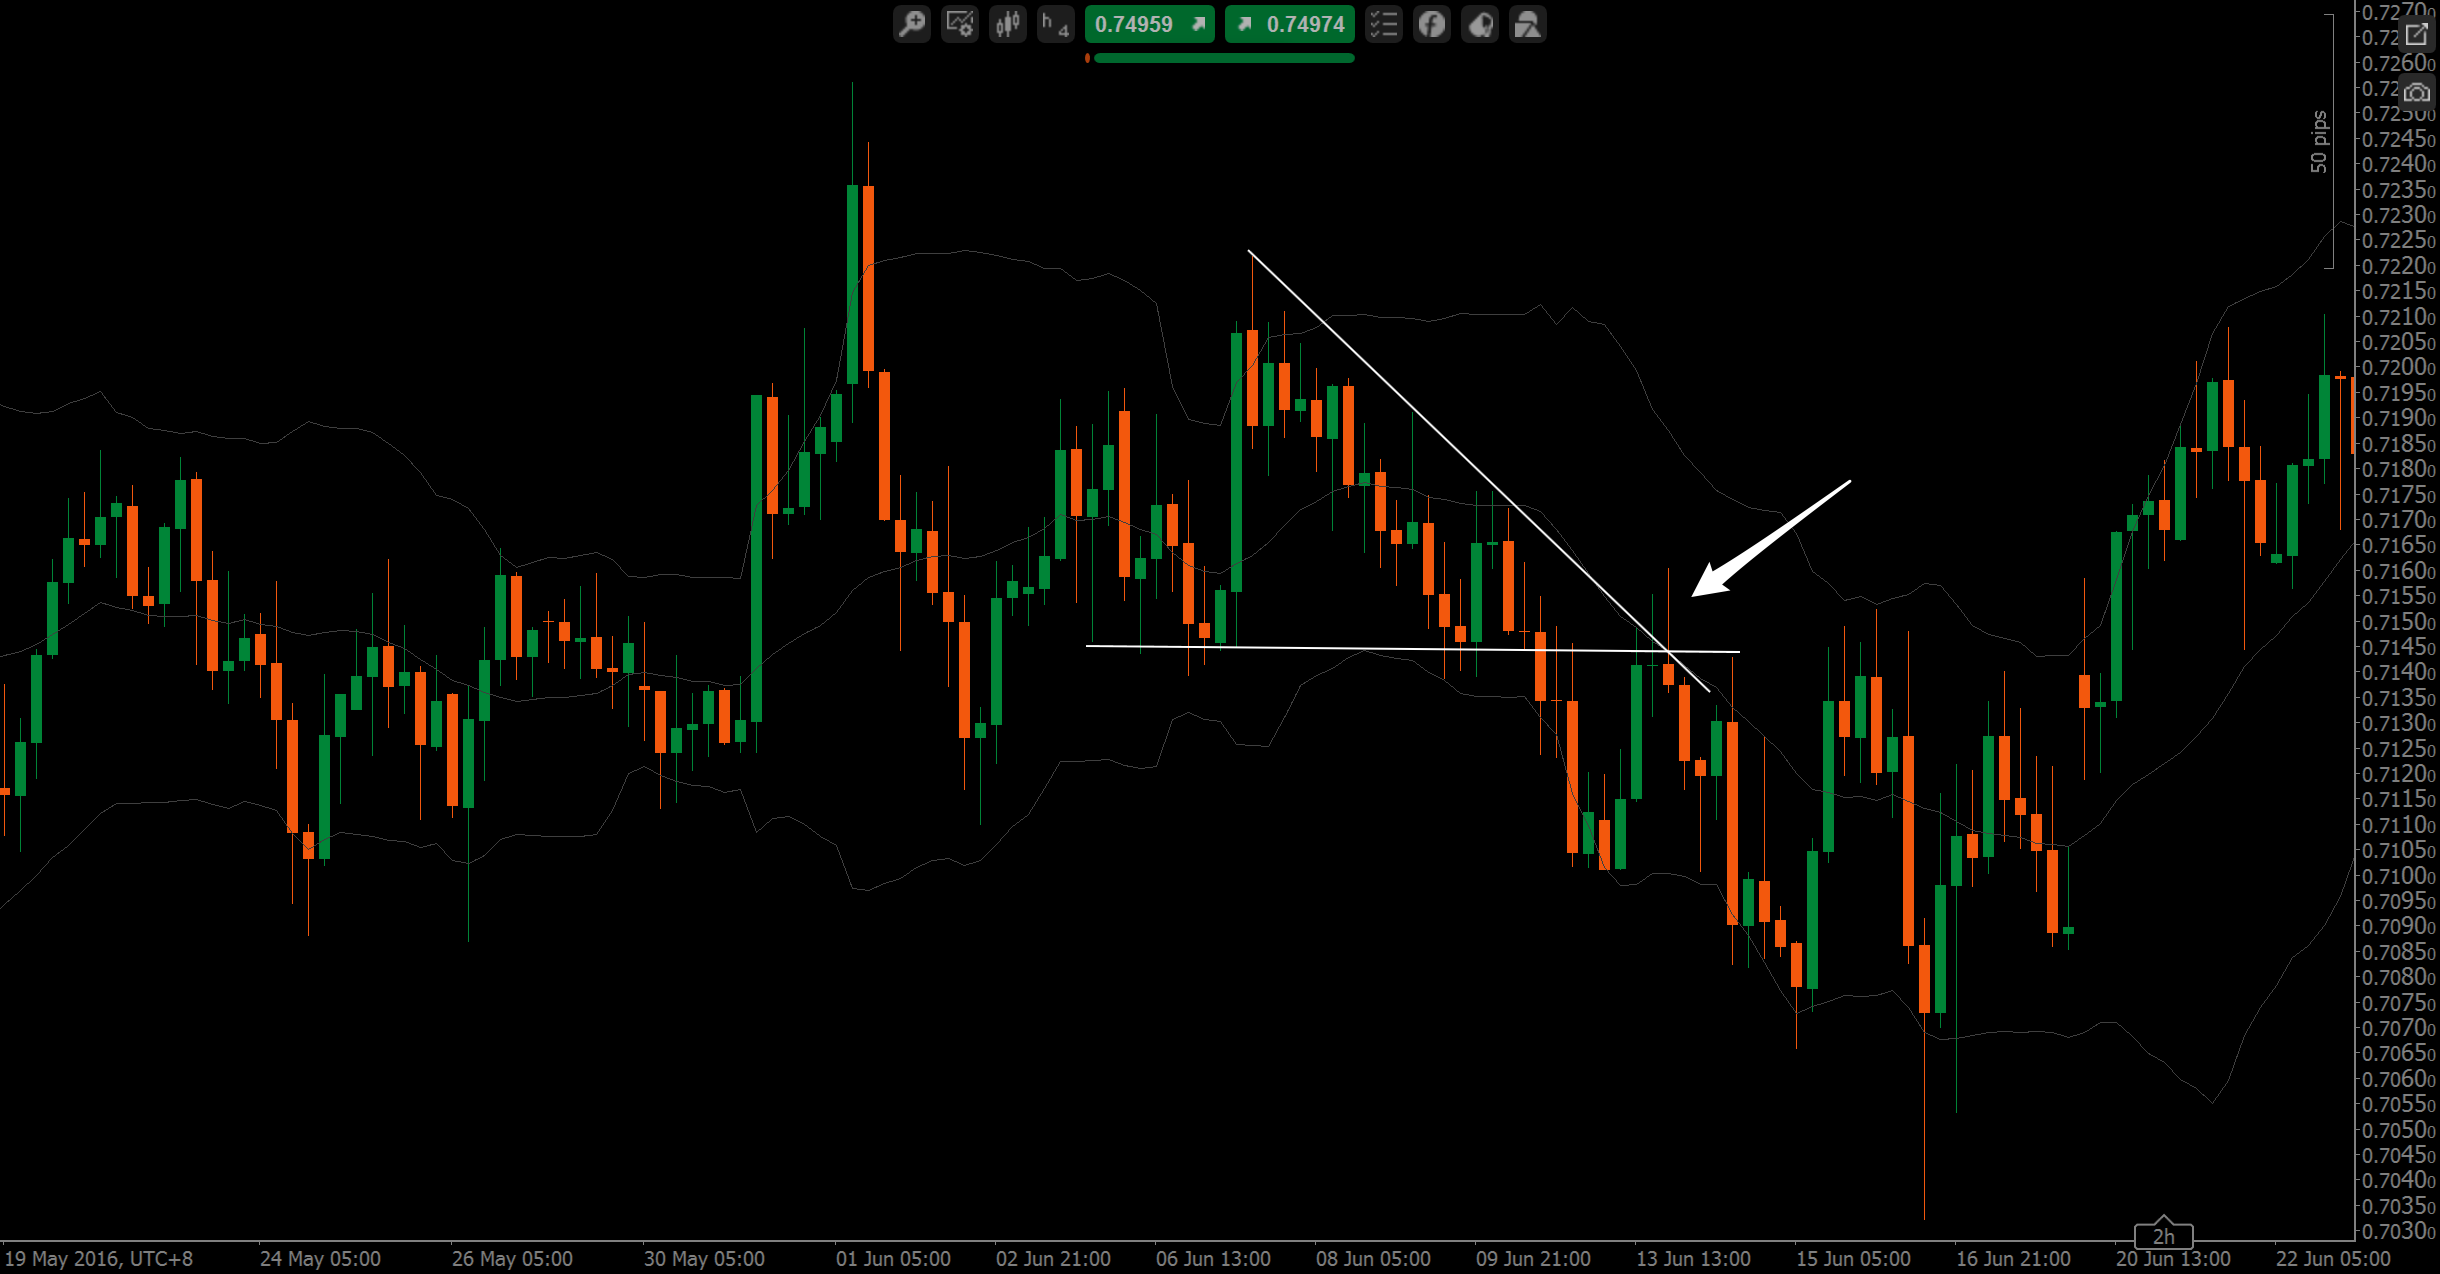
Now these I love much more. Basically, what you have to look for is a strong move away from a certain point and whenever price gets back to that point and we get a price action signal, that is one hell of a trade. Very useful for double/triple tops, and their fakeouts, but also for 1-2-3’s, and just simply a great thing to have on our charts and most of the time are accompanied by S&R. On the picture below, you can see that on the left arrow, price broke away brutally from this level. Once we came back, we got a bearish outside bar, signaling that there were still orders left there for another significant rejection to the downside.
Video: How To Find And Trade Supply And Demand Zones
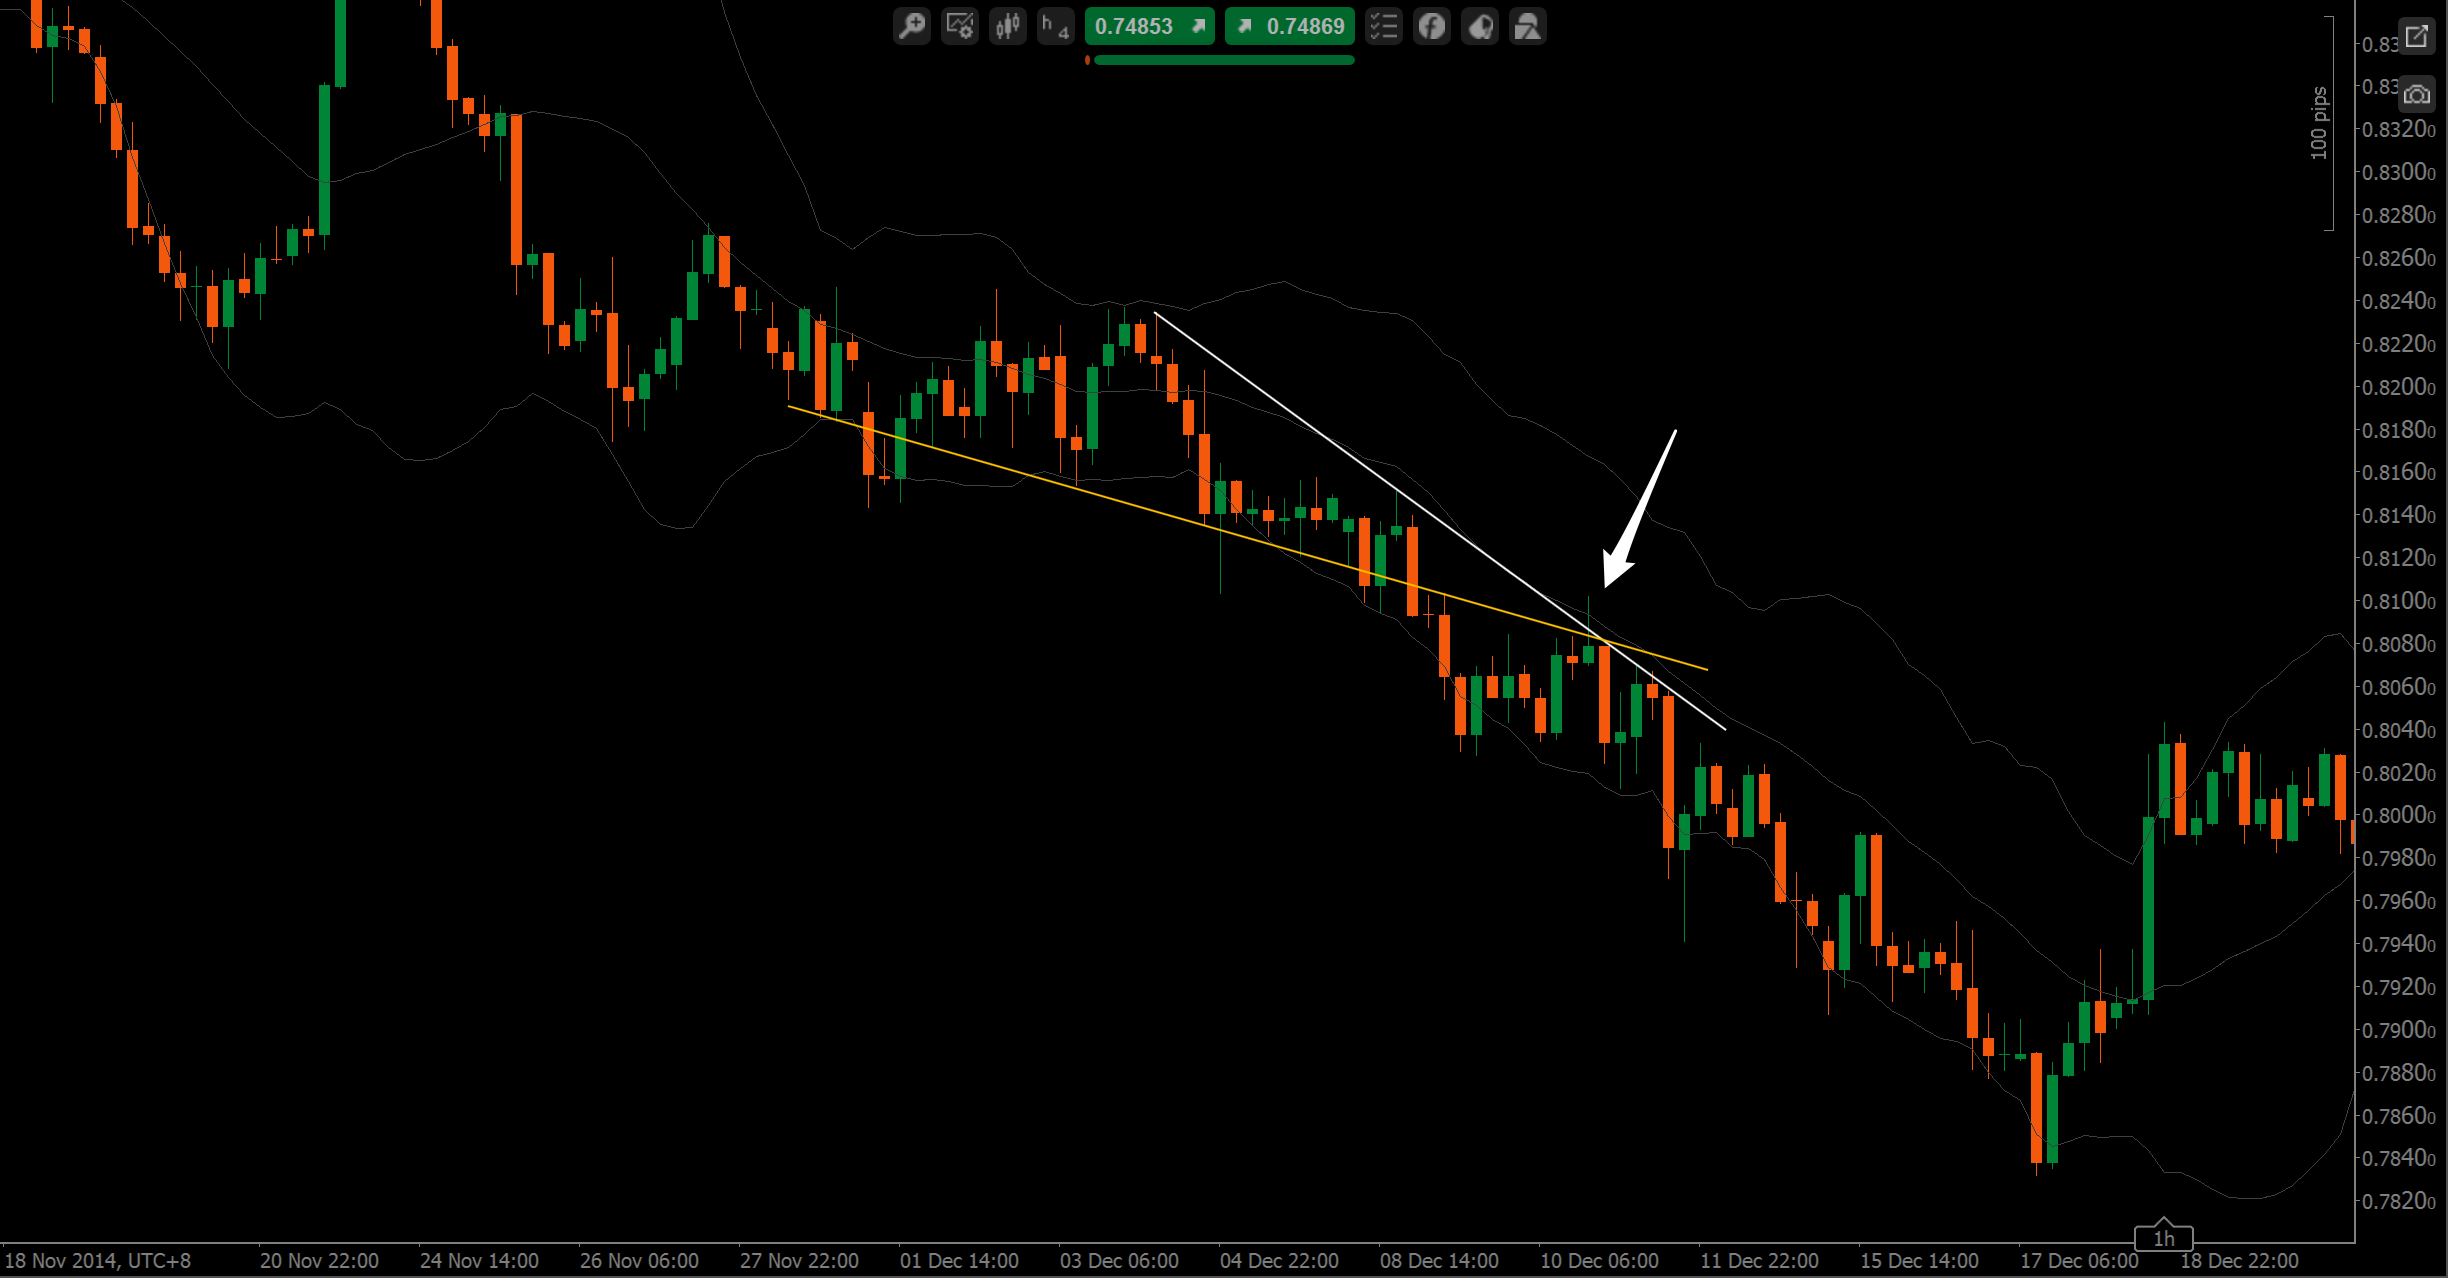
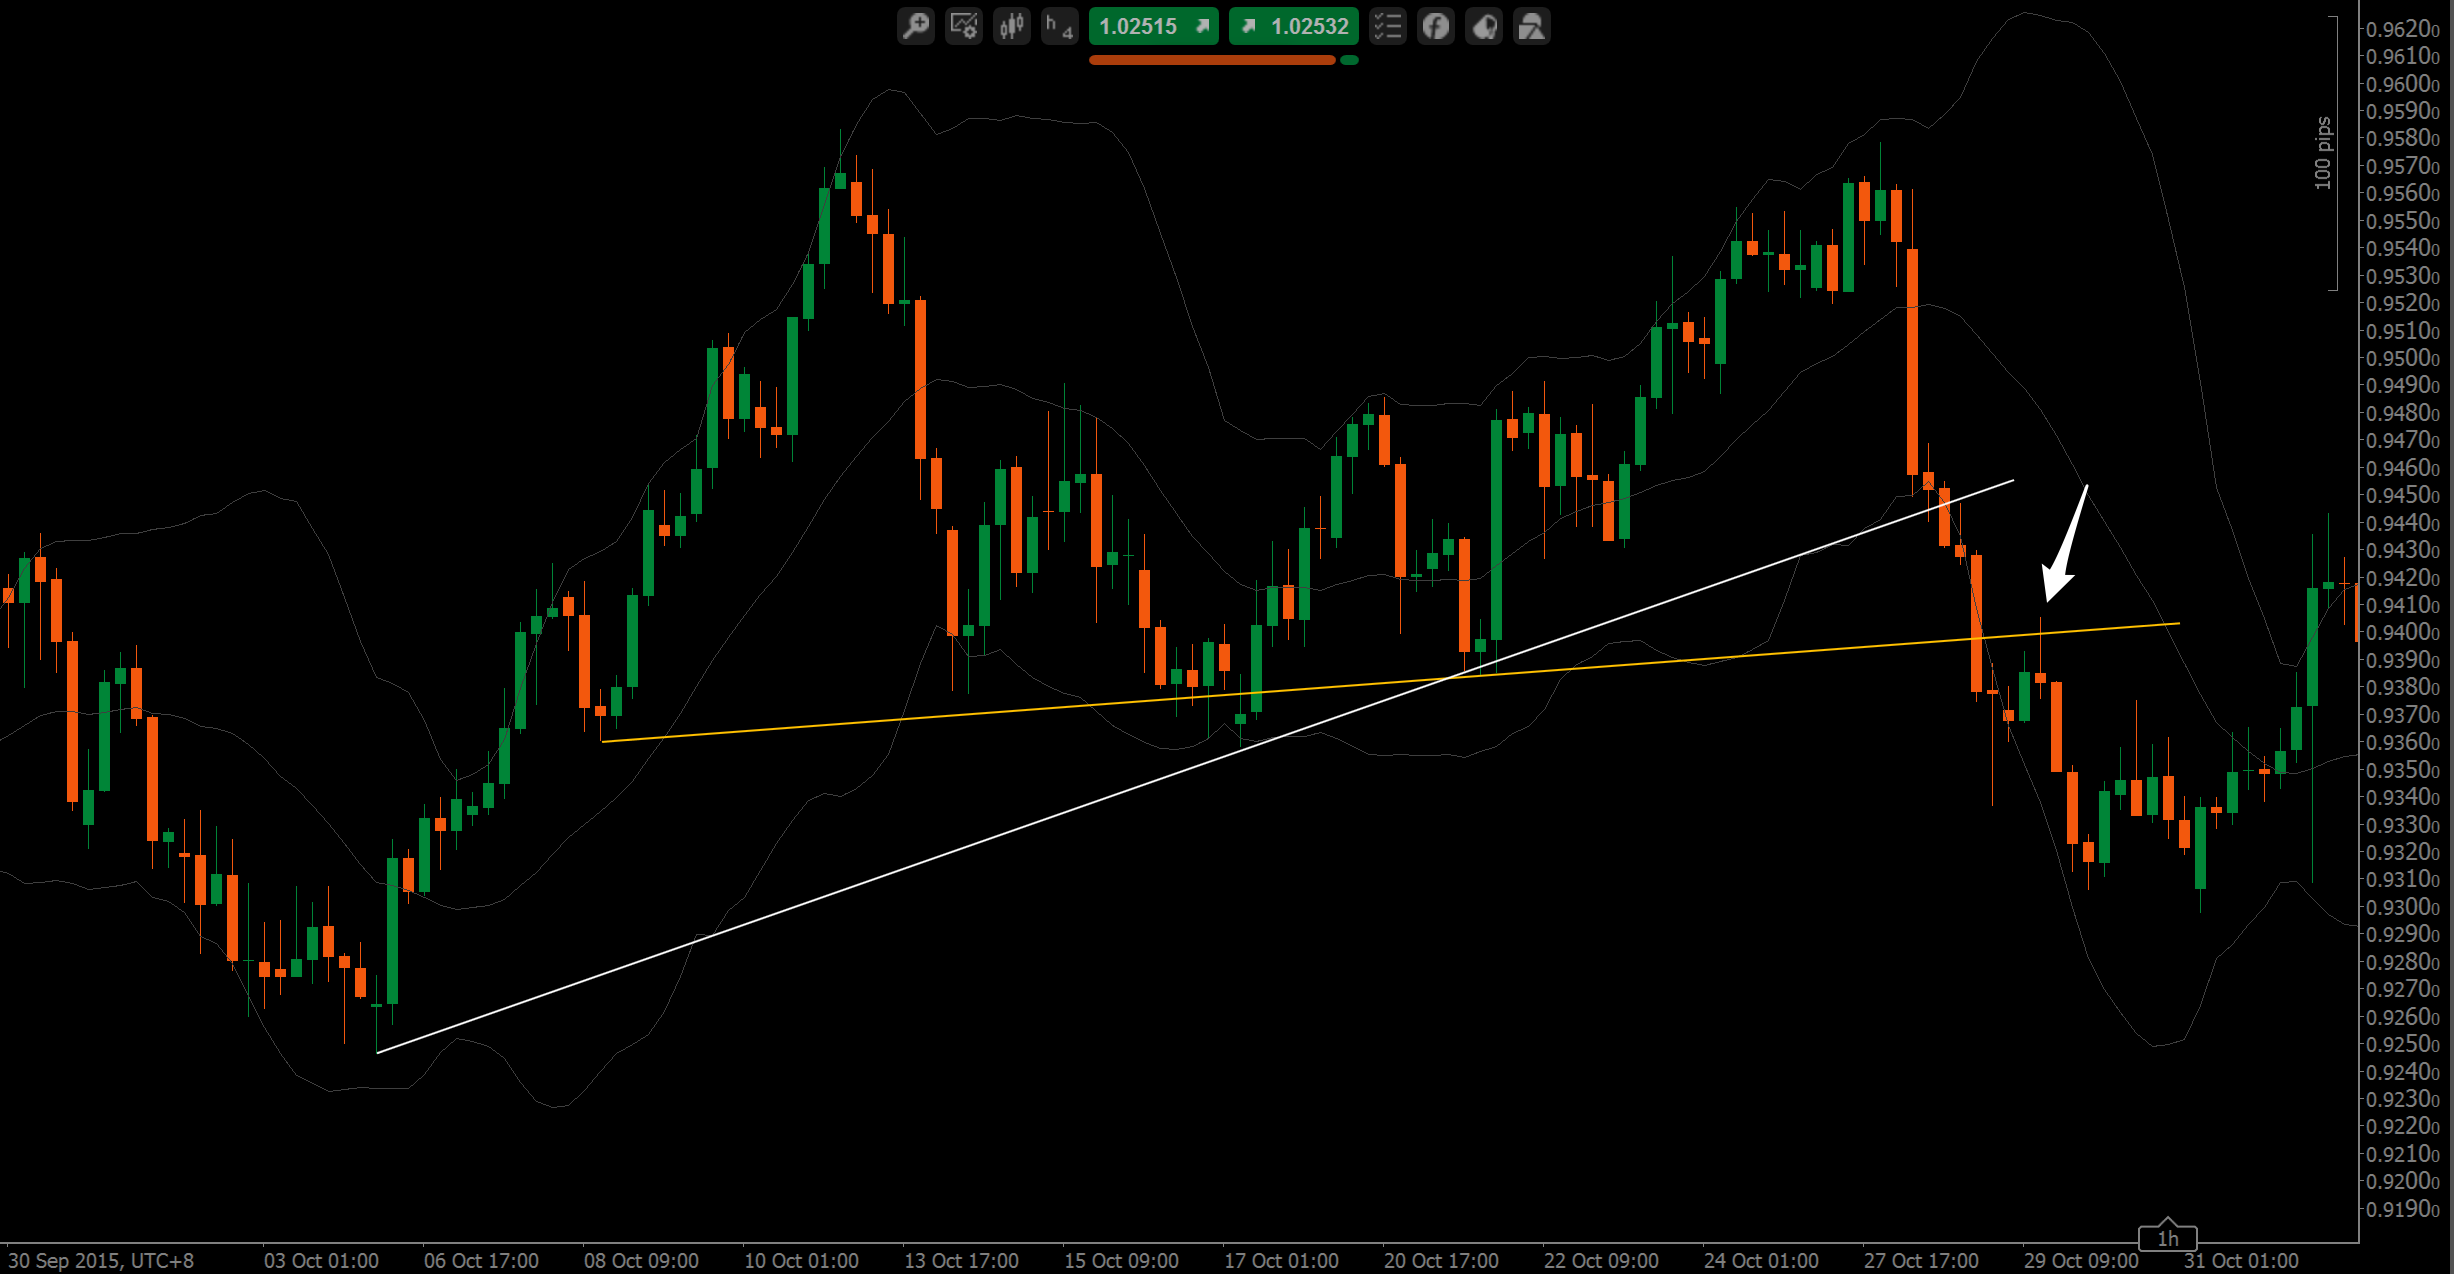
Trendlines are all over our charts. Every pattern, every price movement, they can all be explained by peripheral and inner trendlines. But they can be very, very confusing, as well, for the same reason – as they can literally be drawn everywhere. I suggest you look for these only after you have drawn all the other patterns on your chart, and see whether they add any confluence to your trade. Especially the third tap of a trendline in confluence with a level and a pin bar, for example, can create a lot of magic. Inner trendlines go through price and if they get retested with a pin bar after a breakout or, for example, at the right shoulder of a H&S in the making, then you got yourself once again a triple A trade. Of course, triple taps and channels, triangles, and so on, all rely on trendlines, as well. Here are examples for peripheral and inner trendlines in confluence with our price action triggers (inner TL’s in yellow). Generally, I like to trade retests of trendlines much more than tests, as the retest plus price action signal gives us confirmation that the rest of the world is looking at this trendline, as well.
These are probably the easiest to plot on your chart. While it is still discretionary which swing to use, these simply add confluence / additional conviction to a trade, and I might hold a trade until reaching the 1.27 or 1.68 extension if it bounced from the 50% retracement previously as this is the only retracement I am watching (especially awesome for playing 1-2-3’s).
The Bollinger Bands® for me are a visual help to see where price is right now in relation to its median, how deep pullbacks are, and in which direction the sentiment is heading. I do not use them for entries but rather for getting a quick picture of the overall situation.
Ok, now that you know all the tools I use, let’s take a look at two trade examples where everything comes together.
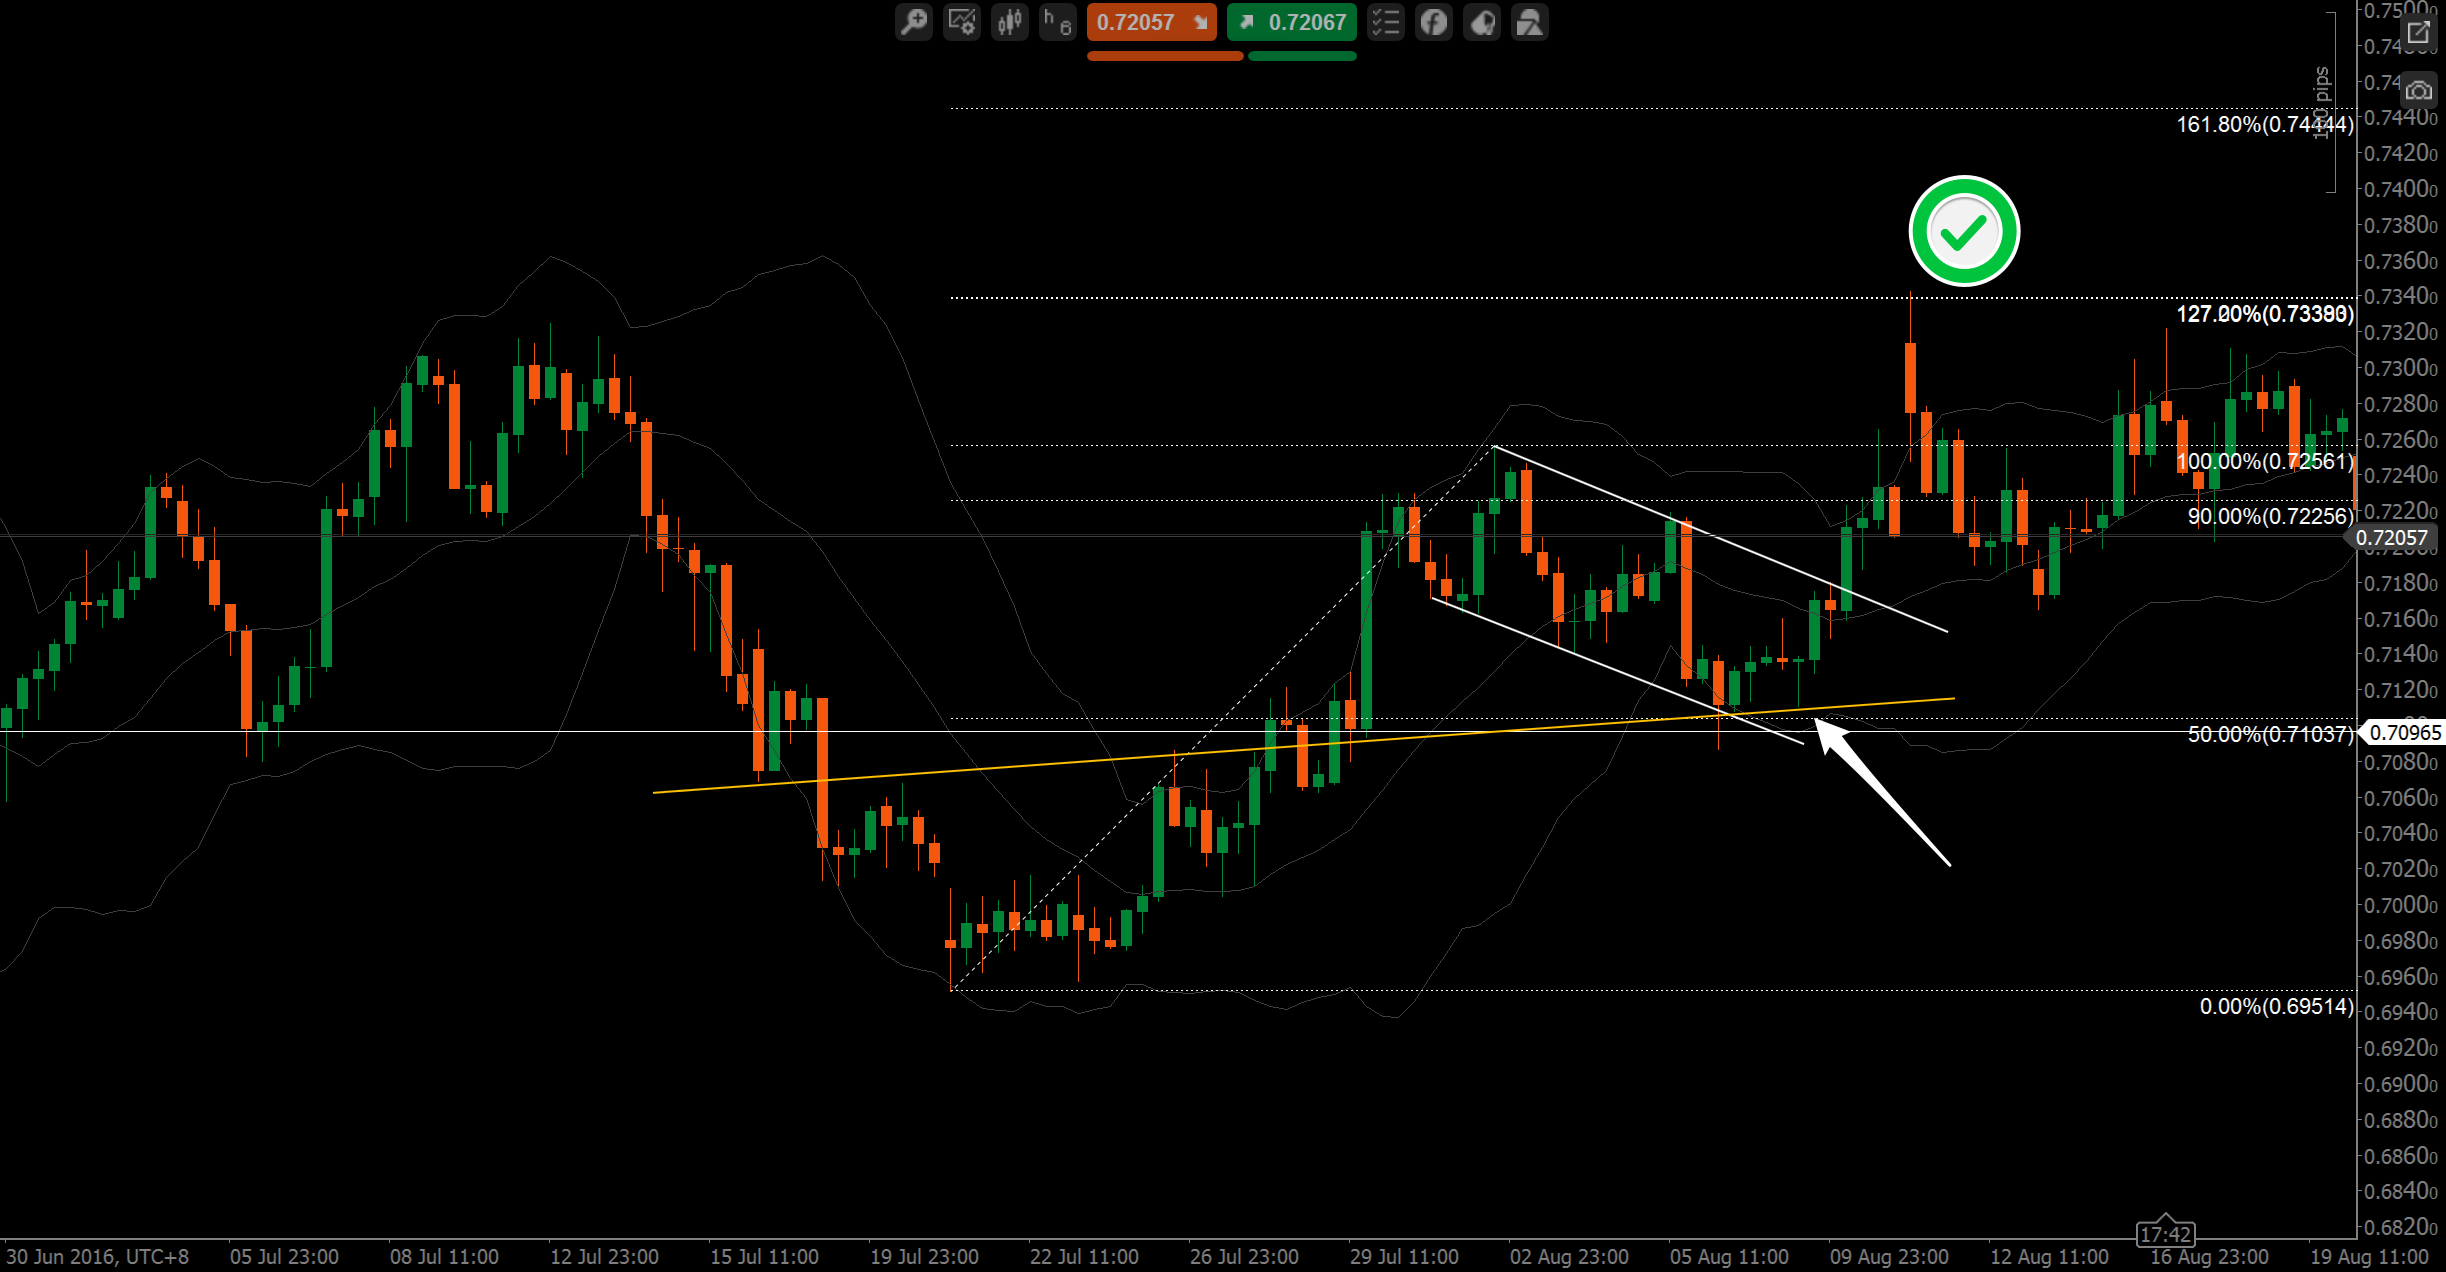
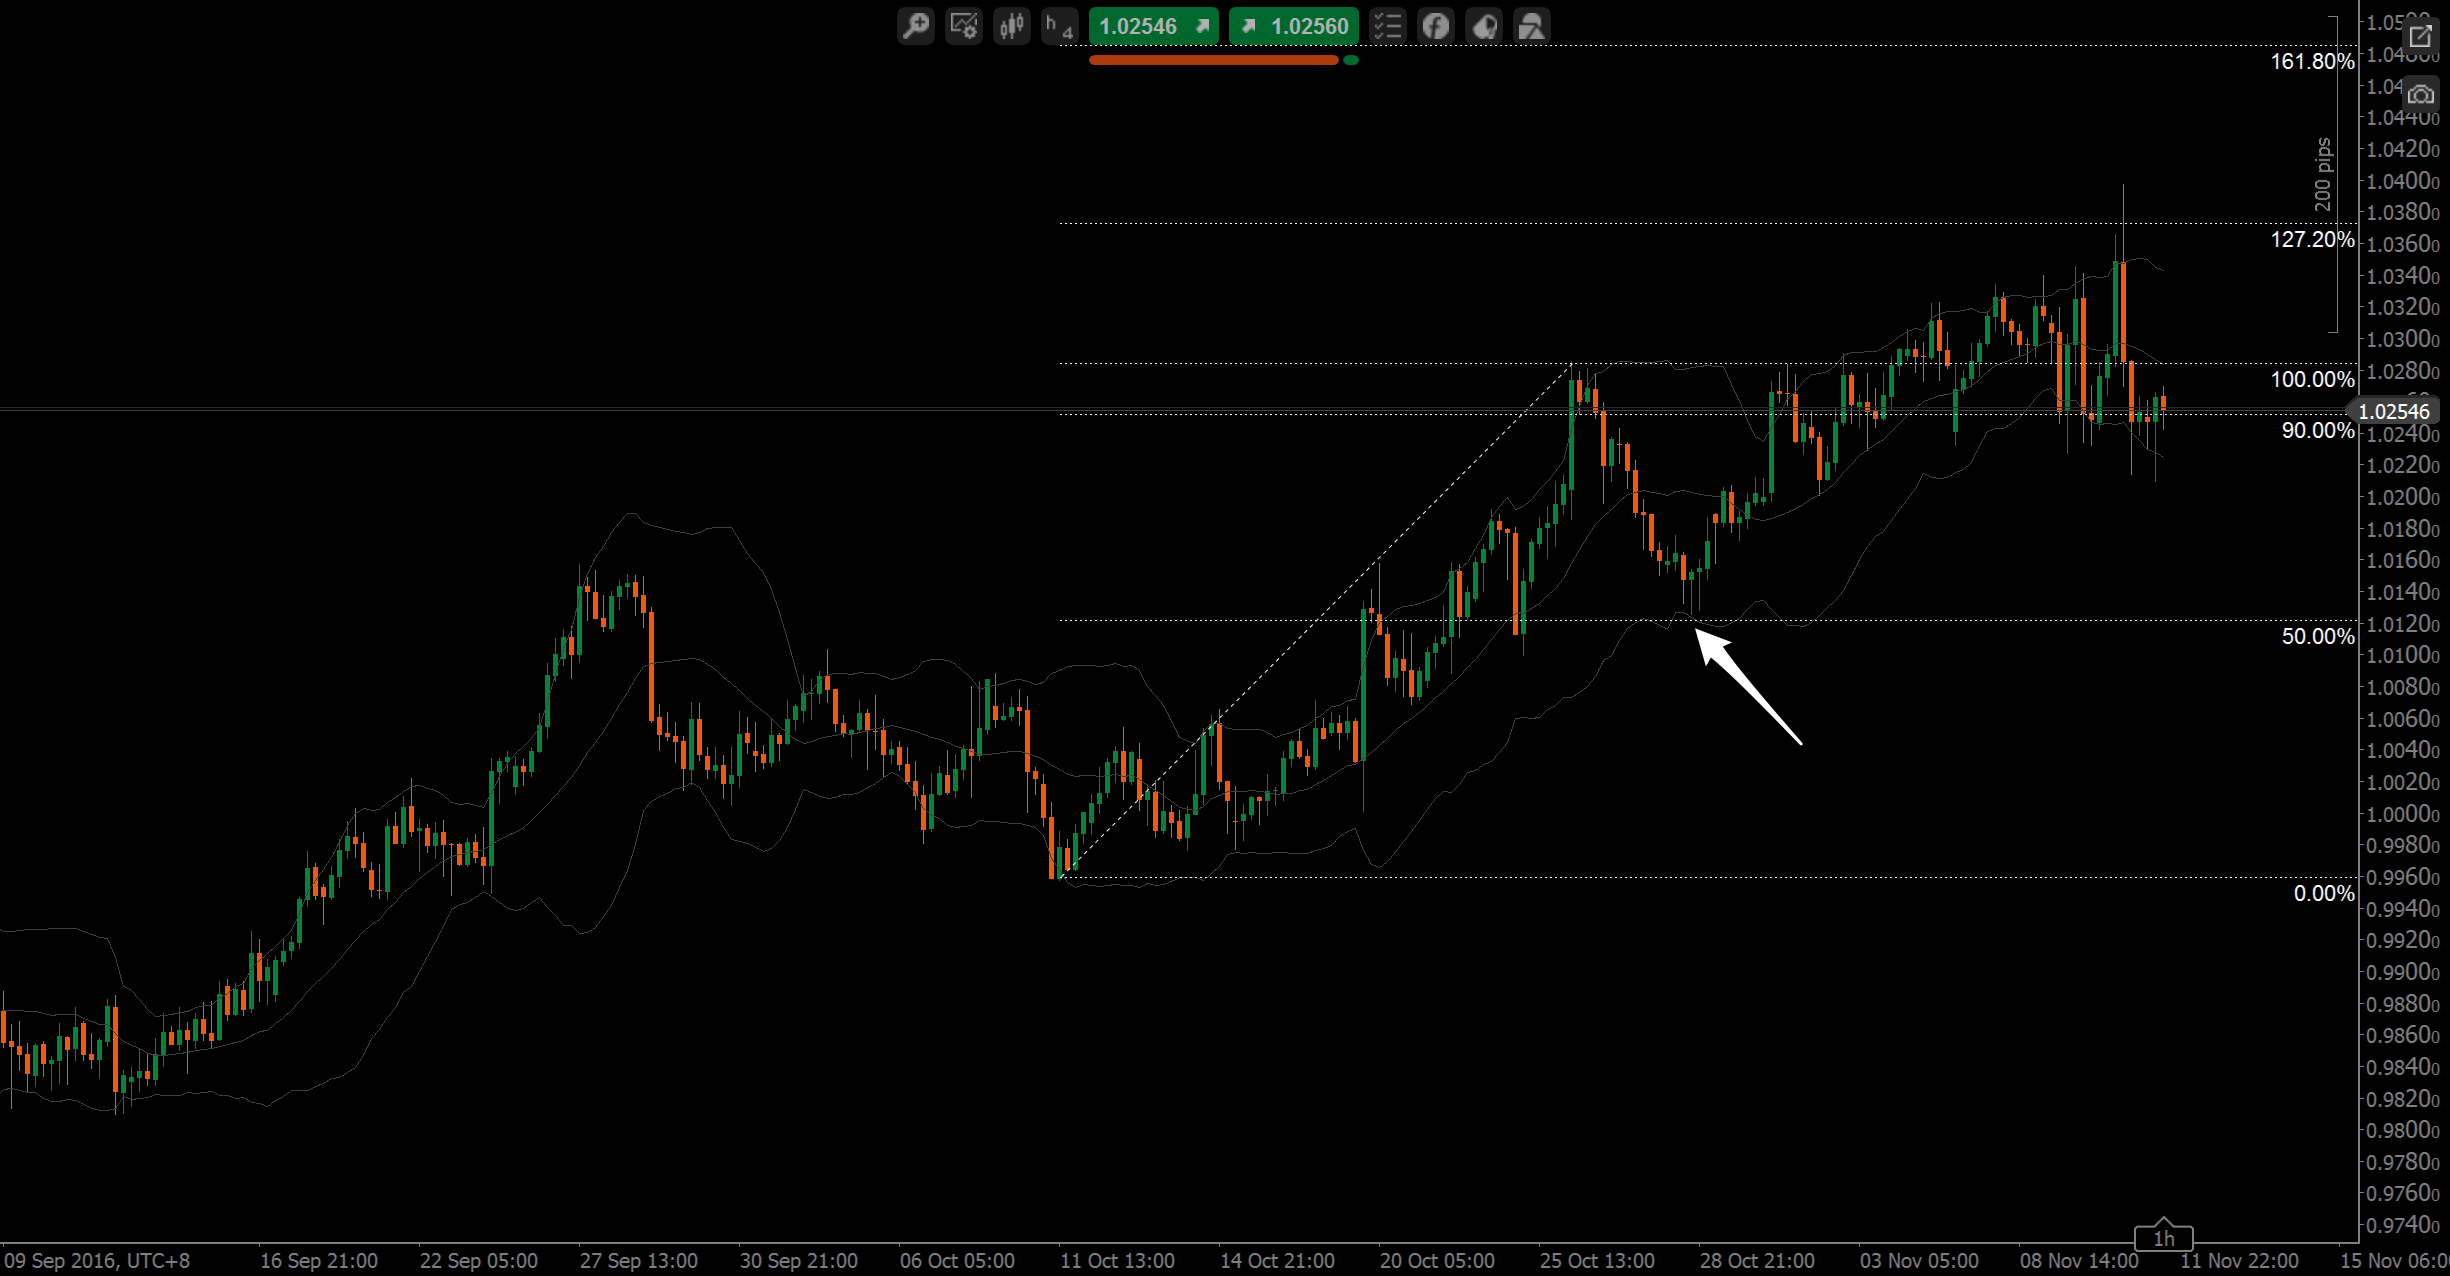
Here we have a H&S, a 50% pullback, a 1-2-3 breakout retest, an inner trendline retest, a triple tap to the downside plus a channel, and once we printed the pin bar which was not perfect but good enough, we got in and waited for the 1.27 extension to get hit. Easy game. You look for the story the market is trying to tell you and if it sounds good, you make your move. That is 5 confluence factors in one trade, or rather 6, if you count the S&R level. Oh, we also had a strong move from that level previously, so we have Supply & Demand – make that 7 confluence factors. Do you need an extra invitation to trade that? Next one.
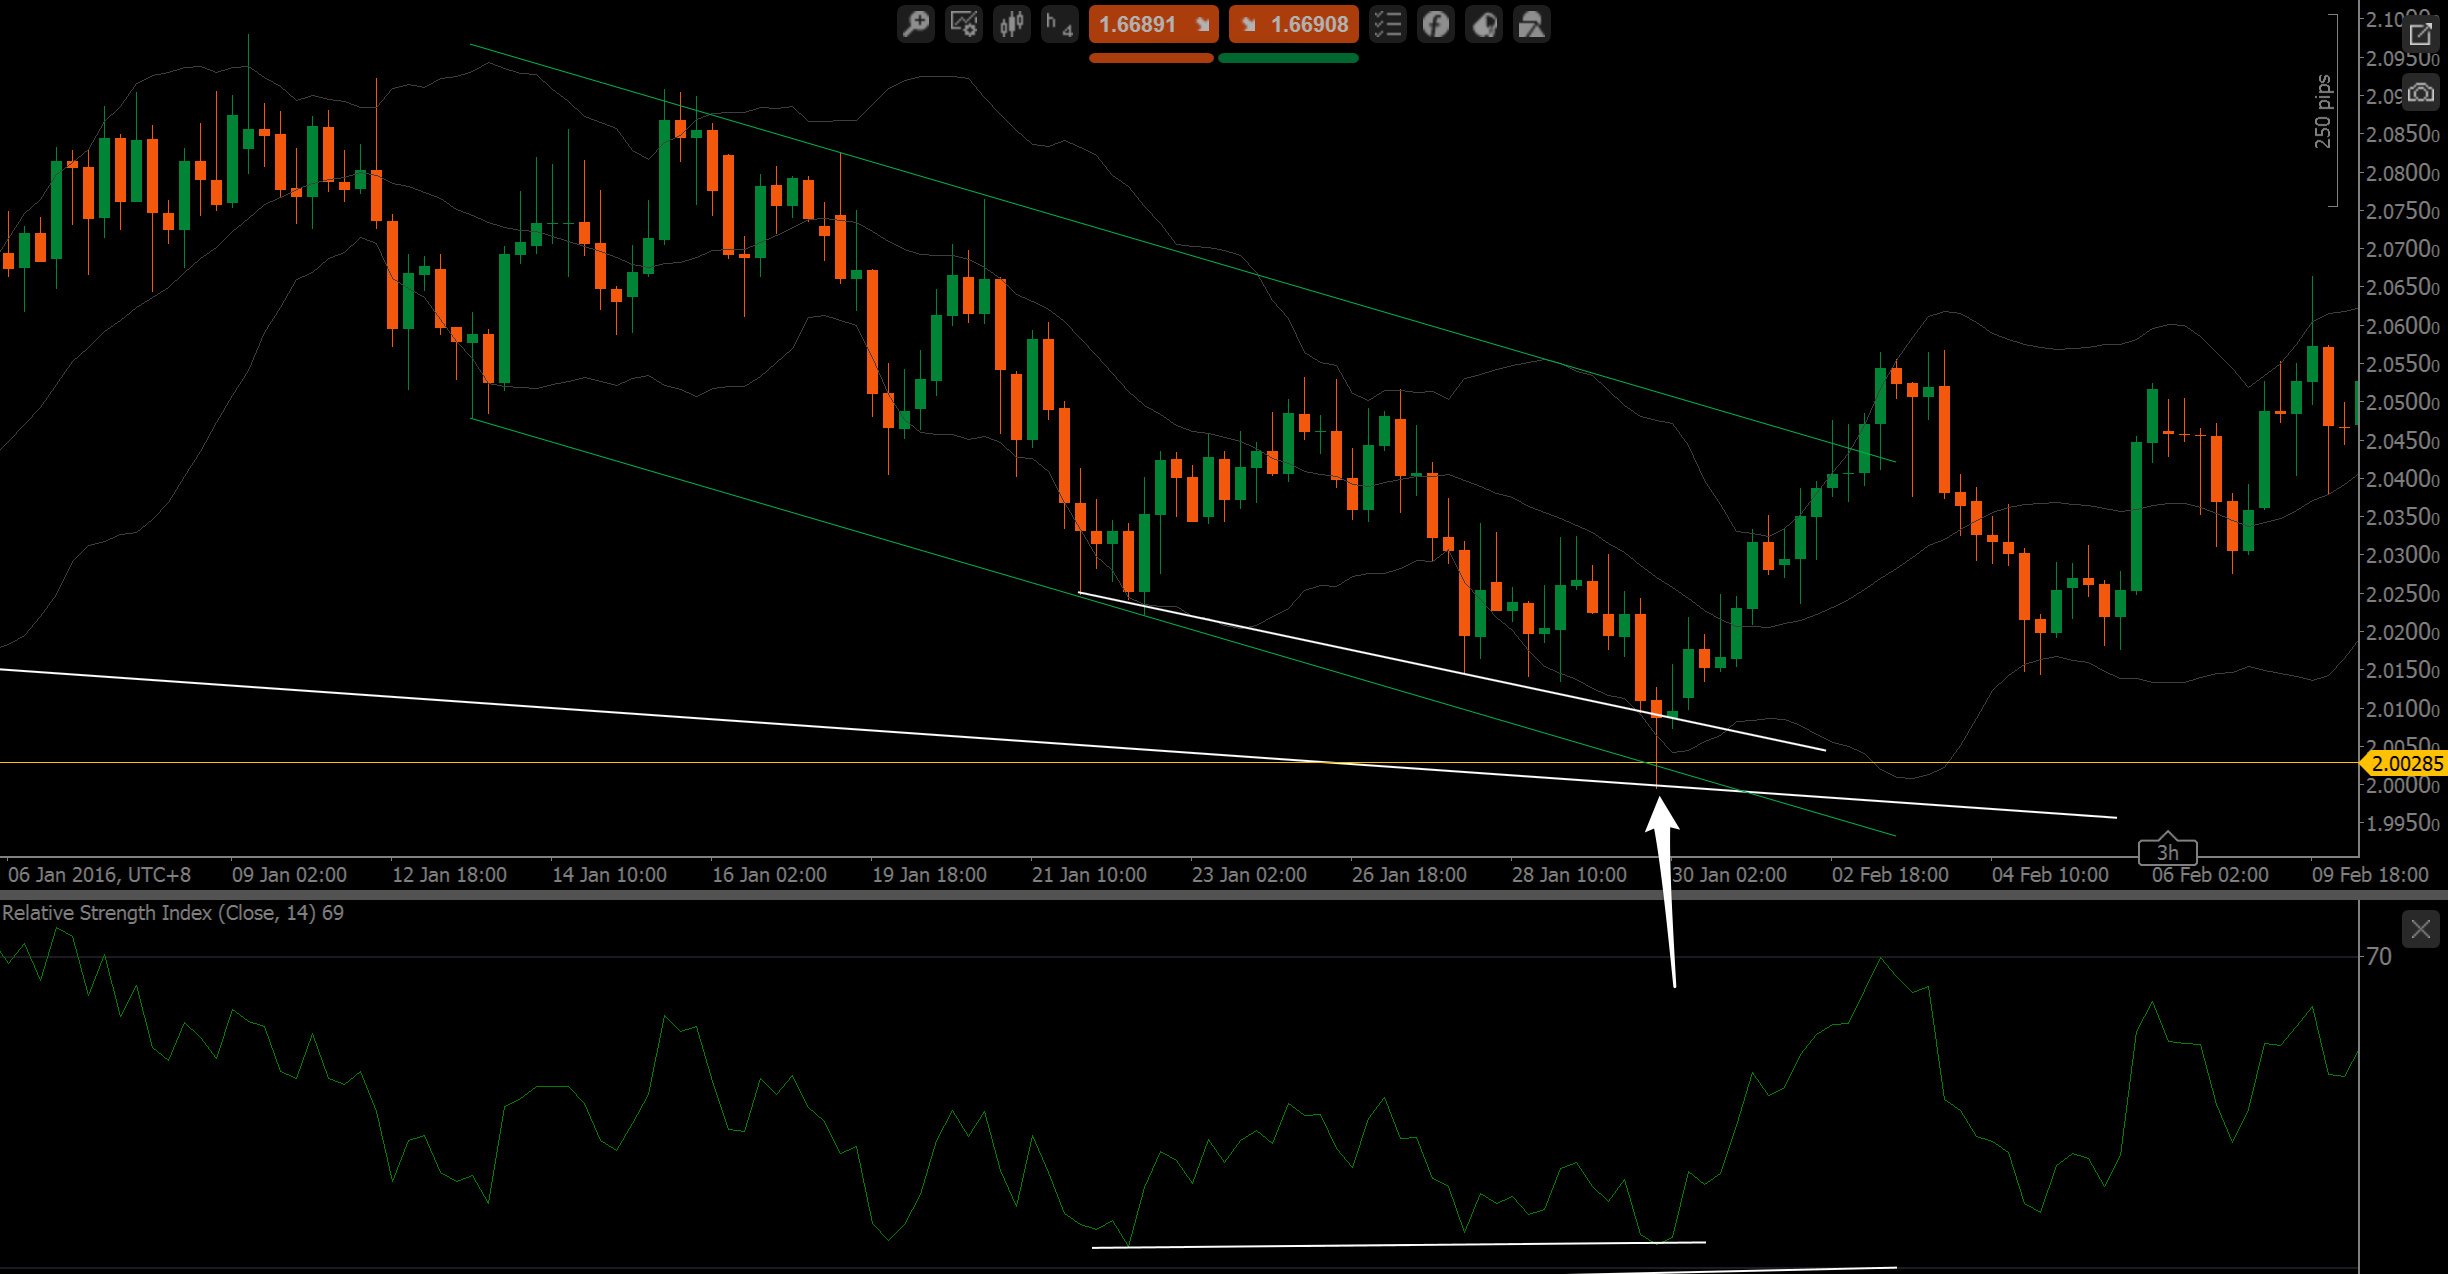
And here the daily picture:
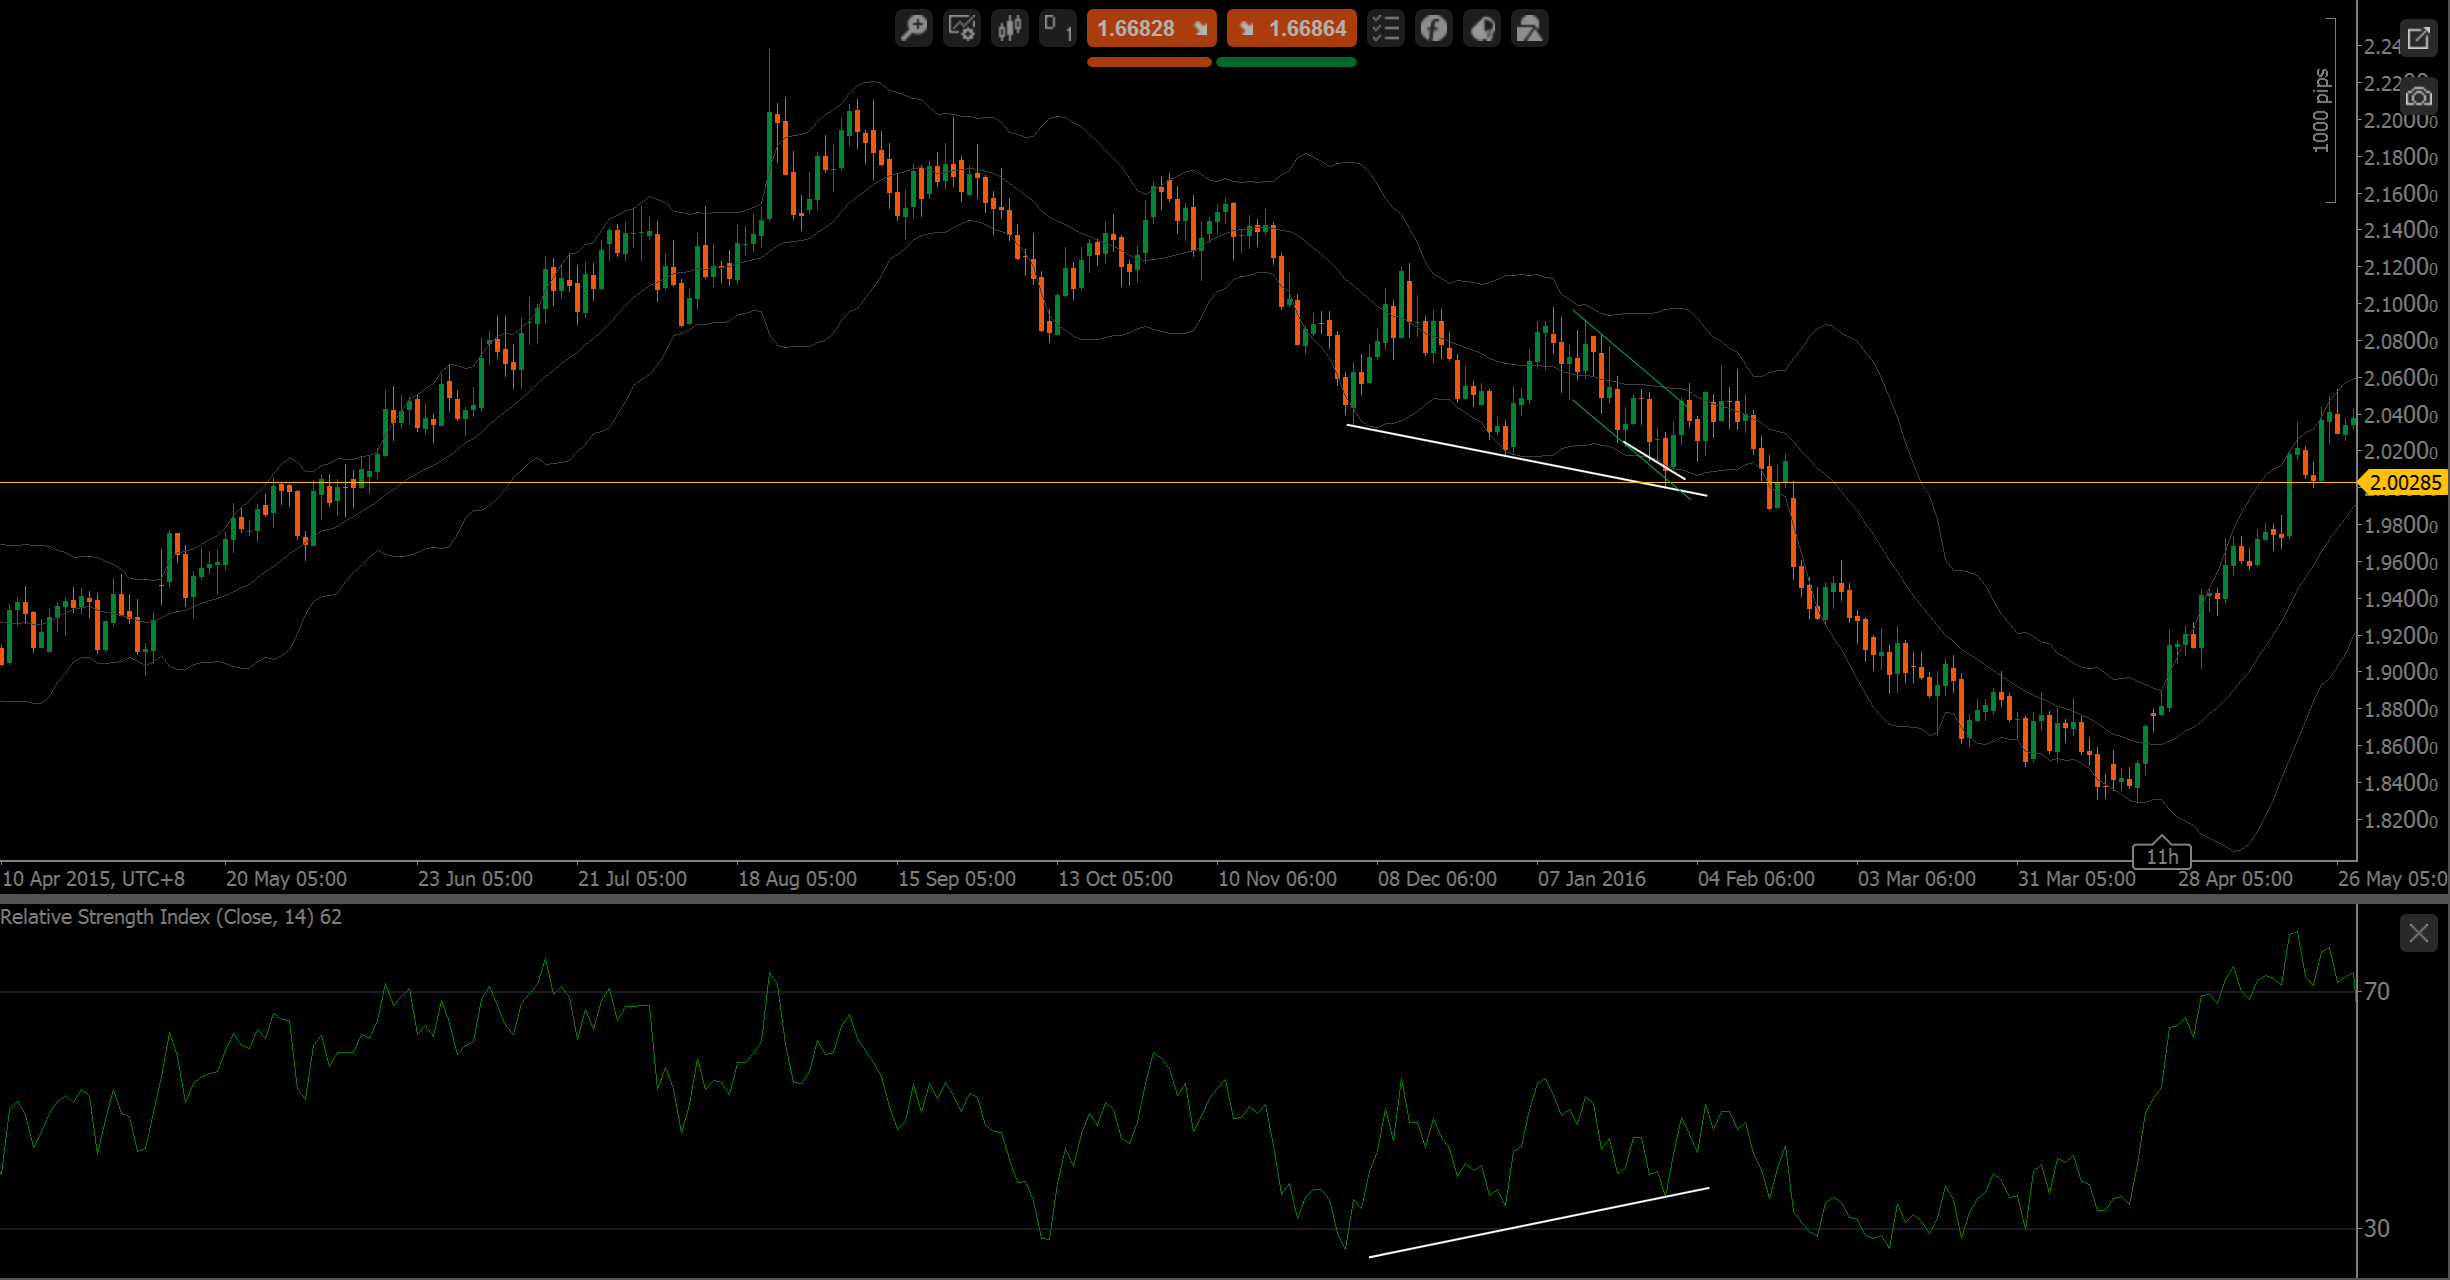
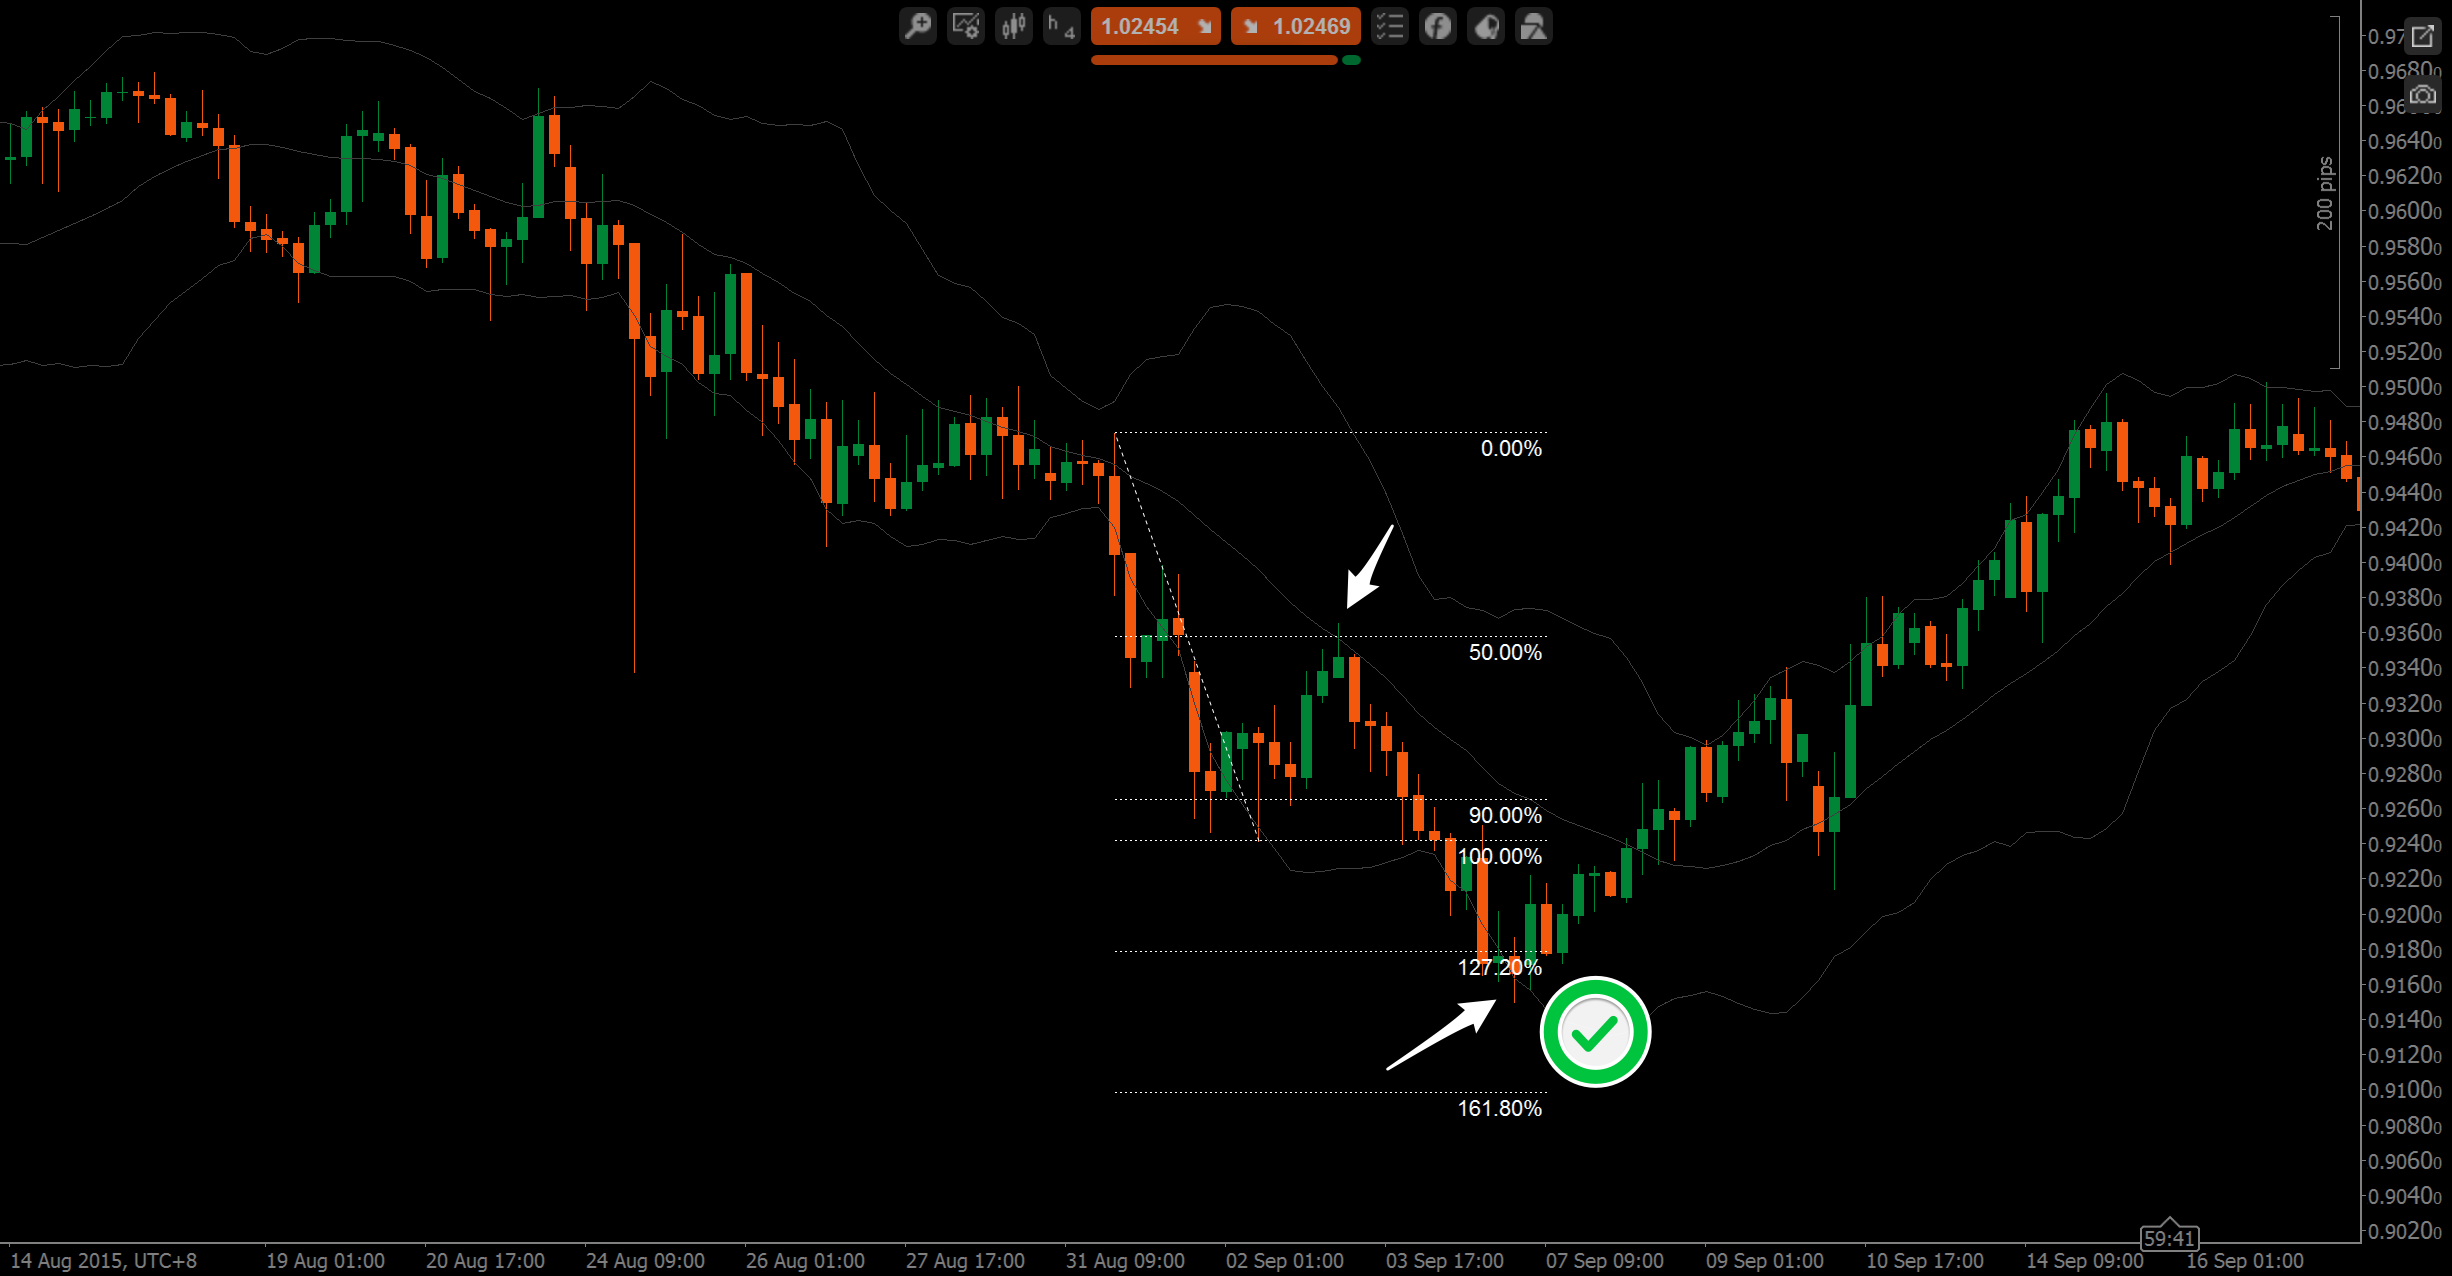
Massive divergence inside a downward channel, then we hit a level, and at the same time touched our trendline for the third time, we then created a very pretty pin bar, and traded back up to the channel top. On the daily time frame, we were also in a downwards channel, so I risked only half my position size on this trade, as I do with almost all counter-trend trades.
That’s it, now you know a lot about my trading plan. Well, at least you know what I look at when I see a potential trade in order to evaluate whether it is worth my time and money. It is up to you to put all of that into a trade plan. Do you check the charts every 4 hours for pin bars or do you set alarms at certain levels? Do you only trade H&S? Only 1-2-3’s? Or do you only trade when you get a certain RRR? Which instruments, which markets? Do you want to add indicators? Or maybe some multi-time frame analysis to increase your odds? Do you want to look for levels on the daily and then go down to the 15 minutes to look for price action? What will your TP’s be for H&S or for 1-2-3’s? All that is entirely up to you.
Just make sure that you truly understand the story the market is trying to tell you. And also, most of these patterns really go hand in hand. If you see a trendline, look for a channel or a triangle. If you see a bucket, look for Supply & Demand. If you see a H&S in the making, look for a 1-2-3 and a Fibonacci retracement, and so on. The more confluence, the better.
What you have here is a toolkit, it’s very similar to that lego box when you were young, and you have to build something out of it. Or keep watching my videos to learn step by step how I do it ;-). Have fun!


external link:


3 min read
“95% of all traders fail” is the most commonly used trading related statistic around the internet. But no research paper exists that proves this...

3 min read
Trendlines can be great trading tools if used correctly and in this post, I am going to share three powerful trendline strategies with you.

3 min read
Choosing the right trading journal is essential for traders wanting to analyze performance, refine strategies, and improve consistency. In this...