Supply and Demand Trading in 2026
We have been trading supply and demand strategies for over ten years, and they have stood the test of time remarkably well. Supply and demand is...
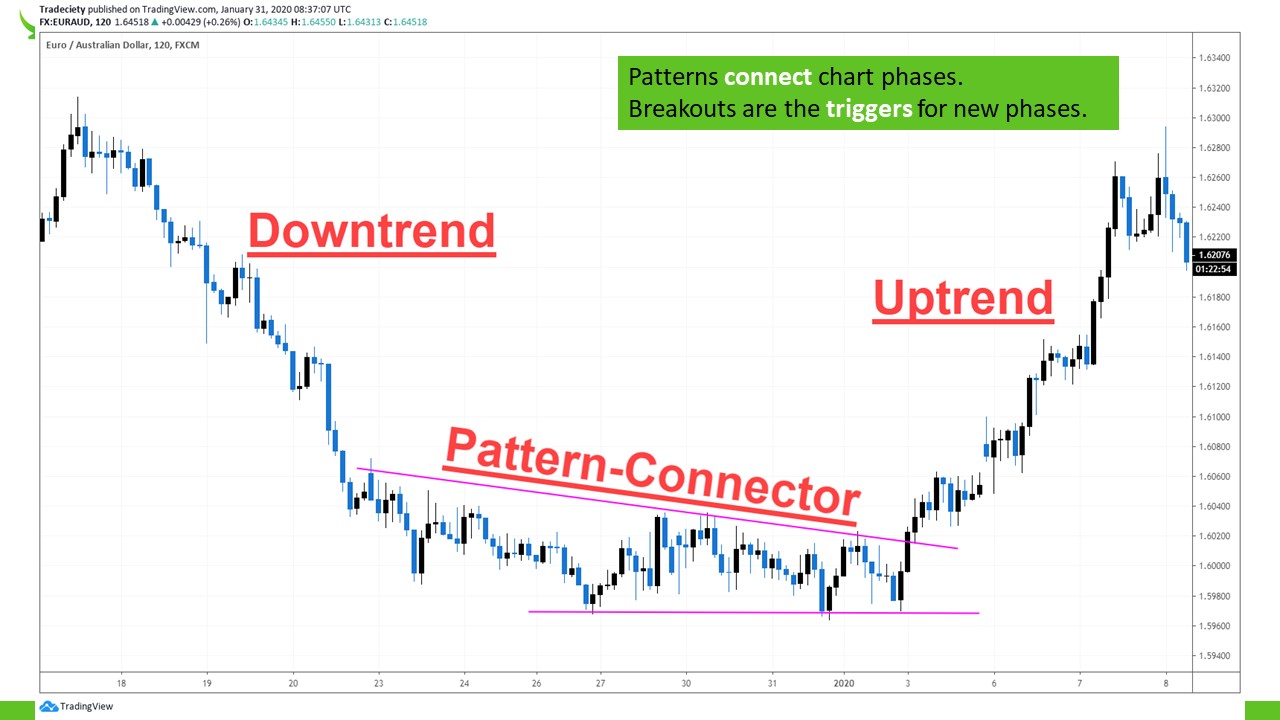
I’m a huge breakout fan and when I explain breakouts to my students and to other traders, many people will realize that breakouts are really one of the most important things and concepts in trading and a trader that can master breakouts, we’ll be able to master all trading situations, all price situations and all market phases because breakouts are at the origin of new trends. Breakout, breakouts are the triggers of new trends, breakouts, are the connectors between different trends. And that’s really, really important to understand, between a downtrend as we’ve seen here and an uptrend, usually you will see a range market and the range markets can have many different forms as we will see during the phase of this video. And a breakout is then the trigger point of the new trending phase. So the pattern is connecting the downtrend to the uptrend. And at the core of the pattern, when the pattern is triggered, it is usually with a breakout.
(01:29):
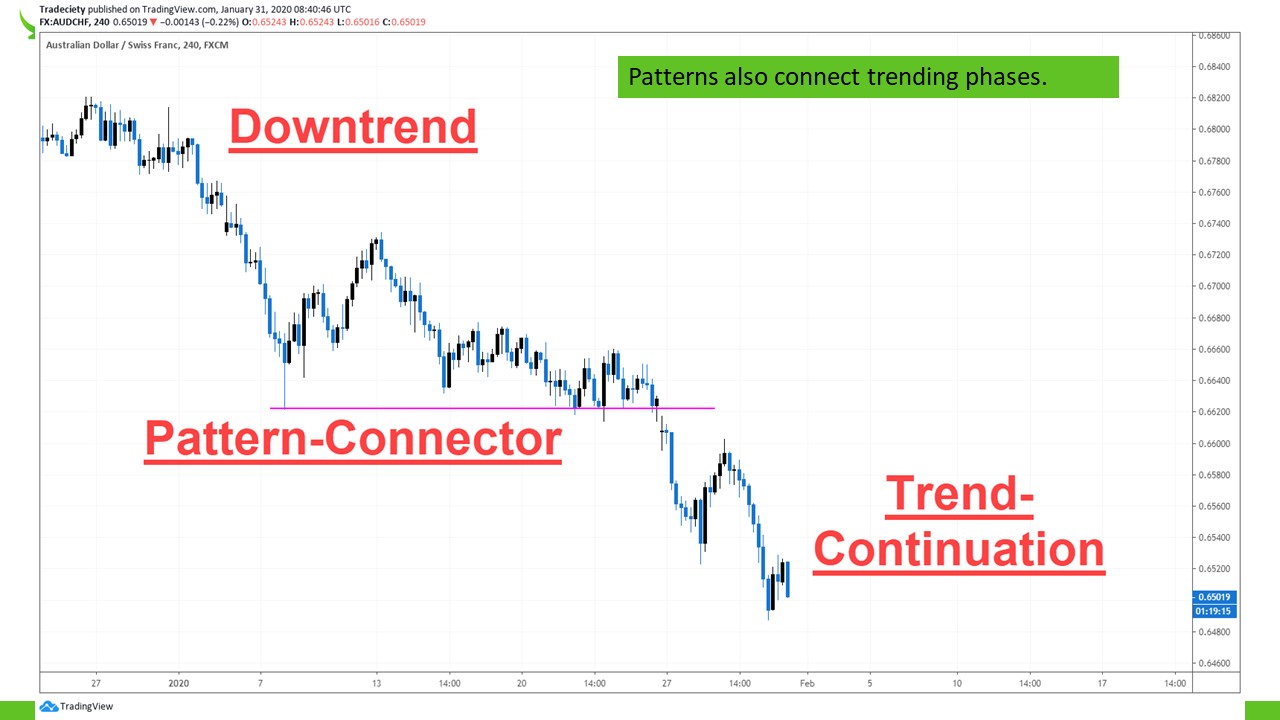
And also, this is true for trend continuation. So in an overall downtrend you have your initial trending leg, then you have your um, consolidation where the market is just going sideways, you have the breakout out of the pattern and then this leads to a trend continuation. So breakouts are really one of the most important concepts and breakouts are at the core of many trading strategies. So whether you trade trend continuation, whether you trade reversals, whether you trade any other trading style, very, very often a breakout approach is at the core of this trading. And we will see and we will go through many different examples and scenarios in this video. And if you do like those types of videos, please make sure to subscribe to my channel, make sure to leave a thumbs up and also let me know in the comments below what you find most interesting. When it comes to patterns or when it comes to breakout trading.
(02:27):
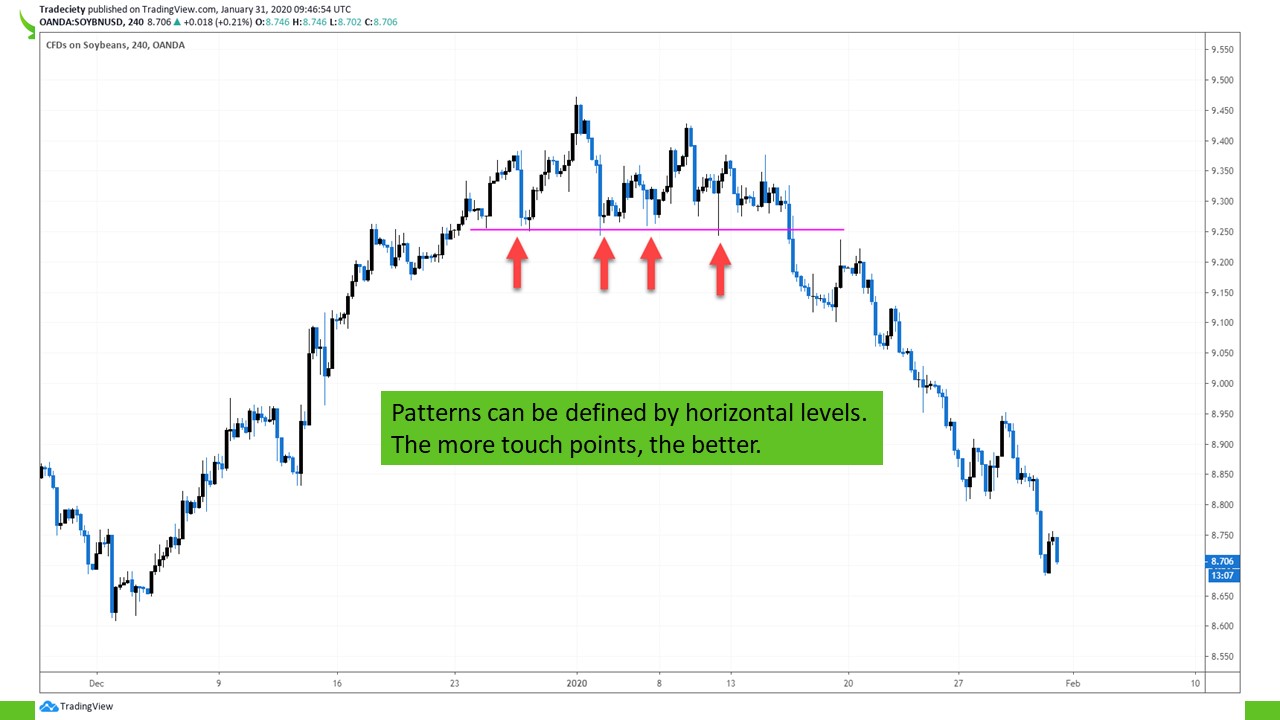
we need to look for patterns because a breakout out of a pattern is the most important factor and a breakout out of a verified and the very strong pattern will often provide better trading opportunities. And patterns, as we will see in this video come in many different shapes and forms and sizes and a pattern in the most basic sense is defined by a horizontal level of support or resistance. In this example you can see this a, a market was in an uptrend. Then the market moved sideways here in the range market with a very, very well defined horizontal pattern and with a very horizontal support level, you can see the support level has one, two, three, four, five touch points. The more touch points, the better such a level is, the stronger such a pattern is, and the more meaningful a breakout out of the pattern is.
(03:22):
And you can see after the uptrend, the market consolidated here in the range with this pattern and once the breakout out of the pattern was triggered, a new downtrend then was started. So again, the breakout is really the origin of a new trend and the pattern with the breakout is the connector between two trading phases. This is really, really an important concept. Of course, as I said, patterns and breakouts can also be connectors between trend continuation phases. So after this downtrend, the market moved sideways, a very well defined pattern with at least one, two or three touch points at the bottom and a double top at the top side. And in this case you have your breakout here to break out to the downside, um, confirms the trend continuation. You can see a pullback after this breakout with a retest and then the trend was continued.
(04:15):
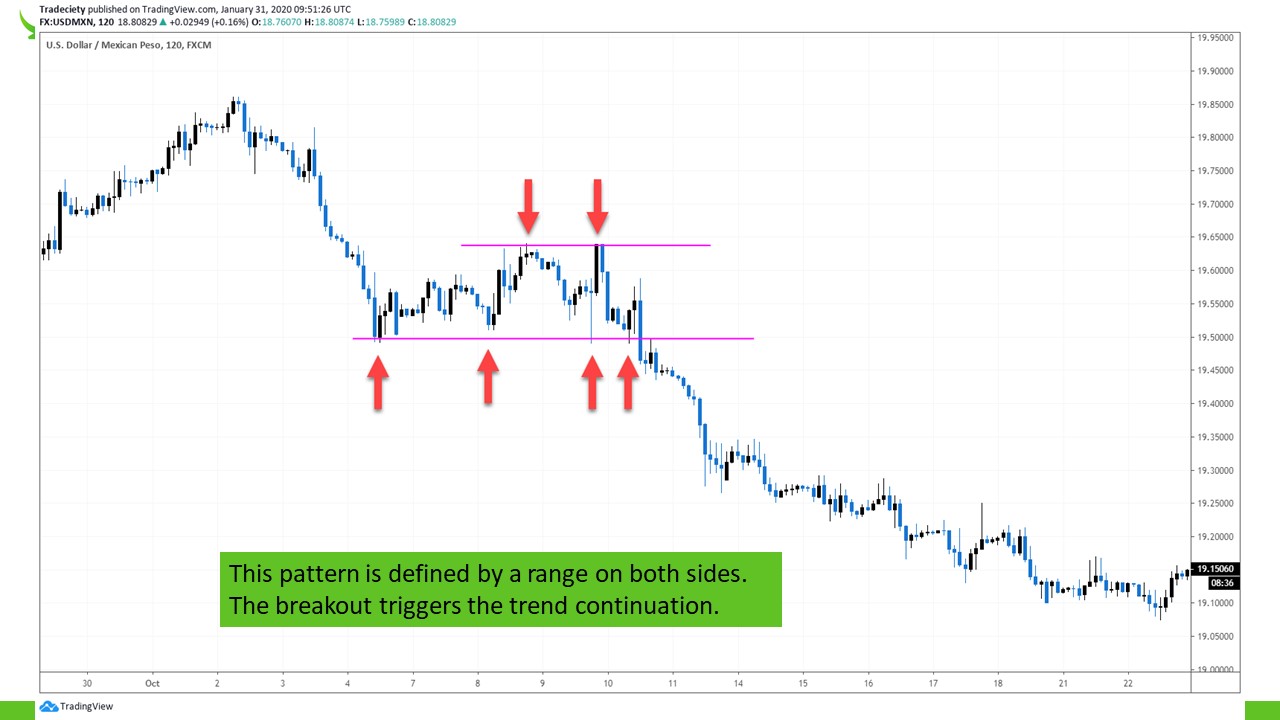
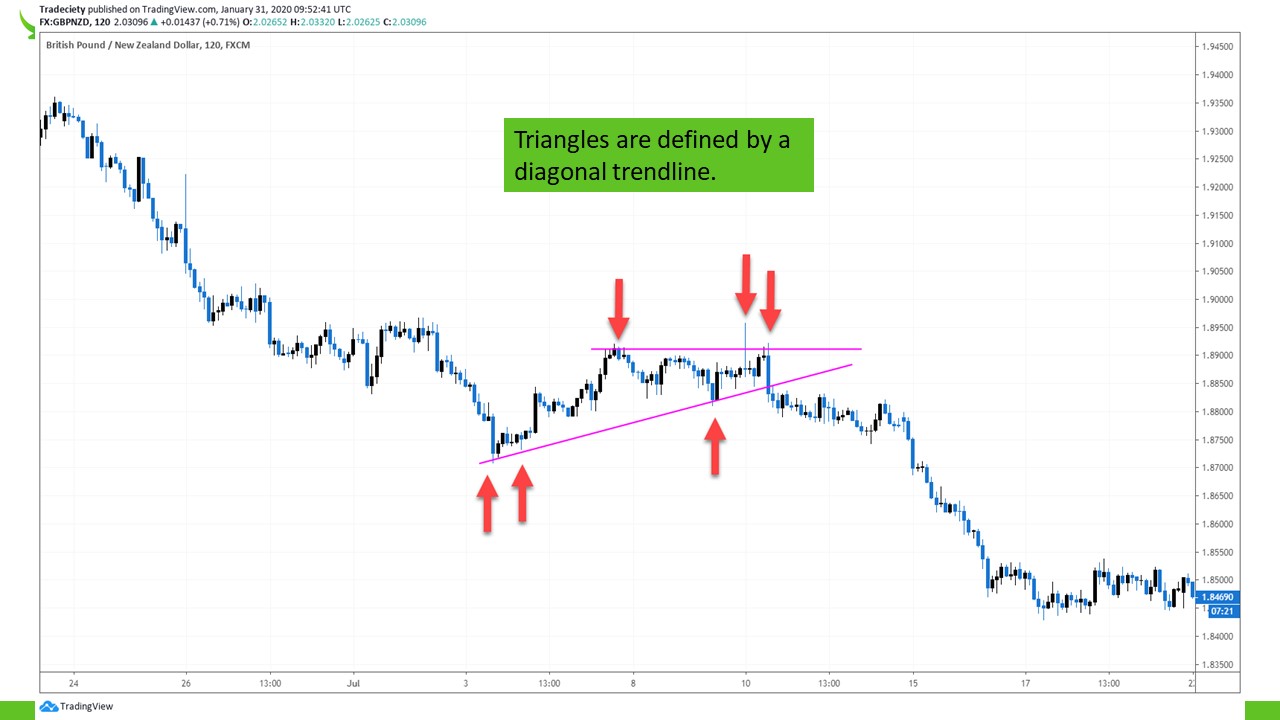
Again, we really need to wait for the market. First of all, we need to wait for a pattern to be established and to be verified, which happens with multiple touch points. And then you need to have your breakout. It can go either way. The price can go either way on the breakout, it can break out to the upside, it can break out to the downside. So you really want to make sure that you are looking at a confirmed breakout and you don’t trade as long as the market is within the range, that’s really, really important. As I said, patterns can come in many different shapes and forms and not only horizontal levels are going to help us to define patterns but also um, diagonal trend lines will help us. In this example, the market was in a downtrend, then the downtrend consolidated here for quite a while and here then we are what the price established, a very well defined triangle pattern with a trend line
(05:07):
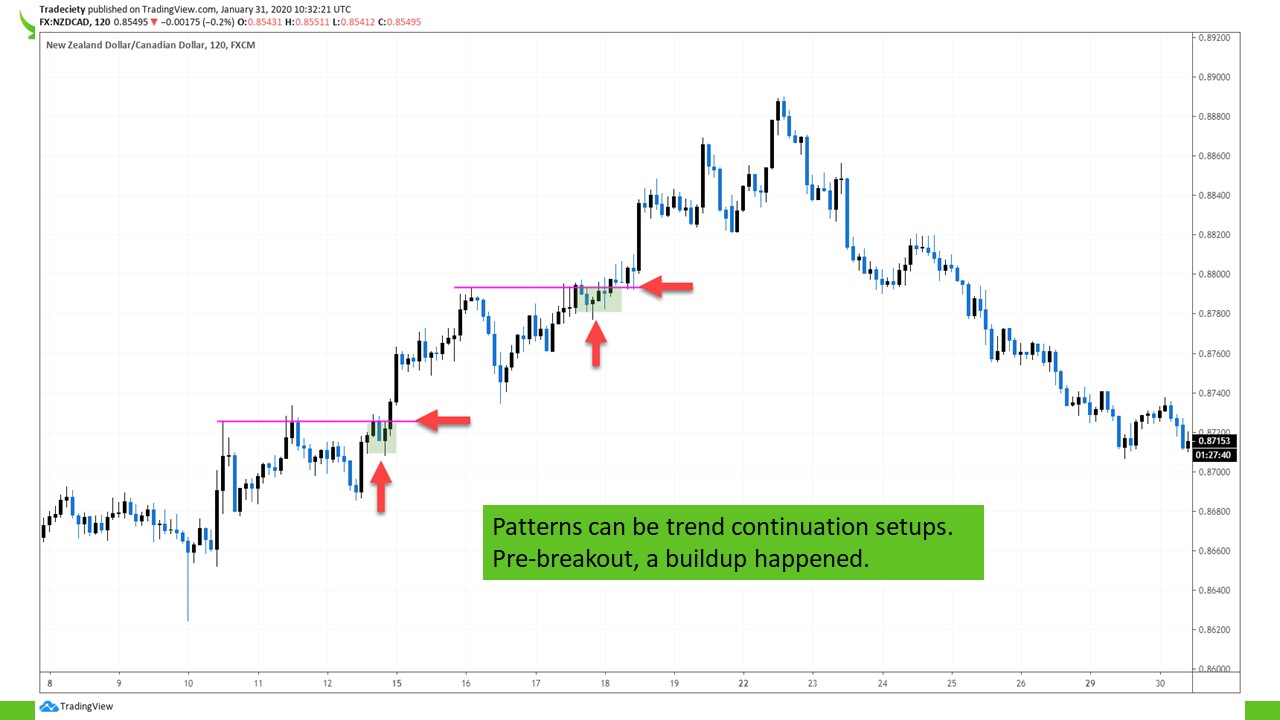
at the bottom. You’ll see we have one, two, three, maybe three and a half touch points and we have a resistance level with one, two or three touch points at the top. This again could have gone either way. A breakout to the upside may have led to a trend continuation or to a trend reversal to the upside after the downtrend, but in this case the market broke out to the downside. It triggered the pattern, the breakout was initiated and this then signaled the continuation of the downtrend. Patterns can be trend continuations as I said a few times now and there is also a very, very powerful concept which is the breakout buildup or pre breakout buildup and I’ve talked about this in a few videos already on YouTube and once you are able to identify a range market, here you can see we have one, two, three touch points and before the touch or before the breakout this happened.
(06:00):
This is the buildup after or when we just look at the lows. Look at the low here. Look at the low here and then look at this low here. Every time the market moved higher and closer into the area here and before the successful breakout, the market was almost not able to pull away at all from the level. So the price was really sticking to the level and the buyers came in early and earlier. The sellers are not able to bring the price down and this already shows you a lot of bullish pressure and then the successful breakout which led to the next trend wave. The trend wave ended, the price formed another consolidation with lower, with higher lows. Here we have our breakout buildup, which shows that the market was really sticking to the level. The bears are not able to bring the price down, there’s no attempt from the sellers anymore.
(06:51):
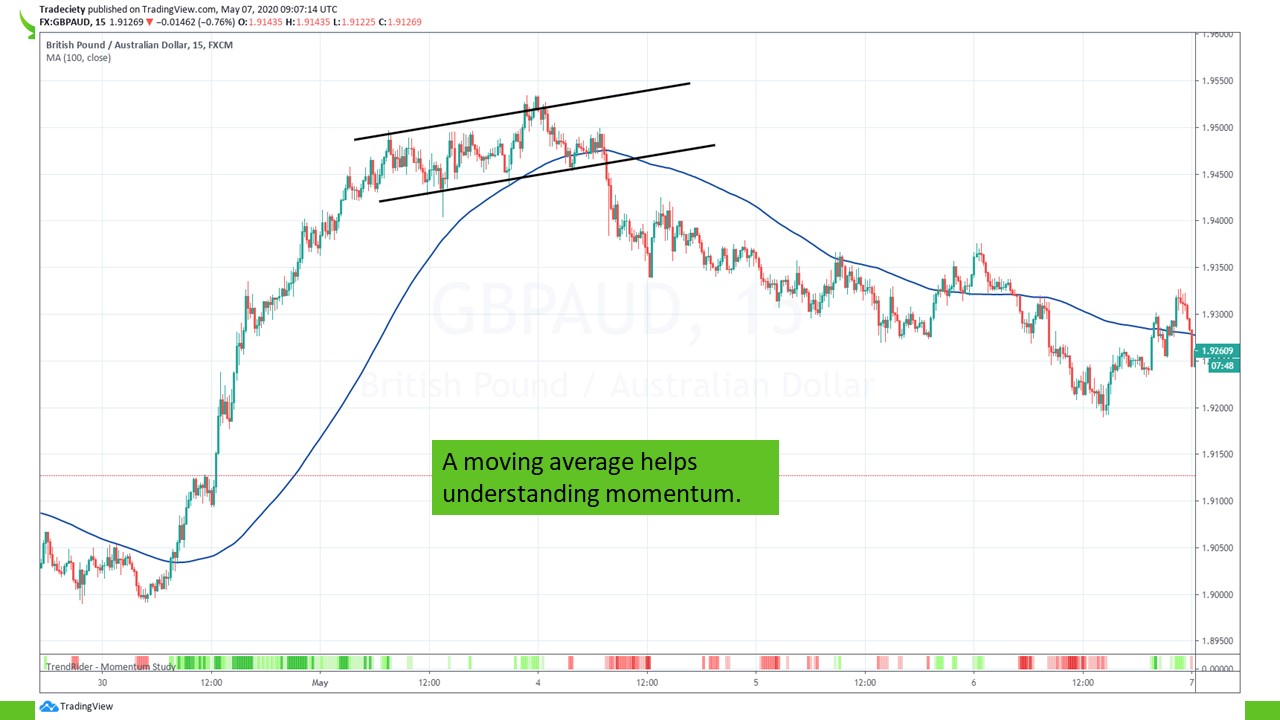
The buyers pushed the price into the level earlier and earlier, we have our successful breakout and then the trend continuation here at the top. So the breakout buildup, when you see that the market is not able to pull away from a level can be a very, very powerful concept. We can use moving averages to have us understand, first of all, trending markets and then also help us understand momentum. The best reversal opportunities exist when the market is half, is trading with a long trend. Then the trend is dying down and then this trend is reversing. This is especially true in the Forex market, which is generally considered a mean-reverting market, which means that after a long trend, very often you will see a reversion back to the mean and this is exactly the same, the principle that we are going to use in this example.
(07:41):
So after a long trend you can see the moving average, a hundred period is moving up in a very, very long time. And then here at the top, you can see we are able to draw a trend line or to find a pattern and we have here a fake breakout out of this channel. The market tried to break out. It didn’t succeed, it could trade back into the pattern, into the trend line here, and then it was not able to come close to the previous high anymore. So a really bearish signal failed breakout significantly lower high. Then the breakout out of the pattern. The price is now trading below the moving average and you can see the downtrend here really accelerated. And this is a trade that I traded with my students in the master class. This is at the premise of one of the setups that we teach and trade together in the master class,
(08:27):
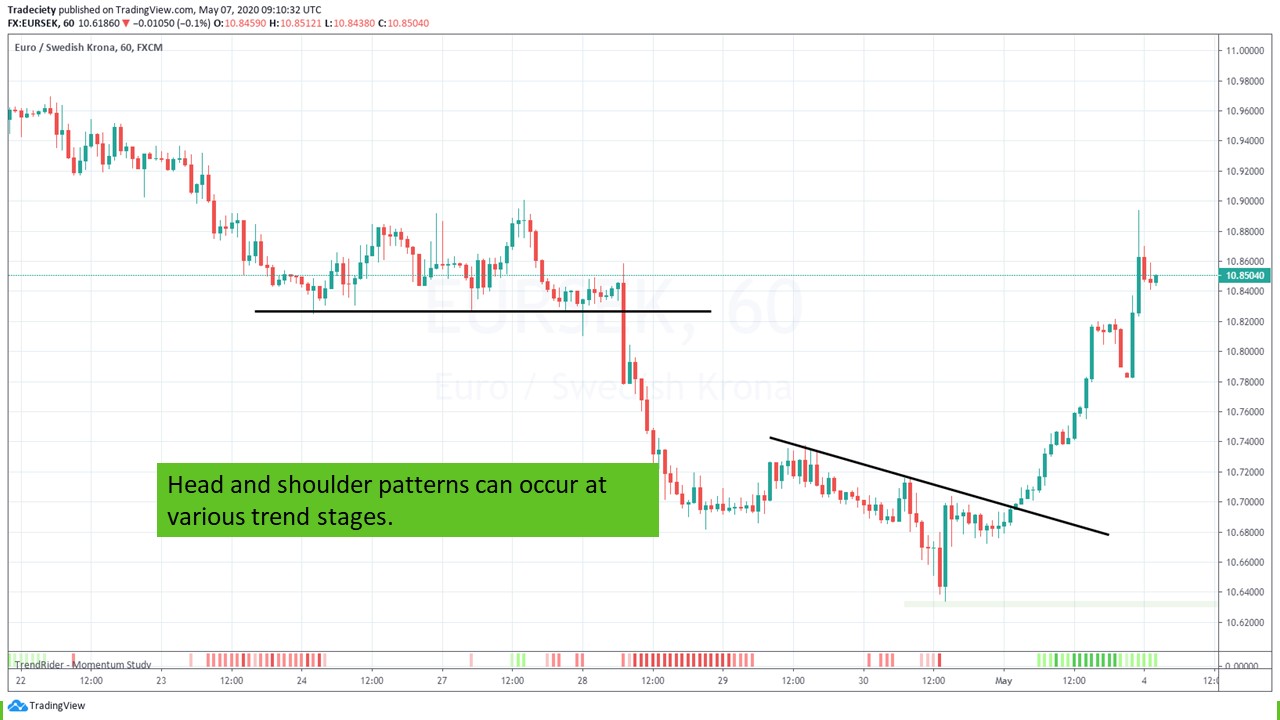
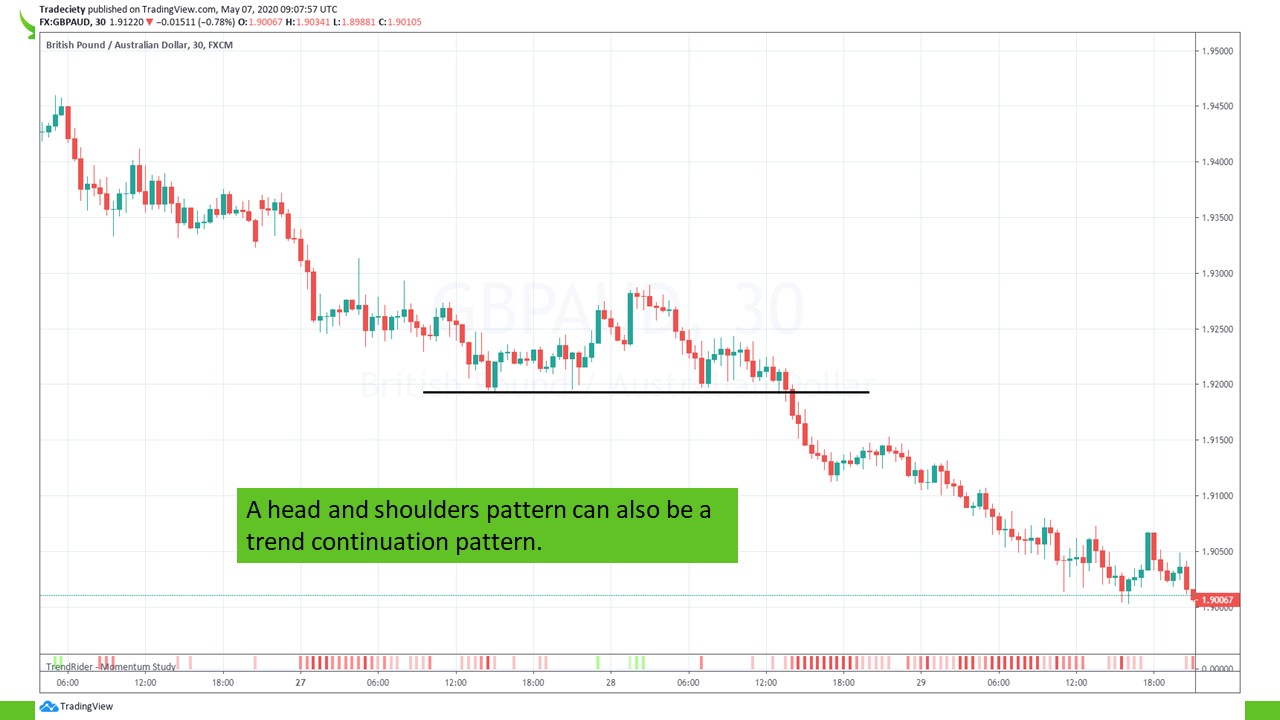
it’s a really, really powerful setup. Head and shoulders. Whenever you look at the classic price action and books about technical analysis, there are many studies that have been conducted around the head and shoulders pattern and many researchers find that the head and shoulders is one of the most reliable, one of the most profitable or potentially profitable price patterns. It really pays off to learn and to master the head and shoulder pattern because it occurs in so many variations, in so many different circumstances. And here in this example alone, we have two head and shoulders. We have a real hand and shoulder, we have an inverse head and shoulder and the head and shoulder at this point is describing the consolidation. The market was trading down. Then there was a consolidation with a head and shoulders. The head shows that the market tried to break out above the previous high.
(09:20):
It did fail, it moved back into the previous lows. It tried to pull away, but there was a breakout buildup, so the market never really was able to move away from the level. And then you have this violent breakout and then the trend continuation. The trend continued to the downside and then here we have a breakout attempt with a downside or a continuation attempt which was not successful. The market traded back into the trend line. We have an inverse head and shoulder, left shoulder here, right the head and the right shoulder here, and the breakout out of this pattern then triggered the new trend. So again, breakouts are really, really powerful if you are able to identify a valid pattern. The better the pattern, the more obvious the pattern. Very often the breakout is also more meaningful and will lead to new strong trading, trending moves.
(10:11):
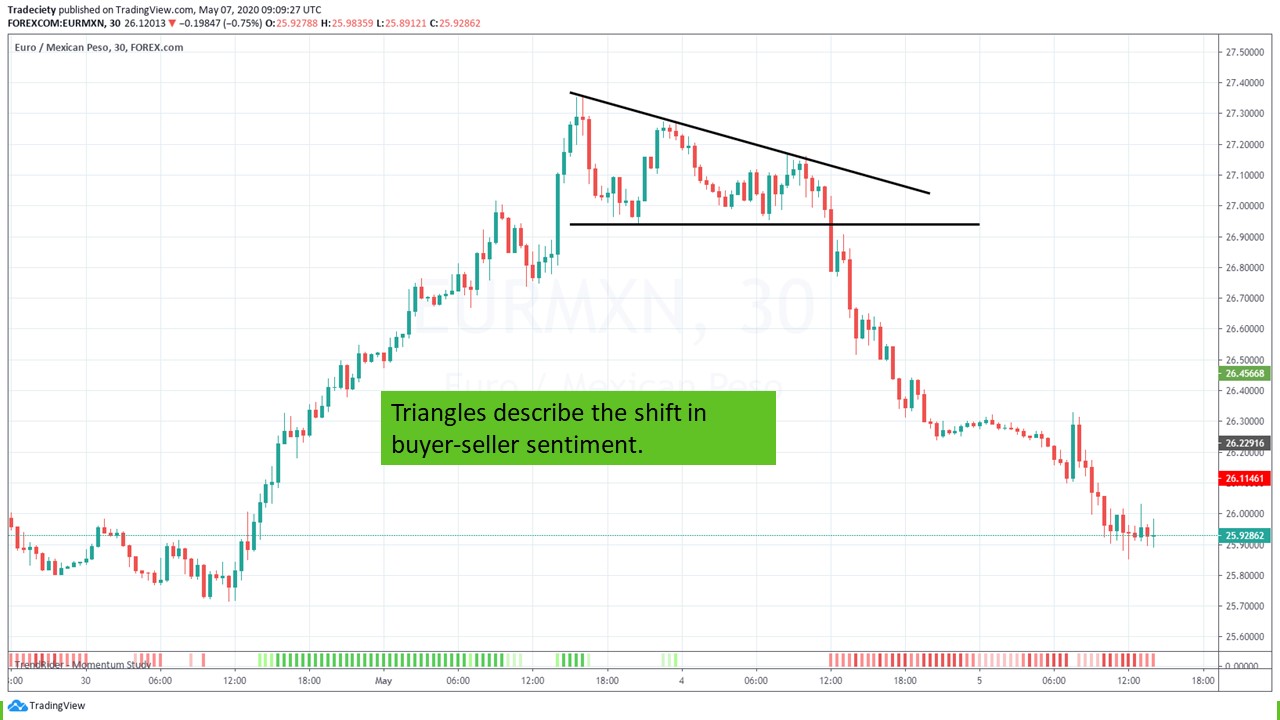
Here we have another example of a head and shoulders as a continuation pattern. The downtrend post here temporarily, the market tried to make a higher high here. Failed immediately, traded back into the support level, was not able to make a higher high, did not even come close to this high, made a significantly lower high. The breakouts then triggered a new downtrend. So again, the breakout after this very well-defined pattern can be a strong, strong trading signal. Here we have a triangle with a horizontal level at the bottom and the diagonal trend line at the top. What does it tell us? It tells us that after the uptrend, the market started to make lower highs, lower highs. Before it was always making a higher high and a higher high and a higher high, but a change in the buyer-seller sentiment, a change in how highs and lows form on your charts can be a very, very meaningful signal and a very meaningful piece of information that will help you understand the dynamics and the strength between the buyers and the sellers.
(11:14):
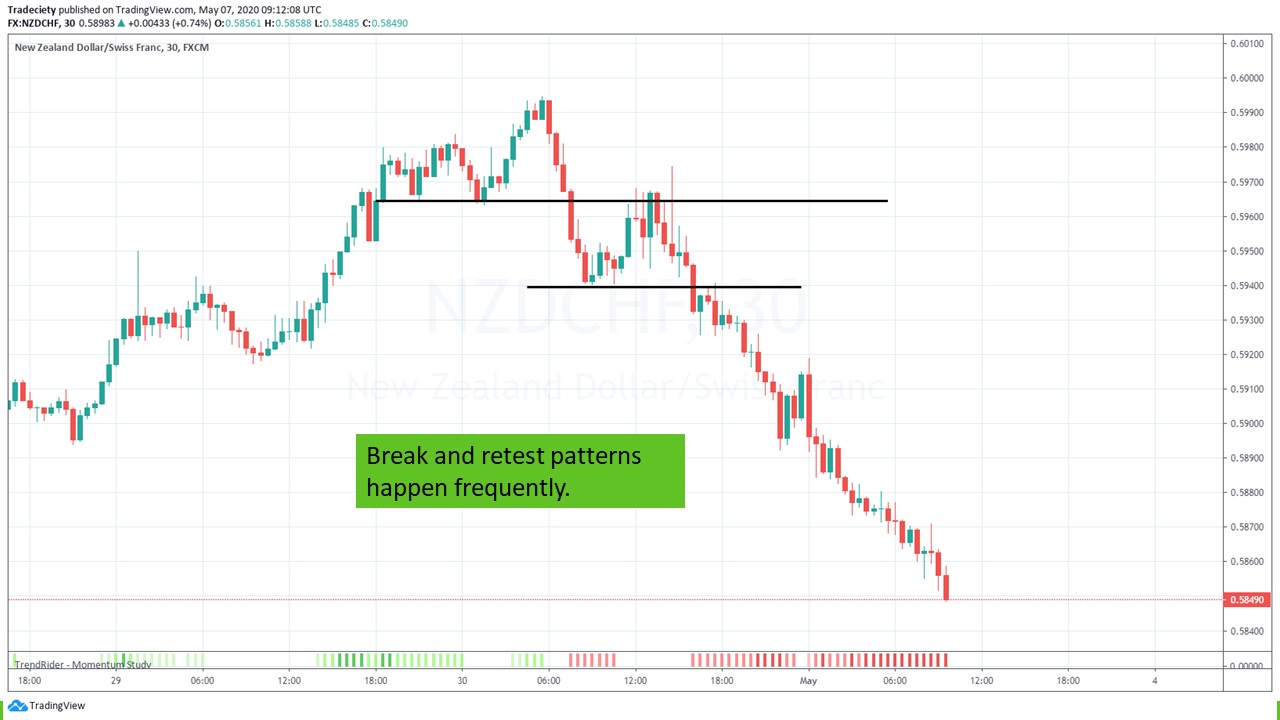
Well, see the buyers were always stronger, now the sellers are gaining more and more strengths. The buyers are slowly withdrawing and then here this violent breakout. Um, marks the trend reversal and again, the breakout connects the uptrend to the downtrend through a pattern. The break and retest pattern is also very, very important. It’s, it happens very frequently. We have uptrend with a higher high. Then we have a very well-defined support level. The market breaks below the previous low, comes back into the level and retests it, and then starts the downtrend. So there are many ways how we can approach breakouts. In our master class we teach various breakout and pullback strategies that will help you trade all different market types or different breakout types. So really you can be very creative. There’s a lot to learn. It’s really a fascinating approach to trading because as I said, a trader that can master breakout trading can pretty much master any trading style.
(12:14):
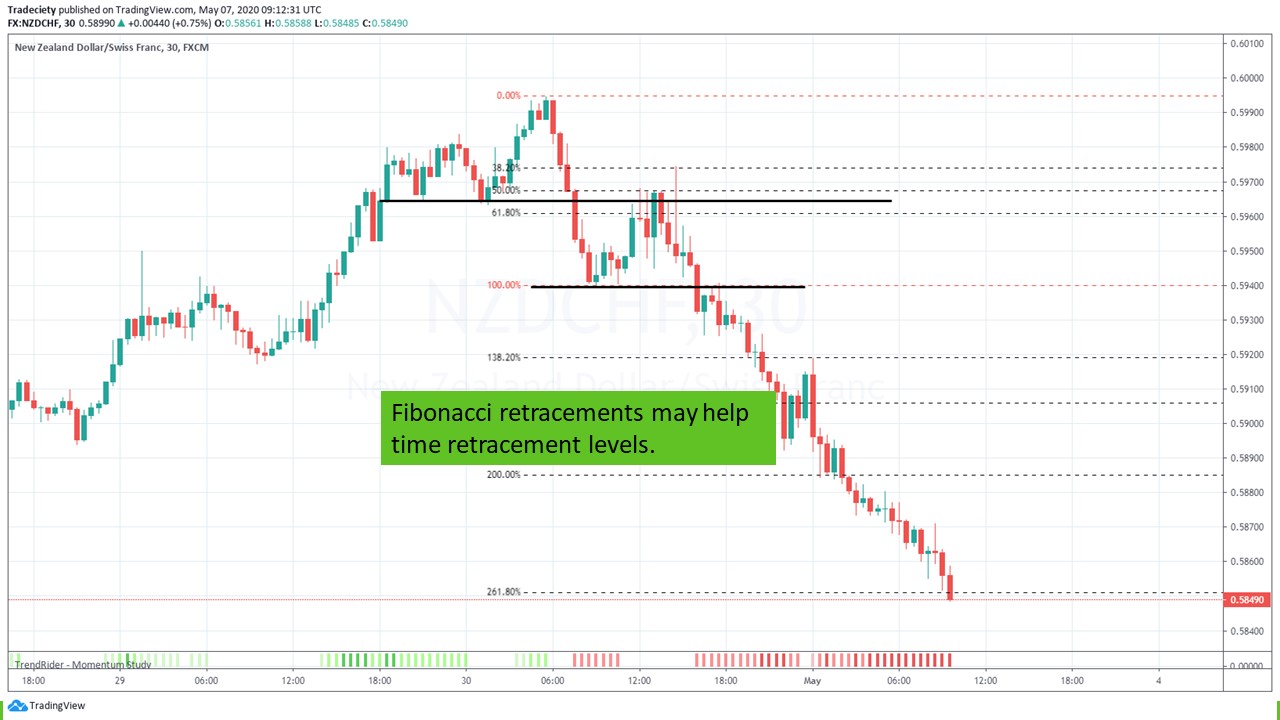
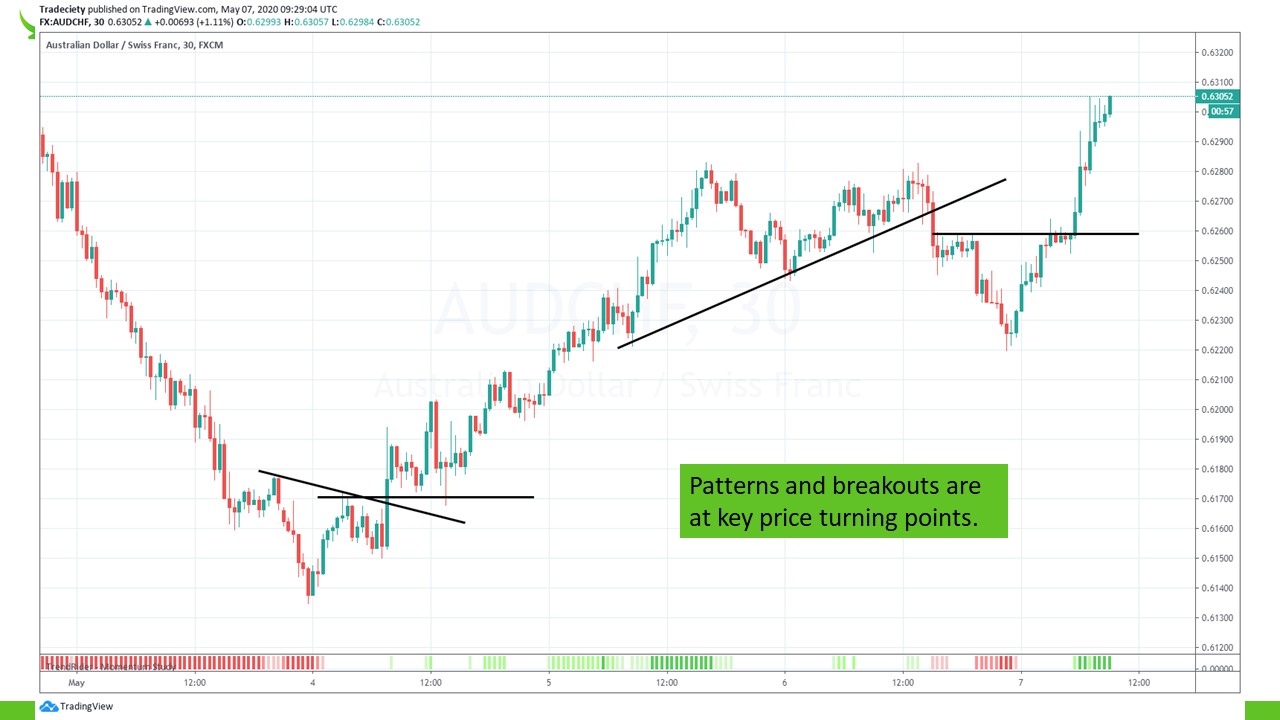
We can apply even a Fibonacci to this. So when we measure our A to B move, we look at does this, really respect a Fibonacci retracement. And then we can use the extensions to find our target. This is how it looks. We apply the Fibonacci from here to here. You can see the Fibonacci retracement, a perfect 38.2 retracement. And then here you can see the market moves into 138, it moves into the 161, it moves to the 200 and even to the 261 so you can use the Fibonacci after the retracement to time your targets as well. Patterns and breakouts are at key price turning points. I can’t stress this enough. A trader that is able to identify great patterns with grade levels and then is able to time the breakouts can potentially transform his trading. Just in this snapshot, we’re going from downtrend.
(13:10):
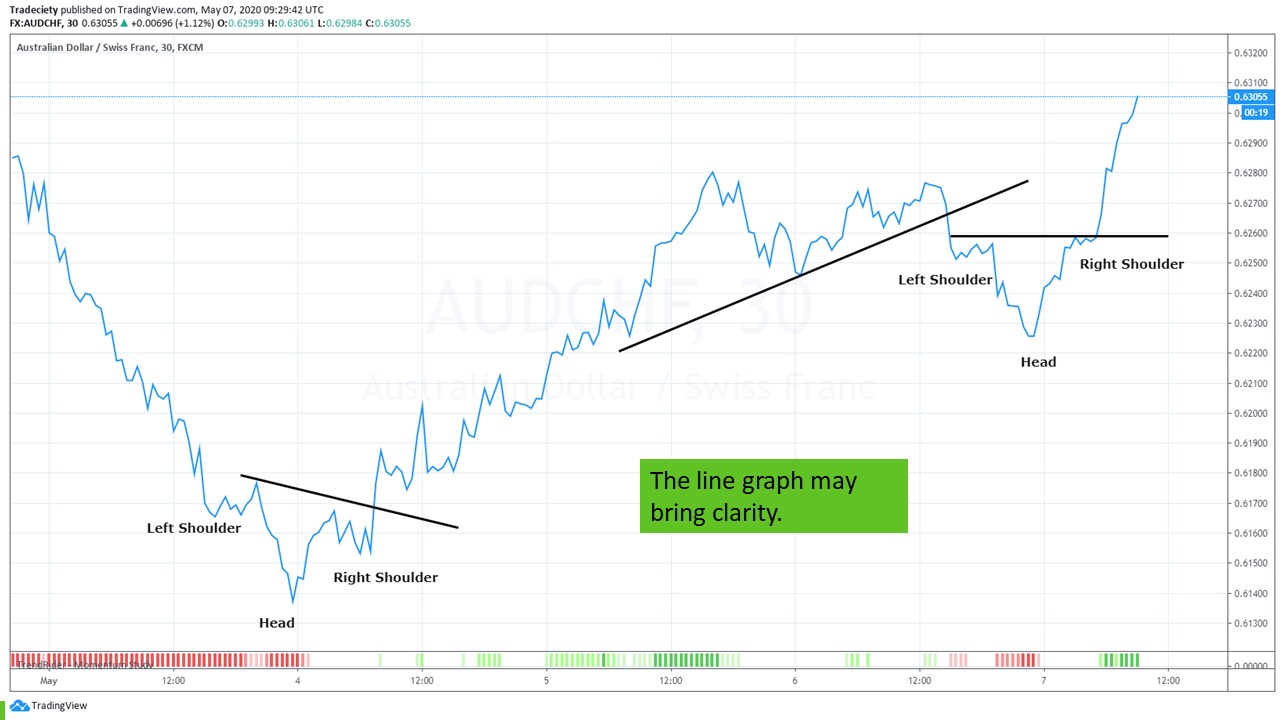
We have an inverse head and shoulder with a trend line. We have a support resistance level here, we have a breakout, we have the retest, we have a trend continuation. The trend continuation leads to here a double top where after the trend line break a new trend is um, initiated, very short trend regardless, still a new trend is triggered after the breakout. Here we have an inverse head and shoulders and forming right after that, left shoulder had the right shoulder. We have a very well-defined resistance level and after the resistance is broken a new trend has started. So patterns and breakouts really help you time new trends or help you understand when a new trend is likely to form. We can add a line graph that may even have us gain additional clarity. So for new traders especially, I often recommend start using the line graph sometimes because you can just see things a little bit clearer.
(14:04):
The inverse head and shoulder here look very clear with a line graph. The inverse head and shoulder here look great. We are able to draw a trend line in here very nicely. We see the lower highs here. So it really can help in the beginning if you’re new to trading and you just want to get a new idea of how to look at charts. Every now and then, switch to the line graph and see how it may help your price analysis. And that’s it for this video. I hope you enjoyed the breakout master class. If you did, make sure to subscribe, make sure to leave a like and comment on this video and I hope that you will be back when I make my next video.
external link:


We have been trading supply and demand strategies for over ten years, and they have stood the test of time remarkably well. Supply and demand is...

3 min read
Choosing the right trading journal is essential for traders wanting to analyze performance, refine strategies, and improve consistency. In this...

3 min read
“95% of all traders fail” is the most commonly used trading related statistic around the internet. But no research paper exists that proves this...