Supply and Demand Trading in 2026
We have been trading supply and demand strategies for over ten years, and they have stood the test of time remarkably well. Supply and demand is...

In this video we are mostly focusing on the 50, the 100, the 200 and I will show you how to use them in your trading.
(01:12):
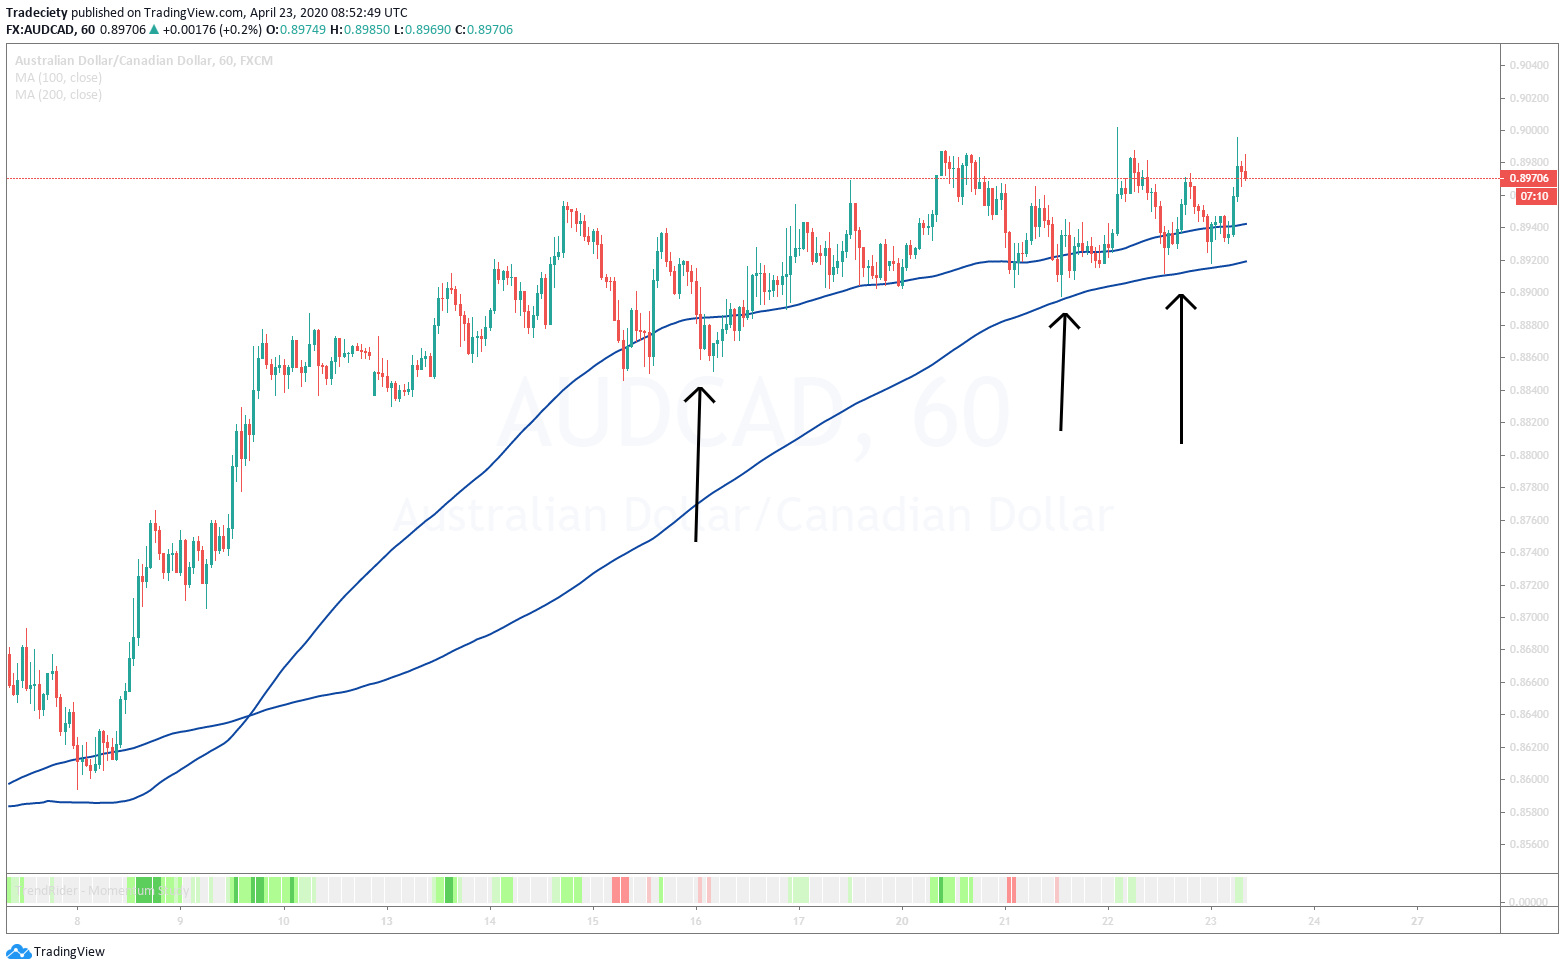
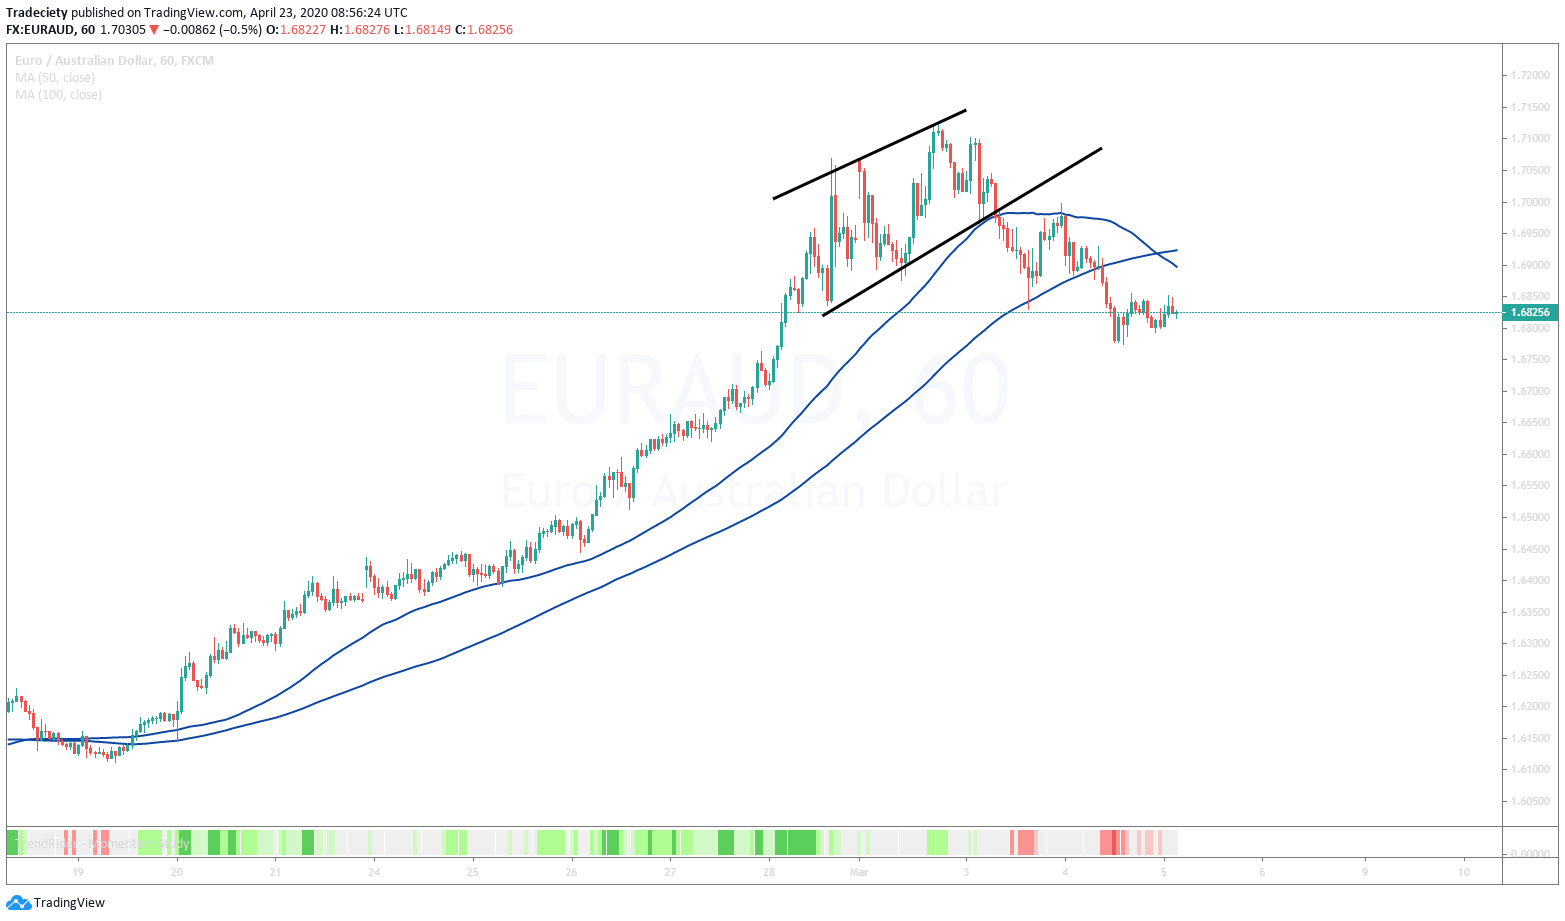
So here in this example, we have the 100 period and the 200 period moving average. I use a simple moving average. It doesn’t really matter and the differences between the SMA, the EMA, are very, very small. The most important thing is that you always keep the same moving average. So don’t use the simple moving average the one day, then the next day you use the exponential moving average. Choose one and then stick to it. And the way we are using in this example the moving averages is to help us identify trend momentum and trend strength. So here you can see the market was in a very, very strong trend and the price was well above both moving averages. And then here on the second part of this window and this screenshot, something has changed here in the market dynamics, the market reaches the moving average for the first time.
(02:00):
In the later part of this video, we are going to look at pullback strategies, how you could have traded those pullbacks. But in this example what is really important is that you see the moving averages, they converge, they get closer to each other, which means that the momentum is going down, the trend is losing strength and you can see that here the moving average is really catch up to each other. This is a clear sign that the market is moving as losing momentum.
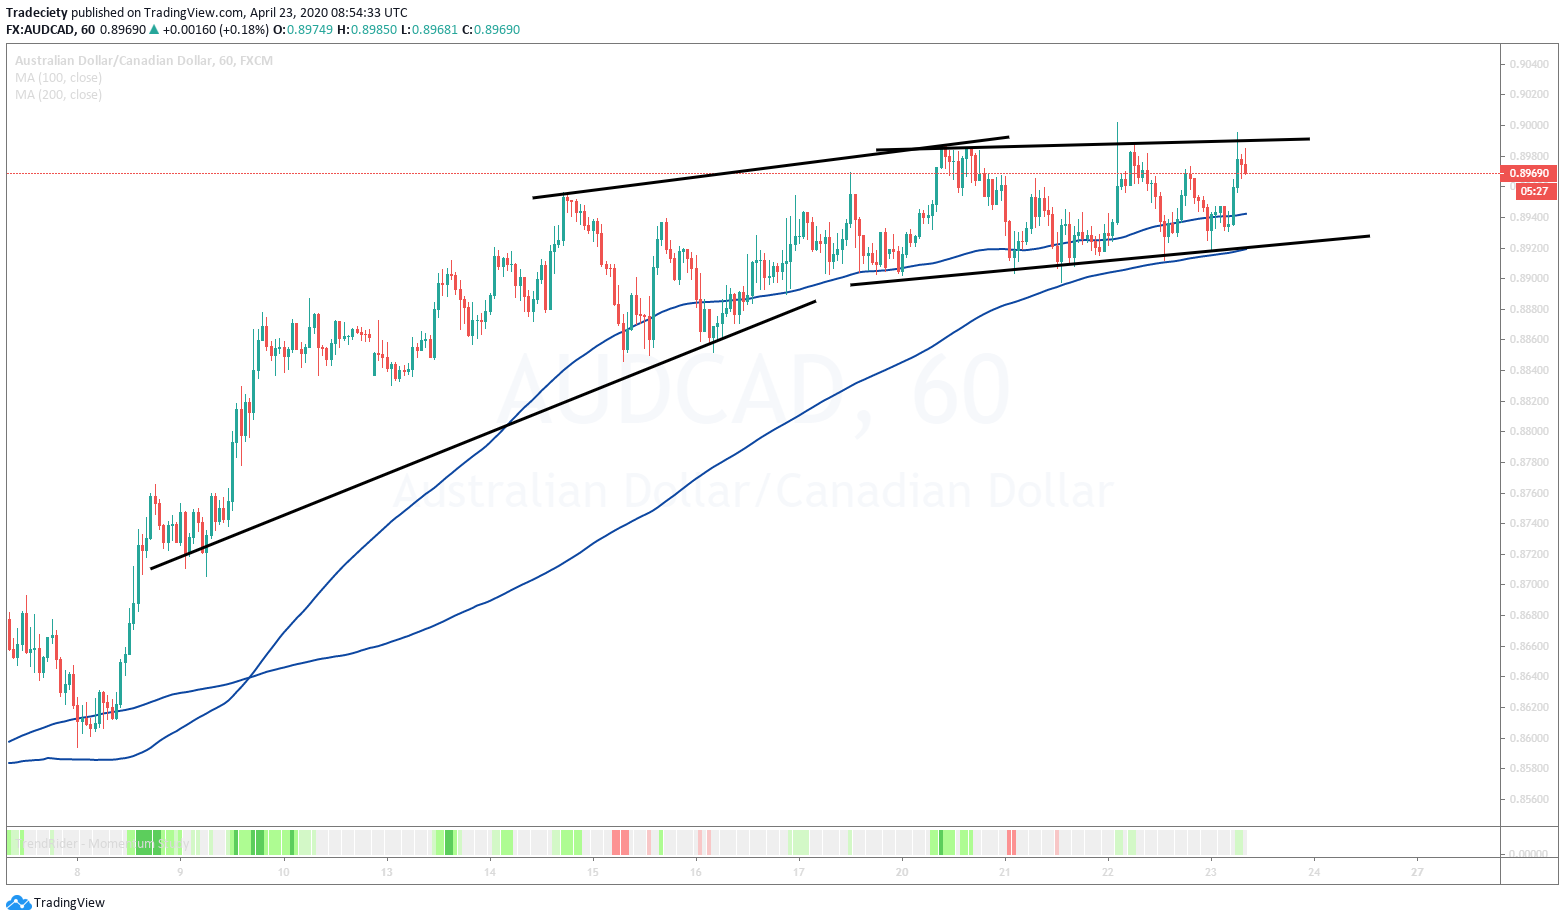
When we go here to the next slide, this is the same chart. Now when we look at the trend lines, we can also see this behavior. The trend lines in this example show us the trend exhaustion. You can see here we have a very steep or rather steep trend line. When we would look here for a trend line, this would even be steeper and here the trend line is almost horizontal, which means that the market has no trending at whatsoever anymore.
(02:52):
The trend has completely died down and now if you’re not already out of your trend following trade, now would be a time to get out of the trade and wait for the market to show you a new phase and show you a breakout in either direction, a continuation to the upside or a new trend on a breakout to the downside. But the moving average has already told us that something is changing here in the markets.
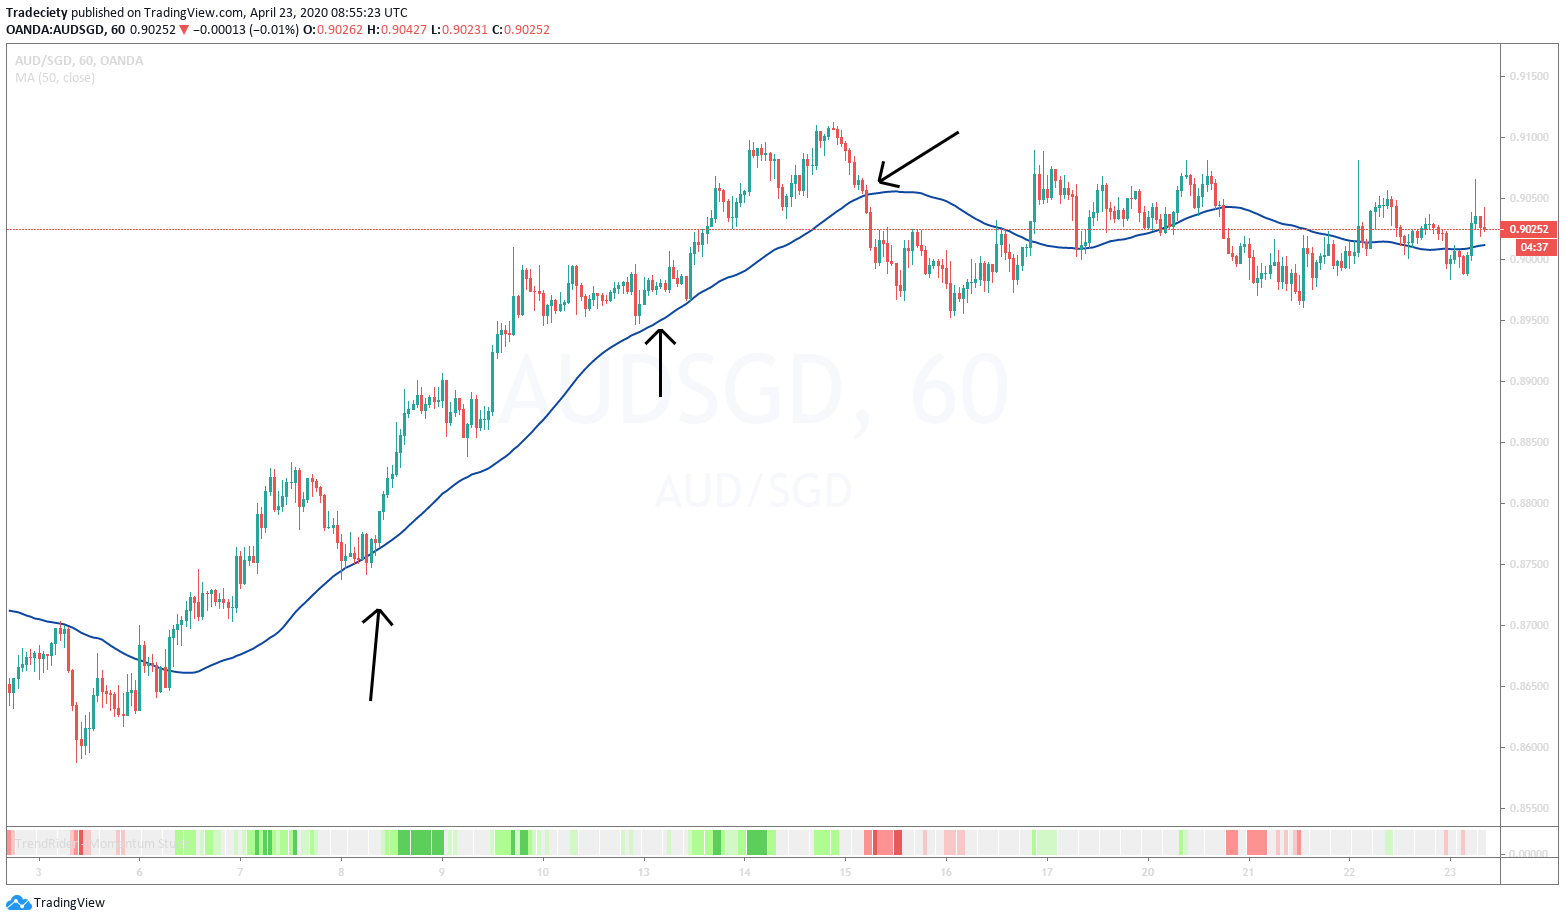
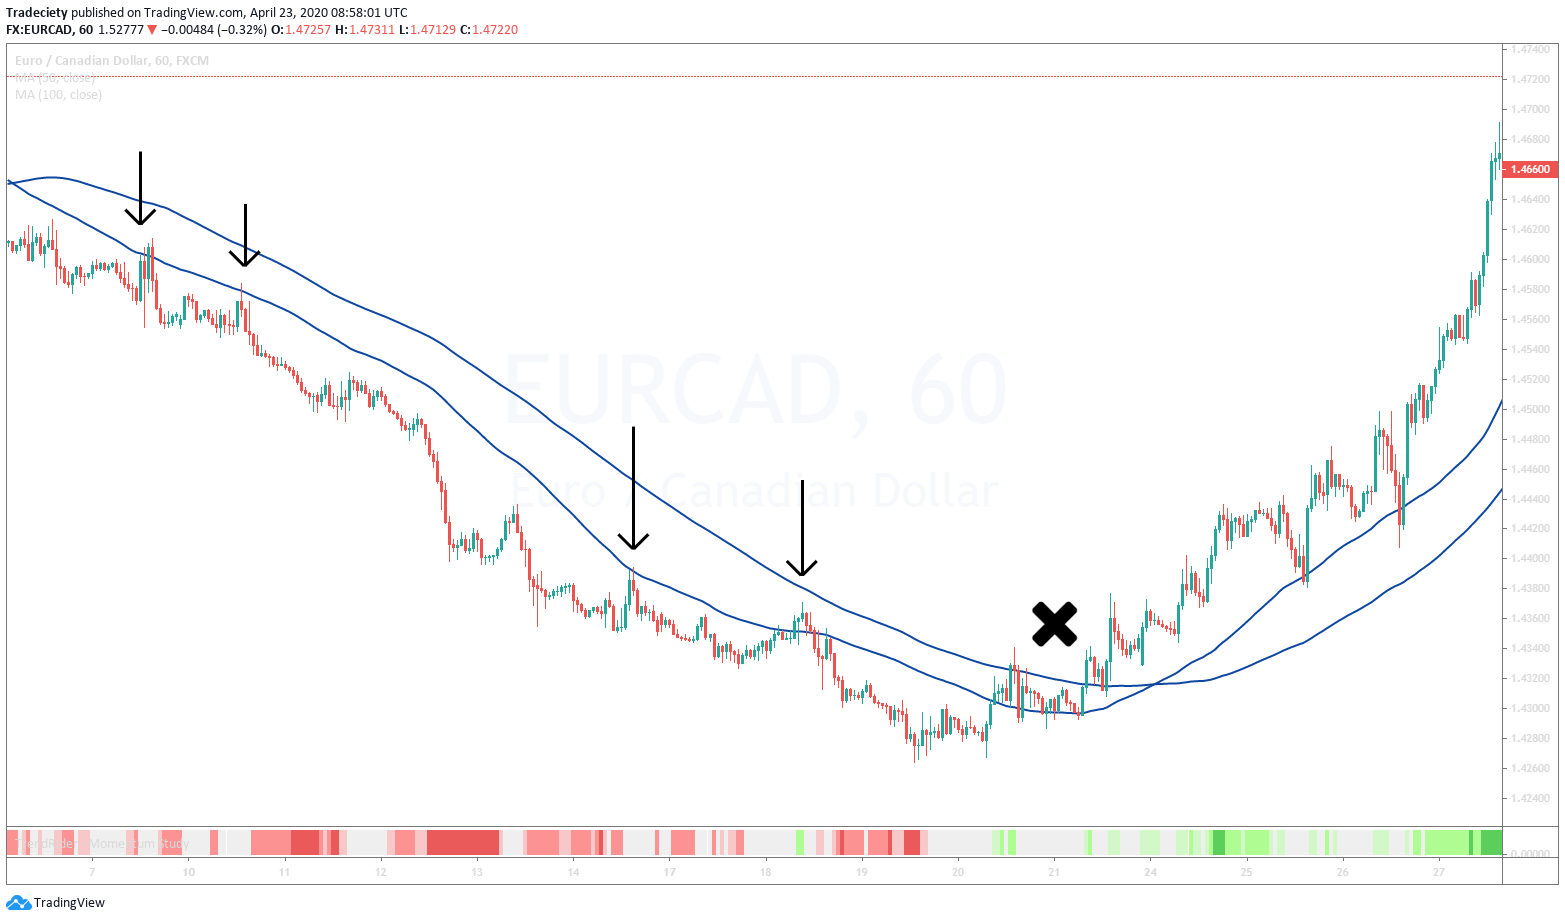
Here in this example, we use the 50 period and the 50 period moving average can often be used during trending markets to find pullback opportunities. So whenever you see that the market is moving back into the moving average like it did here and here, those are often great opportunities to find and time pullback traits. I don’t recommend to blindly use those moving averages and those pullbacks to get into trades, but you could use also a horizontal level of support or resistance in this example to wait for the breakout and to really show and really show what the prices are giving you here this momentum. Here as
(03:53):
well, you could have drawn here at the resistance level and then once the market has touched a moving average and broken out above the resistance, then the trend continuation starts. And then here on the break off the moving average, that is always a sign that something is shifting and changing in the market structure and also in the momentum the market is showing. So here you can see the, the downtrend really didn’t start but the uptrend clearly was over. So once the market breaks the moving average, that is really an important tell. And if you are in a trend following, in a trend continuation trade based of a pullback or whatever reason, then it is a time to get out of your traits. If the price breaks, such a moving average. And you can see afterwards the market, uh, drifted sideways and there was no trending behavior anymore.
(04:43):
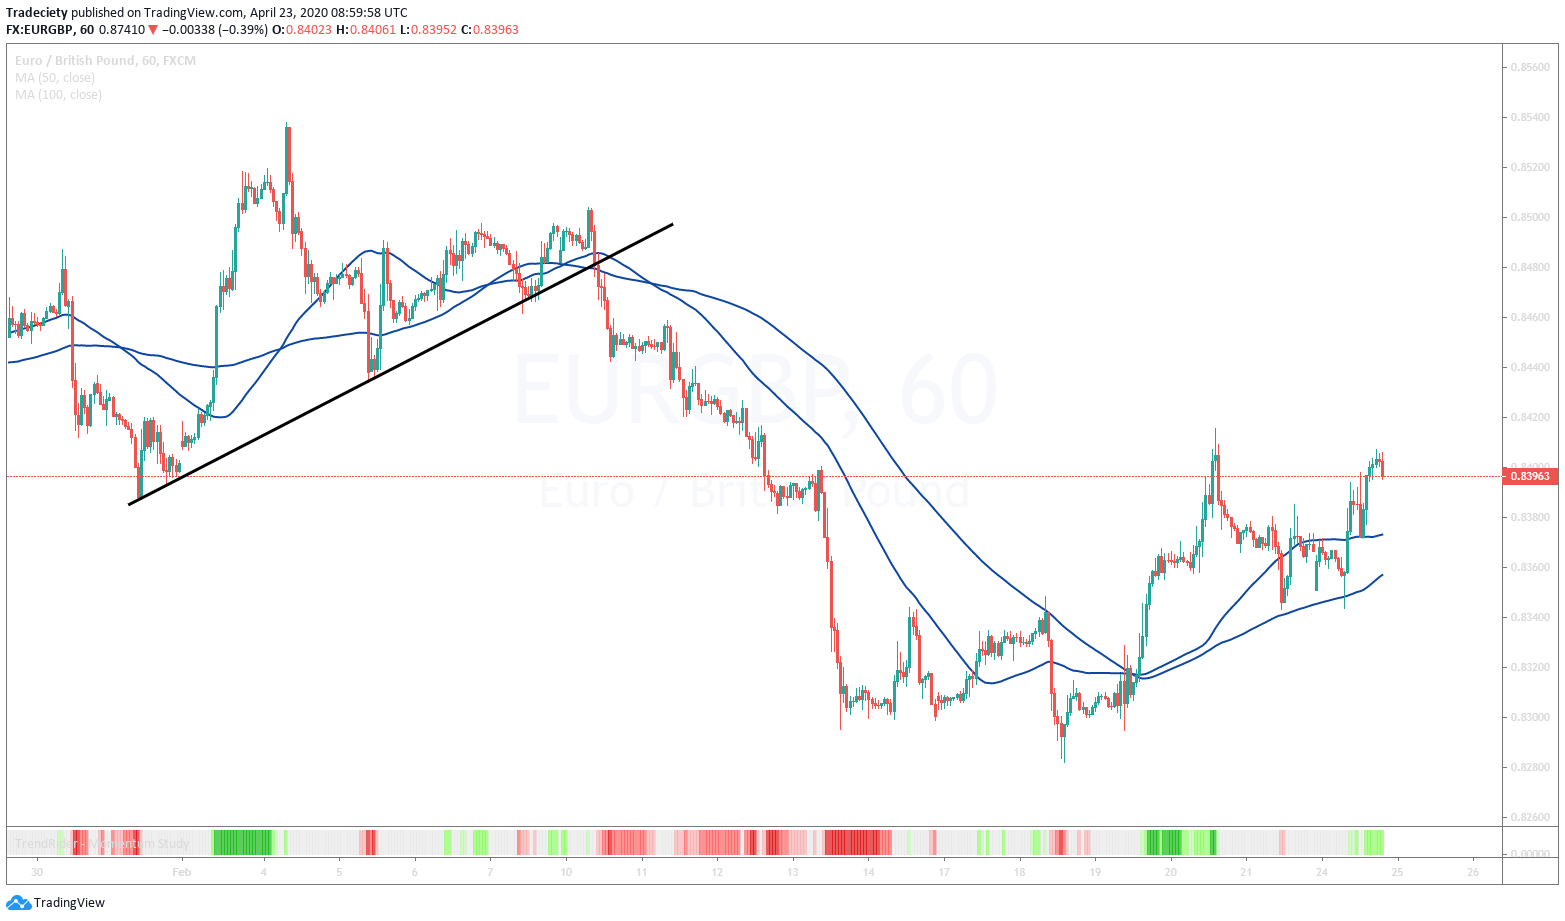
Here we are using the 50 and the 100 period moving average for another pullback approach. So in this example, what you want is that you are looking for an existing trend which we have here in uptrend. We have a downtrend and another uptrend. And every time the market moves into the 50 period moving average and moves into this zone between the two moving averages without breaking them, that’s really important, then a trader may look for pullback opportunities. So here on a 50 period moving average, we have our first move into the 50 period moving average, you could have applied a resistance level here or a trend line. Then time your trade wants, this trend line has been triggered. You have a close reaction here. Here you have a much deeper pullback but the market has never broken below the 100 period moving average.
(05:30):
It tested it twice and then the continuation happened. So as long as the market stays within this zone, the uptrend is technically not over yet, but you may start looking for uptrends and it is very, very important that you stick to the commonly used moving averages, the big round numbers because as I said in the beginning, the concept of the self-fulfilling prophecy is very, very important because millions and millions of traders, algorithms, they all are based on moving average and they trade based on moving averages. So you really want to make sure that you are trading with the majority. And then here the market rolls over, starts a new downtrend and again it dips into the moving average here twice and then continues this downtrend. So if you miss the first entry here for whatever reason, then waiting for a pullback may be a good option and the 50 and the 100 prohibited moving average and using this as a zone to time pullbacks may be a good option.
(06:27):
Here we see it again the, the downtrend and that here and on this triple bottom, it broke both moving averages started to uptrend and then there are a few occasions where the market kept digging and kept dipping into the, into the zone between the two moving averages. So very, very interesting and a very potentially profitable trading approach with those moving average zones. Here we see the exact same scenario. The last screenshot was a long-term chart on the higher timeframe.
Now we are using a one hour time frame and we are also using the 100 and the 50 period moving average and you want to see that the market is reaching the zone, the higher moving average, and then you are waiting for signs that the market is really resuming. It is not enough to just trade based on the moving average touch. That is not a strong enough signal because eventually at one point the market will usually break the moving average,
(07:20):
so you really want to make sure that you’re seeing momentum away from the moving average to time your trend following traits. Then here at the top, that’s where you see that the market established this channel. First it touched a moving average but it didn’t go much further and now you can see the market eventually broke completely through both moving averages. It broke through the trend line. So here we have a trend change, so whenever the, the moving average has been broken, then a new trend may emerge and here it has a good chance that this market will completely roll over.
Another final example for this trading approach. We have the 50 and the 100 period moving average and there are multiple times when the market dip back into the zone of the moving averages. One interesting fact is that when the both moving average, when they converge and when the price dips deeper into the moving average, especially after a long trending period, then this may serve as a heads up because the longer the trend goes on and the deeper the pullback into the zones, then the trend changes often not far away and just happened and here the market completely rolled over,
(08:29):
it broke the two moving averages and then you can see the same pattern existed on the way up as well. Dips into the moving average, pullbacks into the zone and then a continuation.
Here we are using the 50 and the 100 once again and here on the right hand side, the market was a range market. You can see the market crisscrossed the moving averages and you can also see that we have a very well defined trend line which also describes this range market and it’s very important that you understand that if your range market’s moving, the averages won’t work. The moving average will always fall into in the middle of the range market and therefore we cannot really use it. But once the market triggers the breakout here, the breakout leads then to a new trend, that is when the moving averages are working again and you can use those moving averages to hold on to your traits as long as they haven’t crossed then you may still keep your trade running.
(09:29):
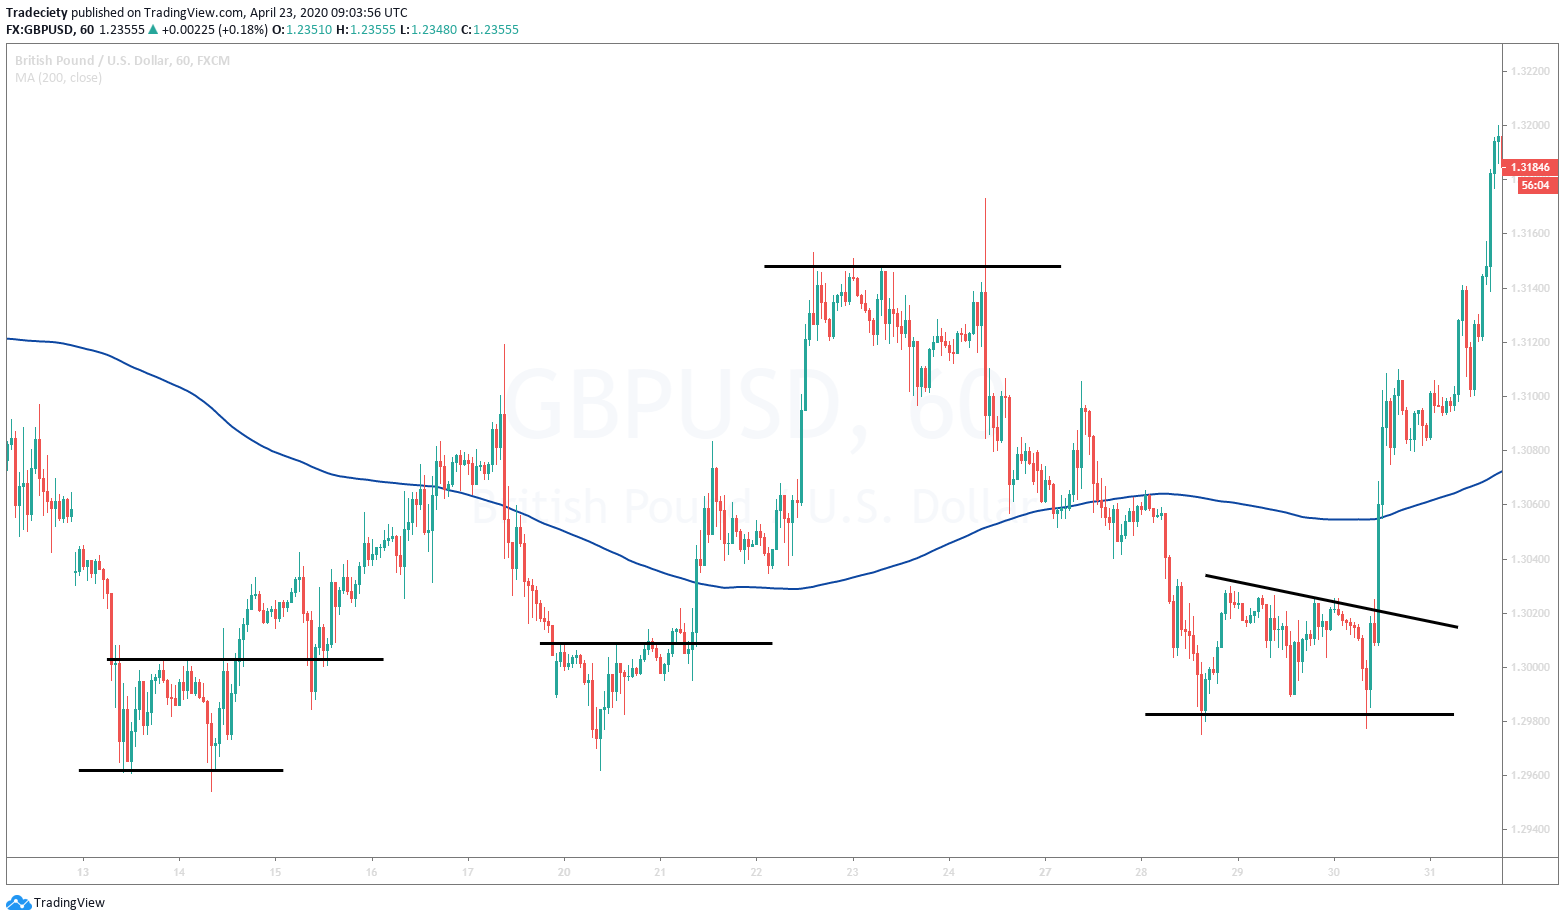
A completely different approach is here, this moving average reversion strategy. We’re using a 200 period, very long term moving average and especially in the Forex market, which is generally considered a mean reversion market. You will often see that the market is fluctuating around this long term moving average. So the idea is that we are finding opportunities and scenarios when we can trade the price back to the moving average. So we look for scenarios when the market is very far from the moving average and when the market is showing us some exhaustion pattern. Here in the first example, we have a double bottom with a spring. You can see we are very well-defined resistance the market breaks out, makes a very dirty retest and eventually comes back to the moving average. Then here it traits again once, once again very far from the moving average.
(10:19):
It gives us this inverted head and shoulder and then once this has been broken, we should back into the moving average. Then on this uptrend, we have a very long uptrend, very far away from the moving average. We have a multi top, we have this huge fake out and then the market drops back into the moving average and here once again a double or triple bottom with a well-defined trend line. I can see how explosive those moves often are, a very big candle here, a strong candle, here also huge candle. So once you have identified such a pattern and once you have identified a scenario where the price is very far from the moving average, you may go down to a lower timeframe to time the traits back into the moving average. And this works exceptionally well in Forex market because it’s generally considered a mean reversion market.
(11:07):
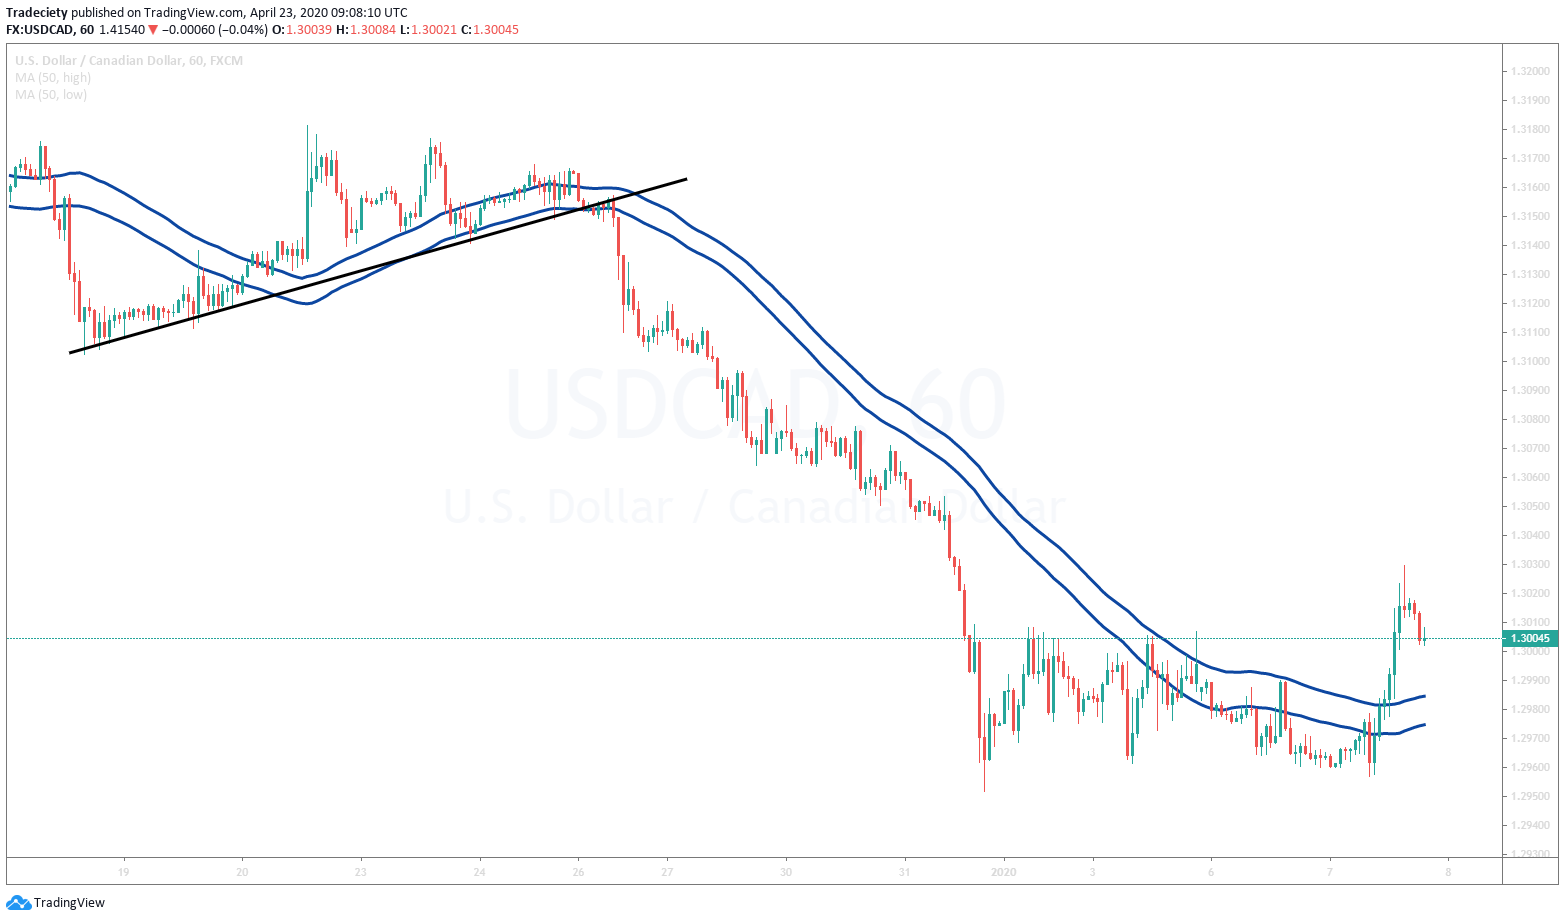
The 50 period tunnel is so popular in the past videos, I talked also about a 20 period tunnel. So you can basically use the tunnel on any time frame or with any setting as well. And what you do is you open a moving average on trading view or your platform and instead of going for the, the common and the default setting, which is usually high, low, close, divided by three, you just choose the setting of high and low. So you have two moving averages. Both are the 50 period, one is applied to the high, one is applied to the low and this will give you this nice channel and how you’re going to use it, is as a confirmation to stay in trends and trend following traits better. And you can see here we have a trend line. Again, during a range market, the moving averages won’t work, but if you can define such a nice pattern, you just simply wait for the breakout and if you get in, you can use this tunnel as a confirmation and to boost your confidence because one of the biggest problems that I keep seeing in traders is that they can’t hold onto their winning traits.
(12:11):
They are often scared of giving back profits and the moving average tunnel is a great trend following tool and you can see during trending markets the moving average will often be respected or at least it will hold as long as the market is really in a trending mode. And when the trend is then slowing down or when a trend is pausing, then the price will dip into the moving average and it will also completely break the moving average. That’s the time when to get out. And the moving average tunnel is really a great tool that can be applied and added to any trading strategy to just provide more confidence in the price action.
external link:


We have been trading supply and demand strategies for over ten years, and they have stood the test of time remarkably well. Supply and demand is...

3 min read
Choosing the right trading journal is essential for traders wanting to analyze performance, refine strategies, and improve consistency. In this...

3 min read
“95% of all traders fail” is the most commonly used trading related statistic around the internet. But no research paper exists that proves this...