Supply and Demand Trading in 2026
We have been trading supply and demand strategies for over ten years, and they have stood the test of time remarkably well. Supply and demand is...
Candlesticks are the foundation of any price action chart. And although I do not recommend to trade candlesticks blindly – because their predictive power is not strong enough – when combining candlesticks with other confluence factors of technical analysis, a trader may improve the odds for determining the right price direction.
There are dozens of use cases for candlesticks but the one that we found to be most reliant is to use a strong candlestick signal to determine your higher timeframe bias.
For example, if you find a strong candlestick signal on the Daily timeframe, you can establish a directional bias for the lower timeframes and use the candlestick information as a trading filter.
This works extremely well and helps traders pick the direction for their trading. In the following, we will show you how to determine the higher timeframe bias with the 13 case studies we prepared.
During our masterclass courses and webinars, we also pay close attention to candlestick analysis and we dive even deeper into price action trading. If you are interested, make sure to have a look:
Tradeciety’s Masterclass Program
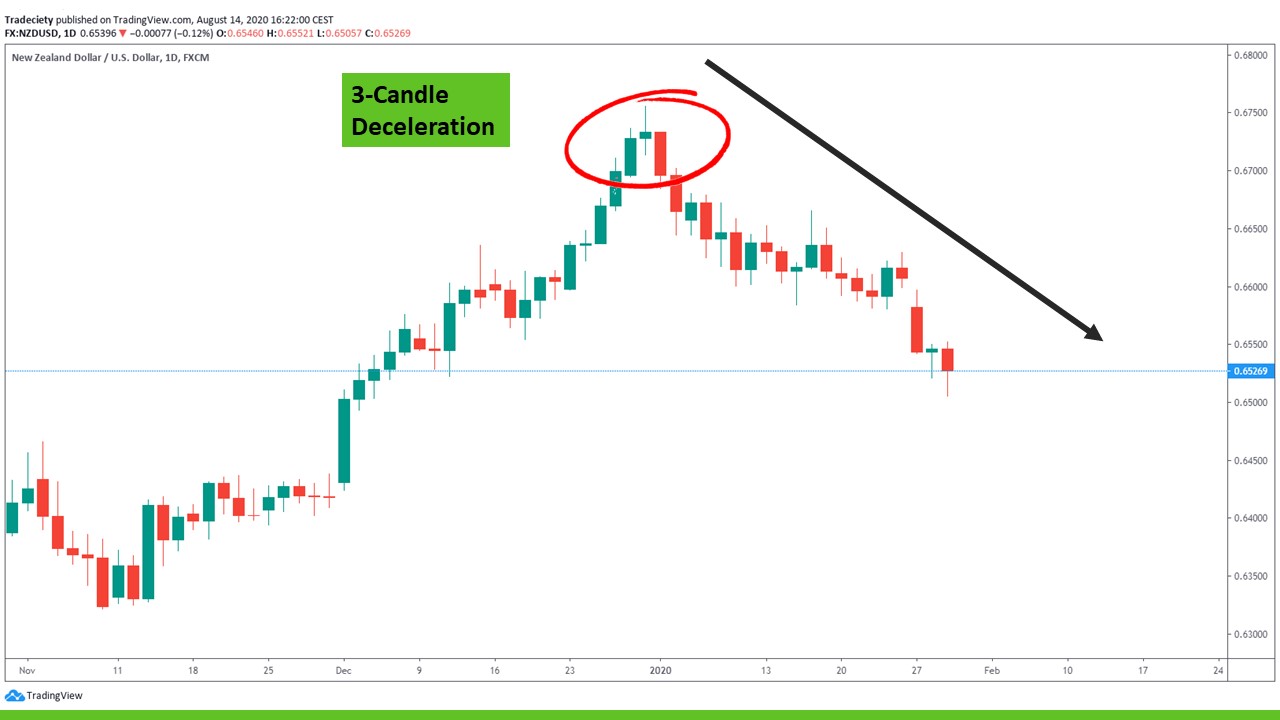
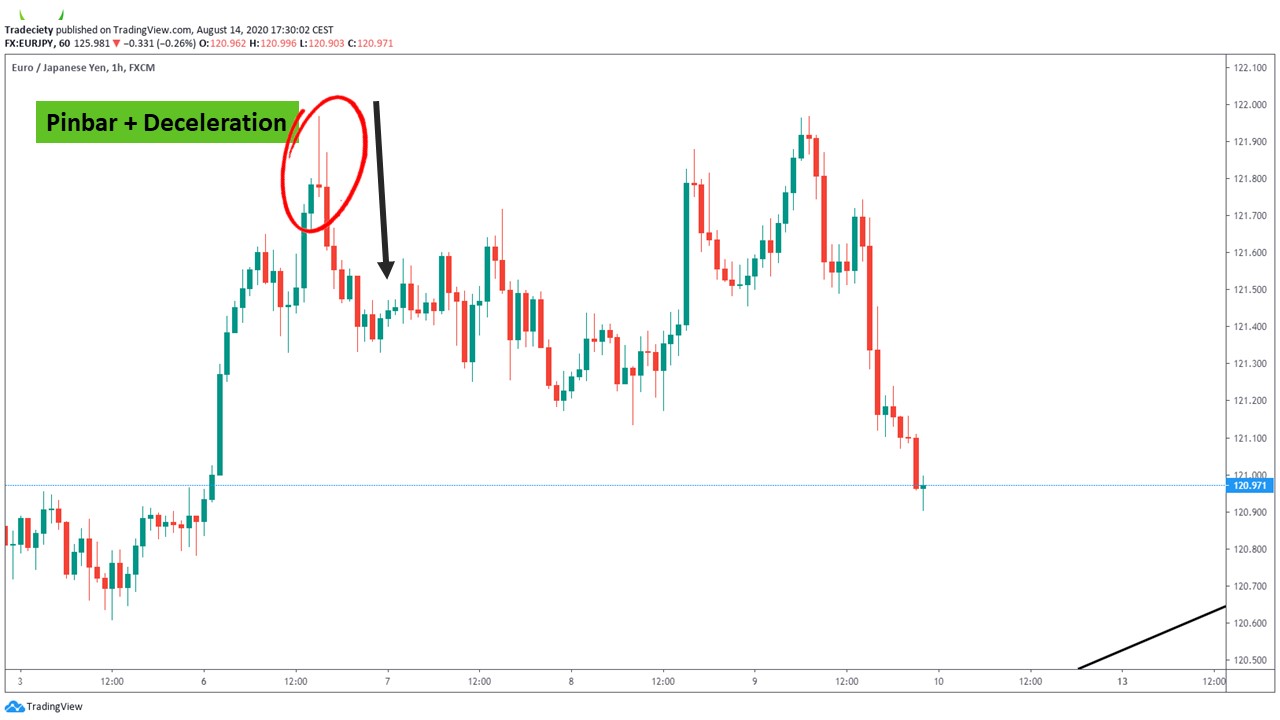
I have been talking about the deceleration concept for a while and we teach one multi-timeframe trading strategy that uses this approach in our masterclass as well. It’s a super-powerful candlestick formation that helps to understand the change of momentum during a long trend.
During the long uptrend, you suddenly see a small Doji candle and then a strong bearish candle. This sequence indicates that the buyers are not as strong and that the price is high enough for the sellers to come in.
Most importantly, the deceleration pattern is best traded during a strong and overextended trend. The longer a trend goes on, the higher the chance of seeing a reversal back to the mean – especially in the Forex market which is considered a mean-reverting market.
Once a deceleration pattern has been identified on the higher timeframe, the trader may drop to the lower timeframe to look for trades in the direction of the deceleration pattern.
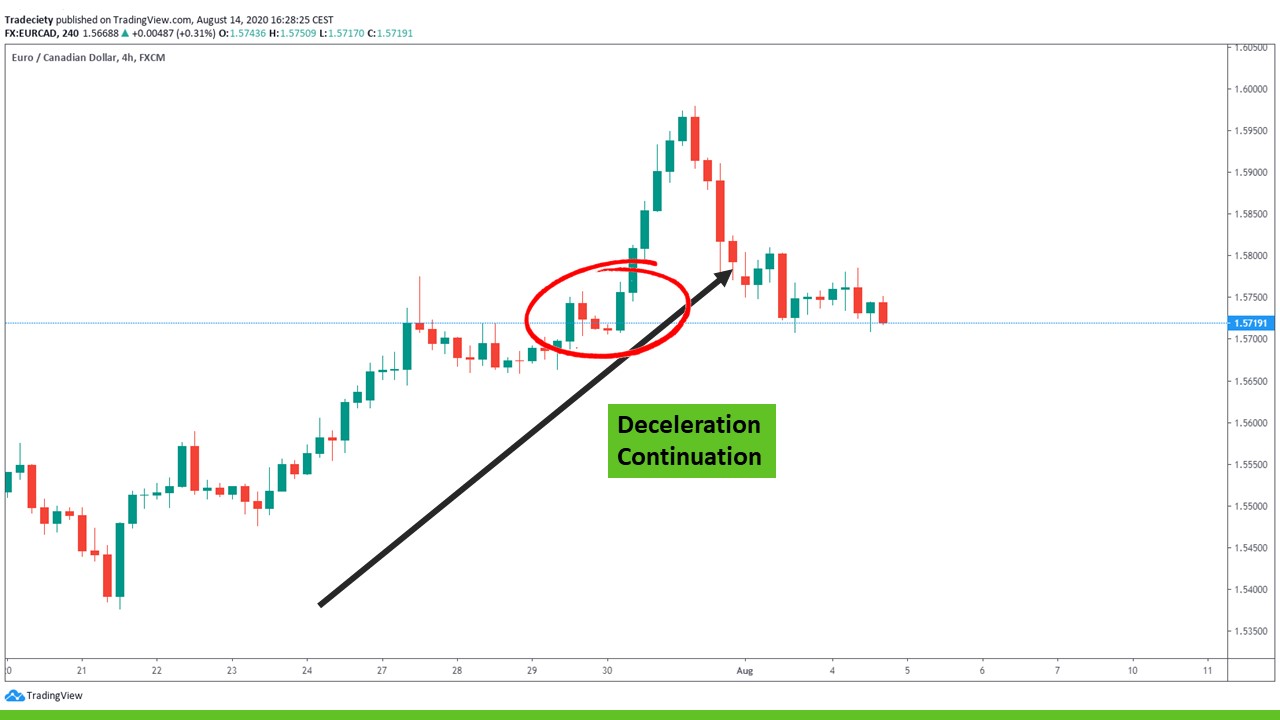
The deceleration can also be found as a continuation pattern.
In the example below, the price was in an uptrend and during the correction phase, the corrective wave gave a deceleration pattern: Bearish candle – Doji – Strong bullish candle.
This pattern indicated that the bulls are reclaiming the trend and that a continuation is likely.
Continuation patterns are best trades early on during a trend because the likelihood of a successful continuation is higher.
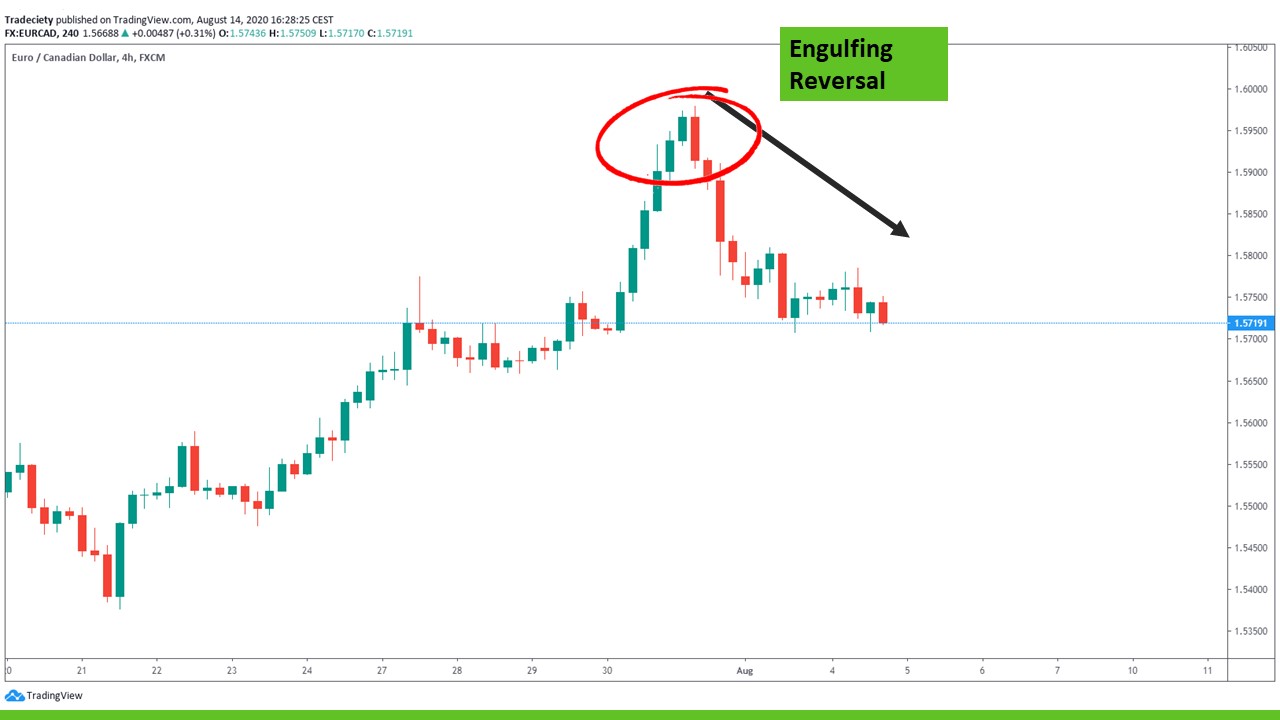
The engulfing candle is very versatile and we will observe multiple engulfing candle scenarios during this article.
In the example below, the engulfing pattern happened as a reversal pattern. The bullish trend had been going on for a while and the engulfing pattern indicated a shift in momentum.
The large, red engulfing candle is significantly larger than the previous bullish candle. The bearish candle is also the largest bearish candle that was observable during the whole uptrend.
Such a significant change in candle size should always get the attention of traders because it indicates a major shift in the buyer-seller dynamic.
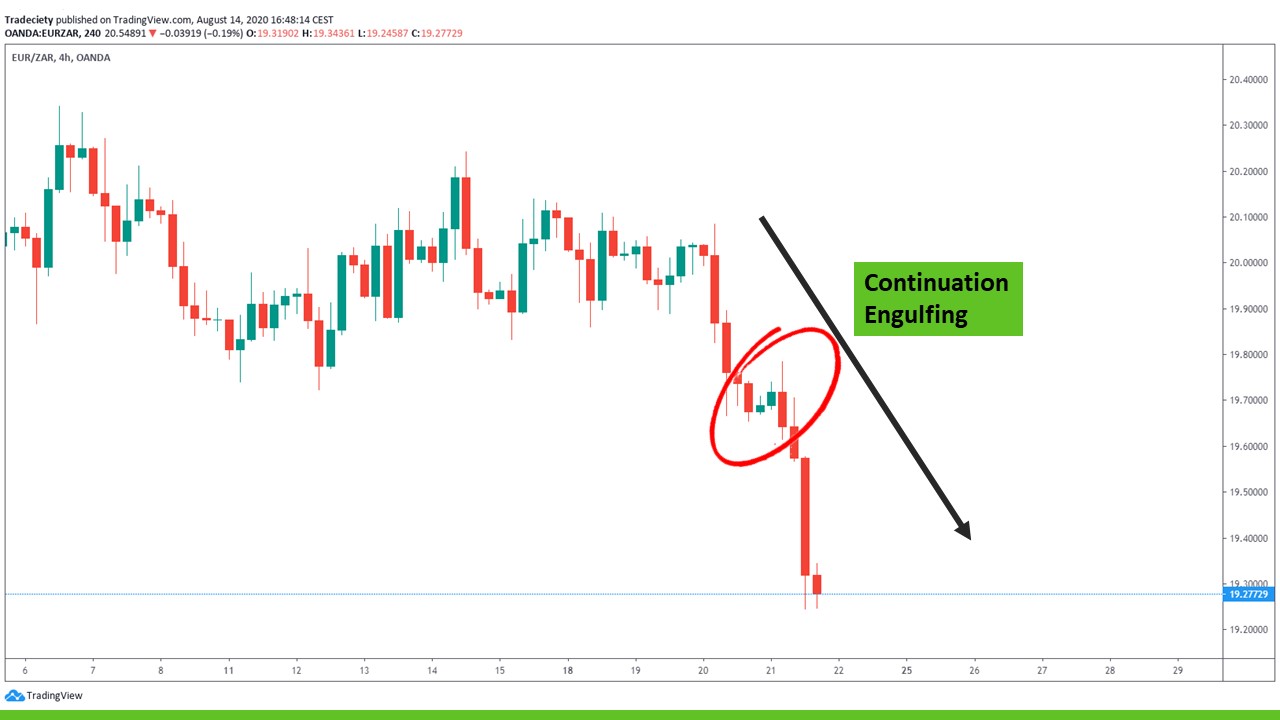
Engulfing candlesticks can also be used as a continuation signal.
The price had just broken out of the range to start a new downtrend when the price gave a short corrective wave. The price always moves in ways and during corrective phases, it can pay off to look for continuation signals.
The two bullish candles were small in size, indicating that the bulls were extremely weak and could not get the price higher. Suddenly, the trend continued with a bearish engulfing candle. The break-away with the engulfing candle signaled that the bulls have withdrawn and that the bears are now continuing the downtrend.
As indicated above, paying attention to candle size during a trend and corrective waves is a great way to improve your chart reading skills.
Did I say that the engulfing pattern is extremely versatile?
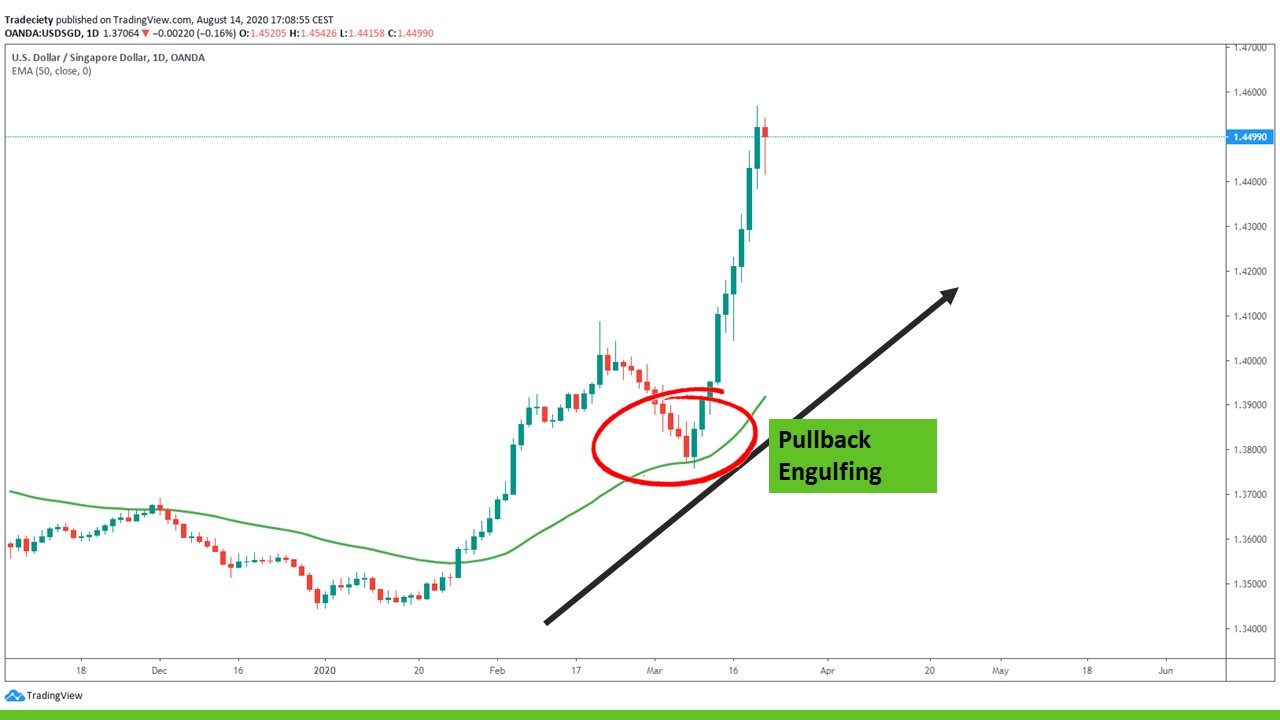
In this example, I used a 50 EMA as a trend-following tool. The price was always above the EMA, indicating a bullish trend. During a bullish trend, traders should look for buying opportunities.
The best pullback opportunities usually exist when the price moves back into the moving average and then provides a strong signal. Keep in mind that trading the touch of a moving average is not enough but by adding multiple confluence factors to your decision-making, the chances for picking the right direction may increase.
When the price hit the EMA in the example below, the price also formed a strong engulfing candlestick pattern. The correct wave, at this point, had been going on for a while and the pullback then offered a much better price for the buyers to get into new trades.
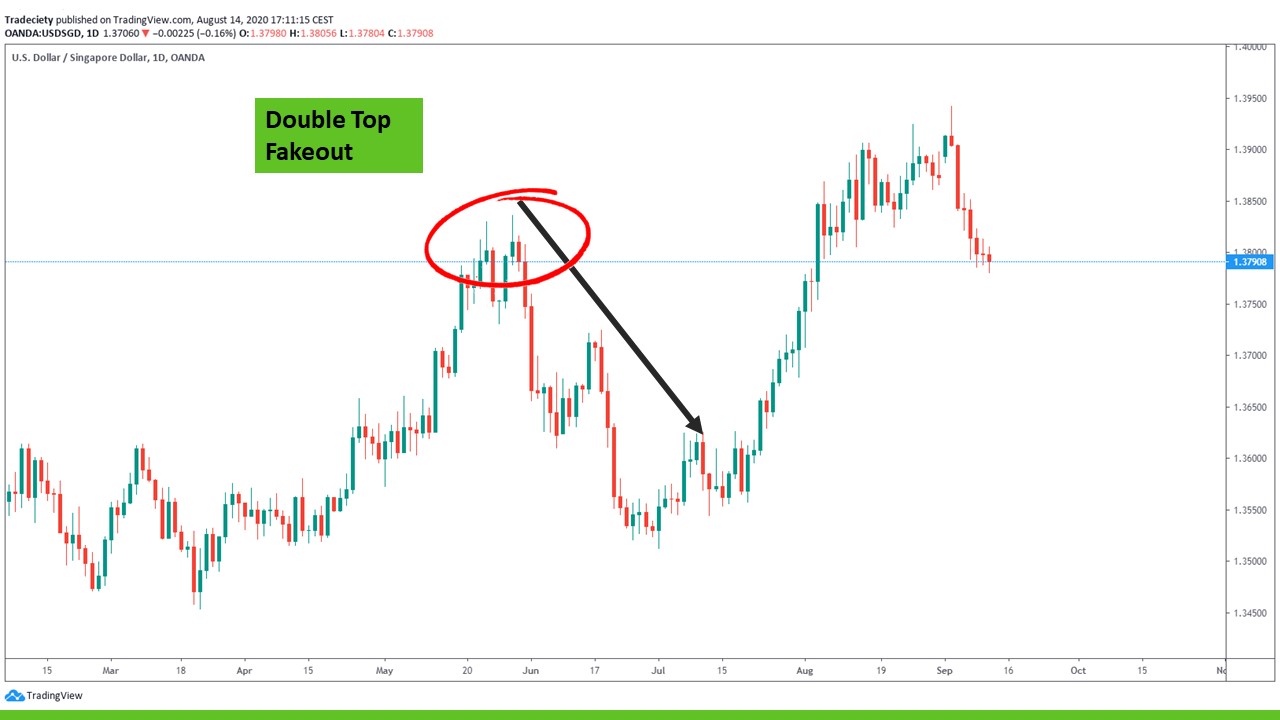
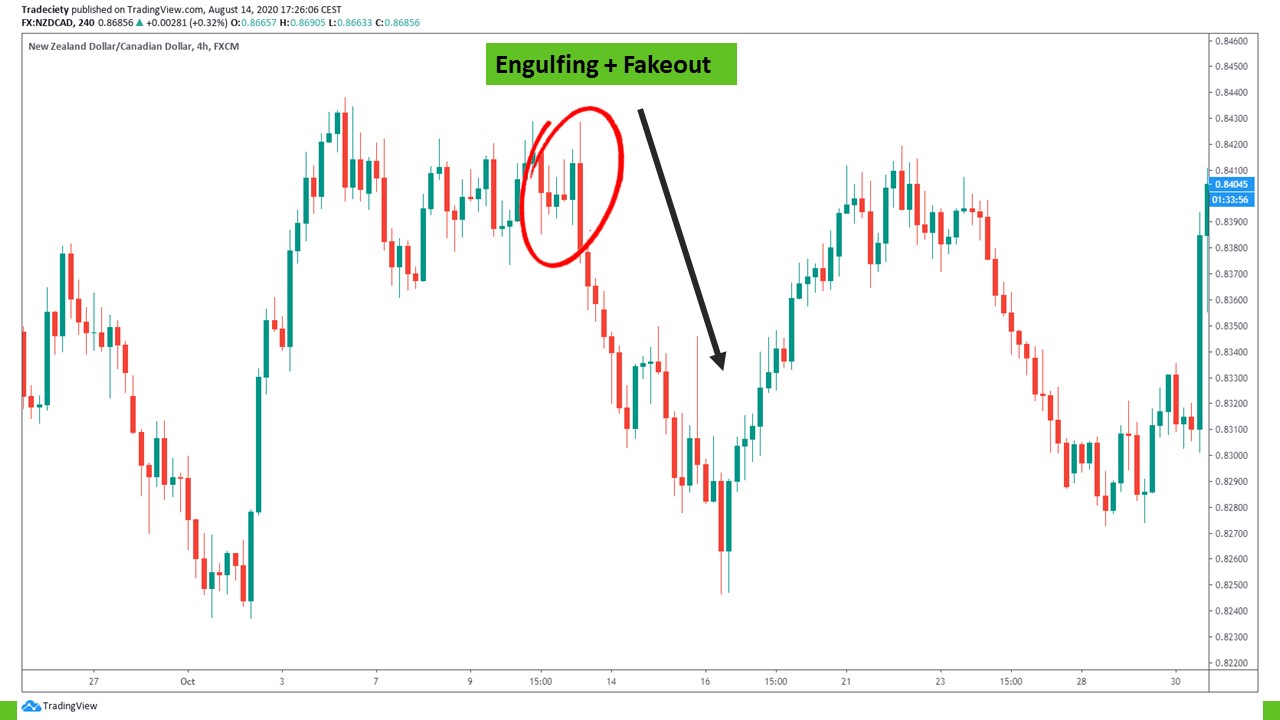
The fakeout pattern is also often referred to as a trap candlestick pattern but the idea is the same.
In the example below, the uptrend made a local high initially and during the next attempt to continue the trend, the price failed to reach a higher high. The price was immediately rejected as soon as it reached the previous high.
This pattern is a clear indication that the prevailing trend is likely to be over because the buyers lack the power to continue making higher highs.
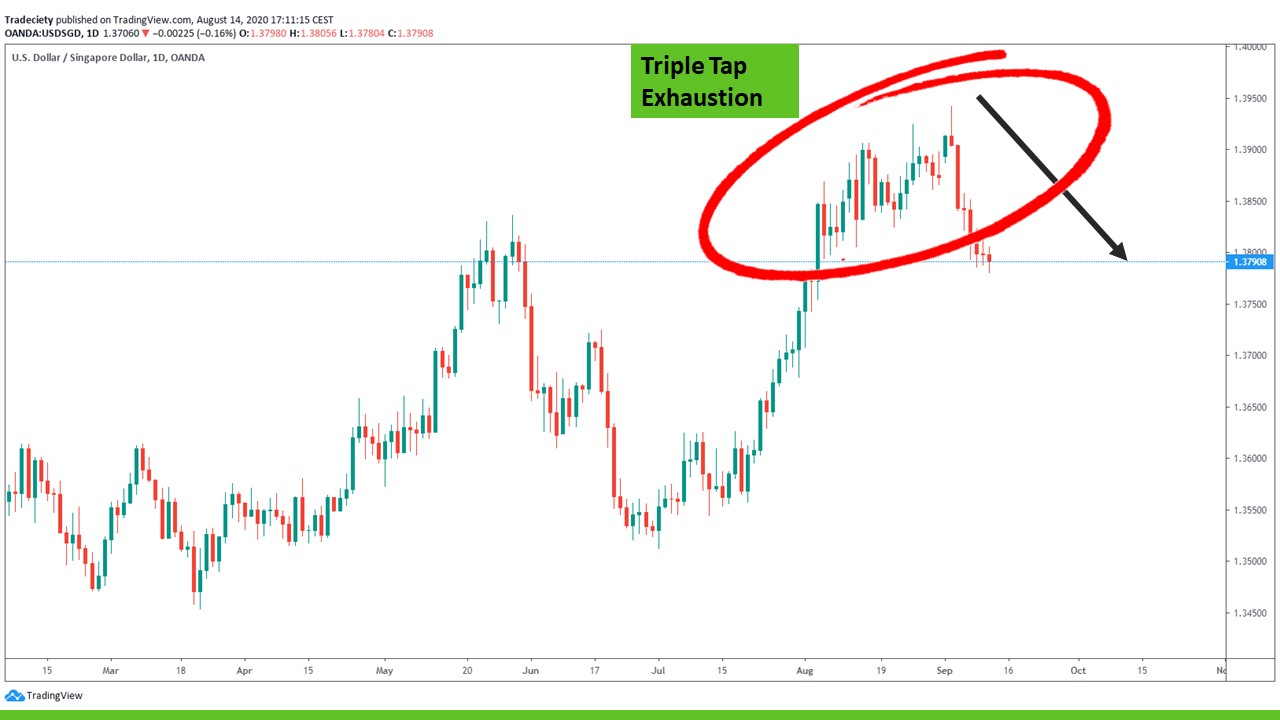
The triple tap is a powerful reversal pattern as it indicates a loss in trend momentum.
The price in the screenshot below made three weak higher highs after an extended uptrend. Each push at the top become less strong, the size of the wicks had increased and the candle size decreased. All those confluence factors indicate that the trend may be losing momentum.
The triple tap, like all other reversal patterns, is best traded during/after extended trends. The longer a trend goes on, the higher the likelihood of seeing a reversal.
Did I say that the engulfing pattern is extremely versatile?
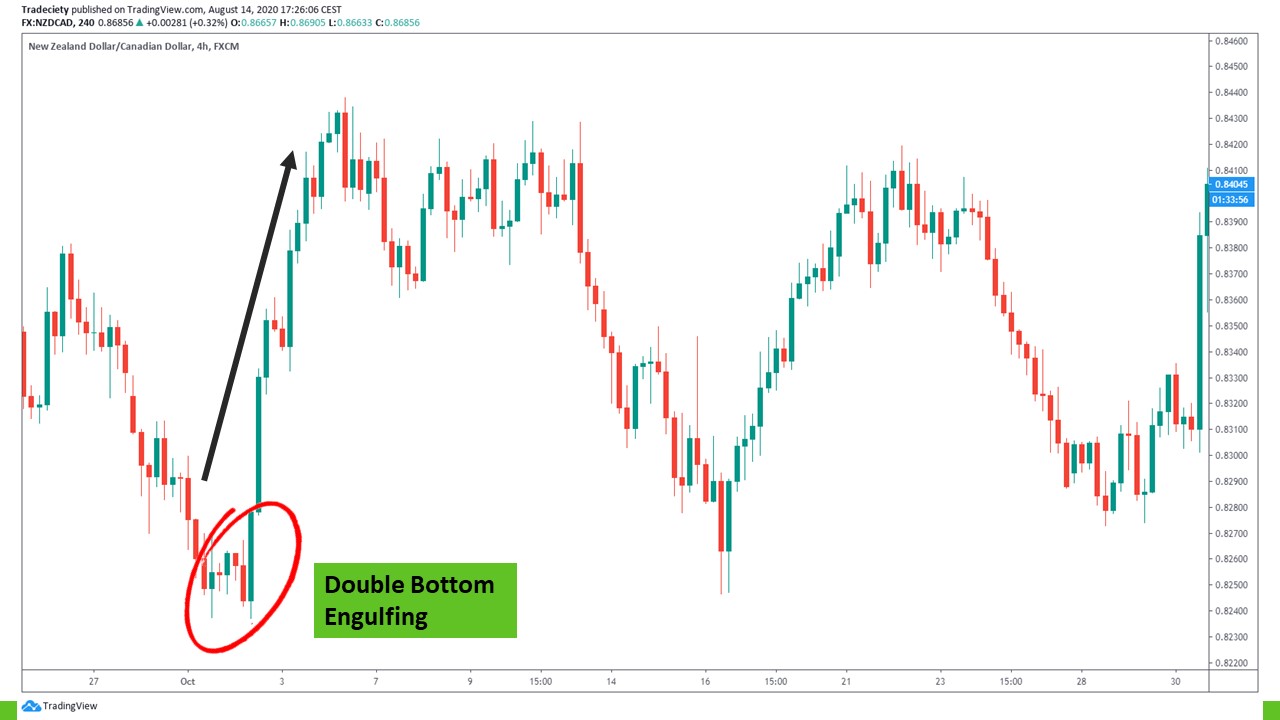
Whenever you see a double bottom after/during an extended trend, it indicates a loss of trend momentum. The sellers, in the scenario below, were not strong enough to continue the downtrend. The price was so low that it became increasingly interesting for the buyers.
The double bottom was finalized buy the large bullish engulfing candle. The significant size of the engulfing candle made this scenario even more powerful. Such huge momentum shifts indicate a significant change in the seller-buyer balance on your price action charts.
Did I say that the engulfing pattern is extremely versatile?
In the chart study below, the engulfing candle also showed the characteristics of a fakeout. The price was in a sideways consolidation and the breakout occurred with a large engulfing candlestick which also has a long wick to the upside. The wick indicates a failed attempt to move higher and the large bearish candlestick body shows that the buyers have withdrawn completely.
The engulfing candlestick is the largest bearish candlestick that was observable up until this point.
A tweezer candlestick pattern is made up of two candlesticks with equally long wicks. The tweezer indicates a move in the opposite direction of the candlestick wicks.
In the example below, the tweezer occurred at a key price level too. When you look to the left, you can see that the last bullish trend was initiated right at the tweezer price level too. Such trend origin levels often provide great trend-trading opportunities if enough confluence factors are present.
The tweezer also occurred after an extended downtrend – making the bullish reversal even more likely. Thus, you can see how we can stack multiple confluence factors in our favor.

Did I say that the engulfing pattern is extremely versatile?
I mentioned a few times that the more confluence factors you can stack in your favor, the better your price prediction usually becomes. In this chart study, we have multiple confluence factors that indicated the potential end of the bullish trend and a bearish reversal.
All signs were pointing towards the end of the uptrend. Once you identify the confluence factors, you may go to a lower timeframe to time your entry in the direction of the potentially upcoming downtrend.
Once again, we can stack the confluence factors in our favor to end up with a powerful price analysis.
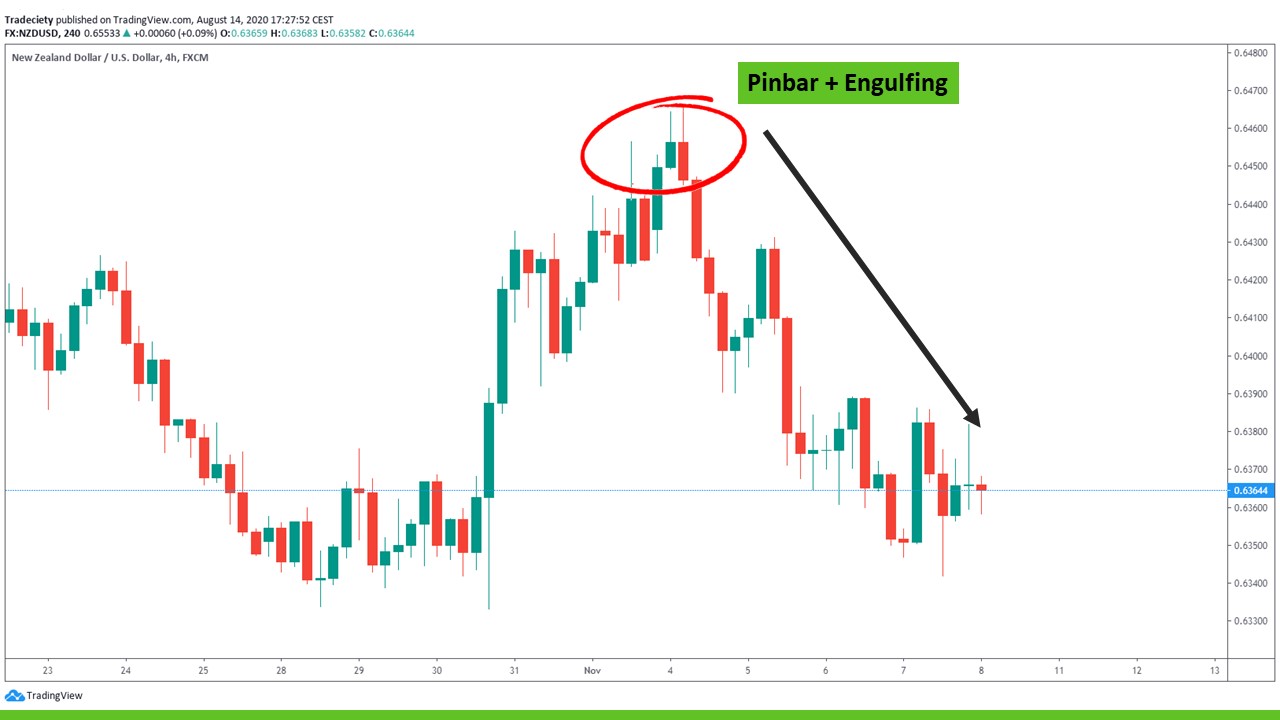
The chart was in a strong uptrend on the left. But the second trend wave was much shorter than the first one. Any momentum indicator will signal a divergence.
The bullish candles decrease in size before the price printed a pinbar with a long wick. The long wick is a strong reversal signal. Following the pinbar, a large bearish candle occurred. This pattern indicates the deceleration of the uptrend and then the acceleration of the new downtrend.
Let’s end with an engulfing candlestick pattern, shall we?
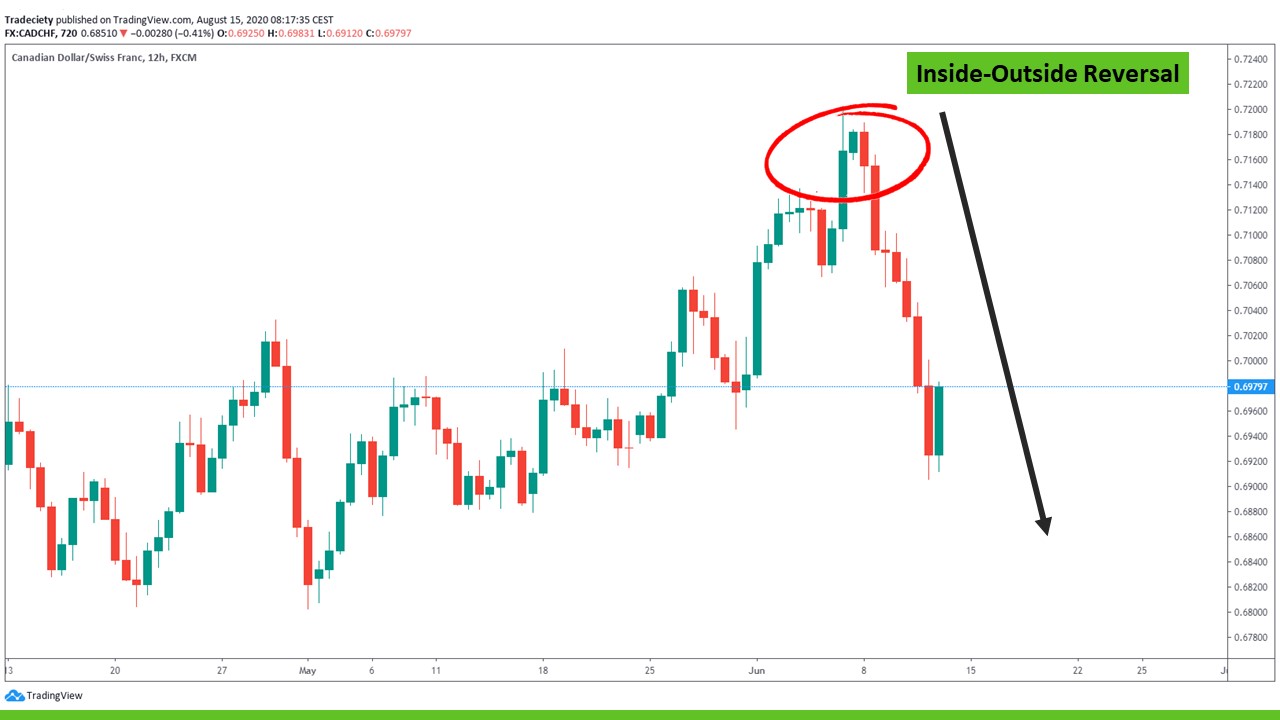
Just as in the example above, the price was in a weakening uptrend. The trend wave leading into the final top was significantly shorter than the prior trend waves.
At the top, the price first made an extremely large bullish candlestick. However, the next candlestick was only a short inside candle which indicates stopping momentum. This is not enough to say that the trend may end but it’s another confluence factor.
After the inside candle, the next candle was an engulfing candlestick, showing newfound interest from the sellers in the market.
Candlesticks can provide a lot of important information about what is going on on your charts. But trading candlesticks alone is not recommended because the predictive power may not be high enough.
Stacking multiple confluence factors on top of each other to come up with a strong price analysis may improve the odds of finding the right trend direction significantly.
When it comes to confluence factors, let me summarize the most important ones once again:
external link:


We have been trading supply and demand strategies for over ten years, and they have stood the test of time remarkably well. Supply and demand is...

3 min read
Choosing the right trading journal is essential for traders wanting to analyze performance, refine strategies, and improve consistency. In this...

3 min read
“95% of all traders fail” is the most commonly used trading related statistic around the internet. But no research paper exists that proves this...