3 min read
Scientist Discovered Why Most Traders Lose Money – 24 Surprising Statistics
“95% of all traders fail” is the most commonly used trading related statistic around the internet. But no research paper exists that proves this...
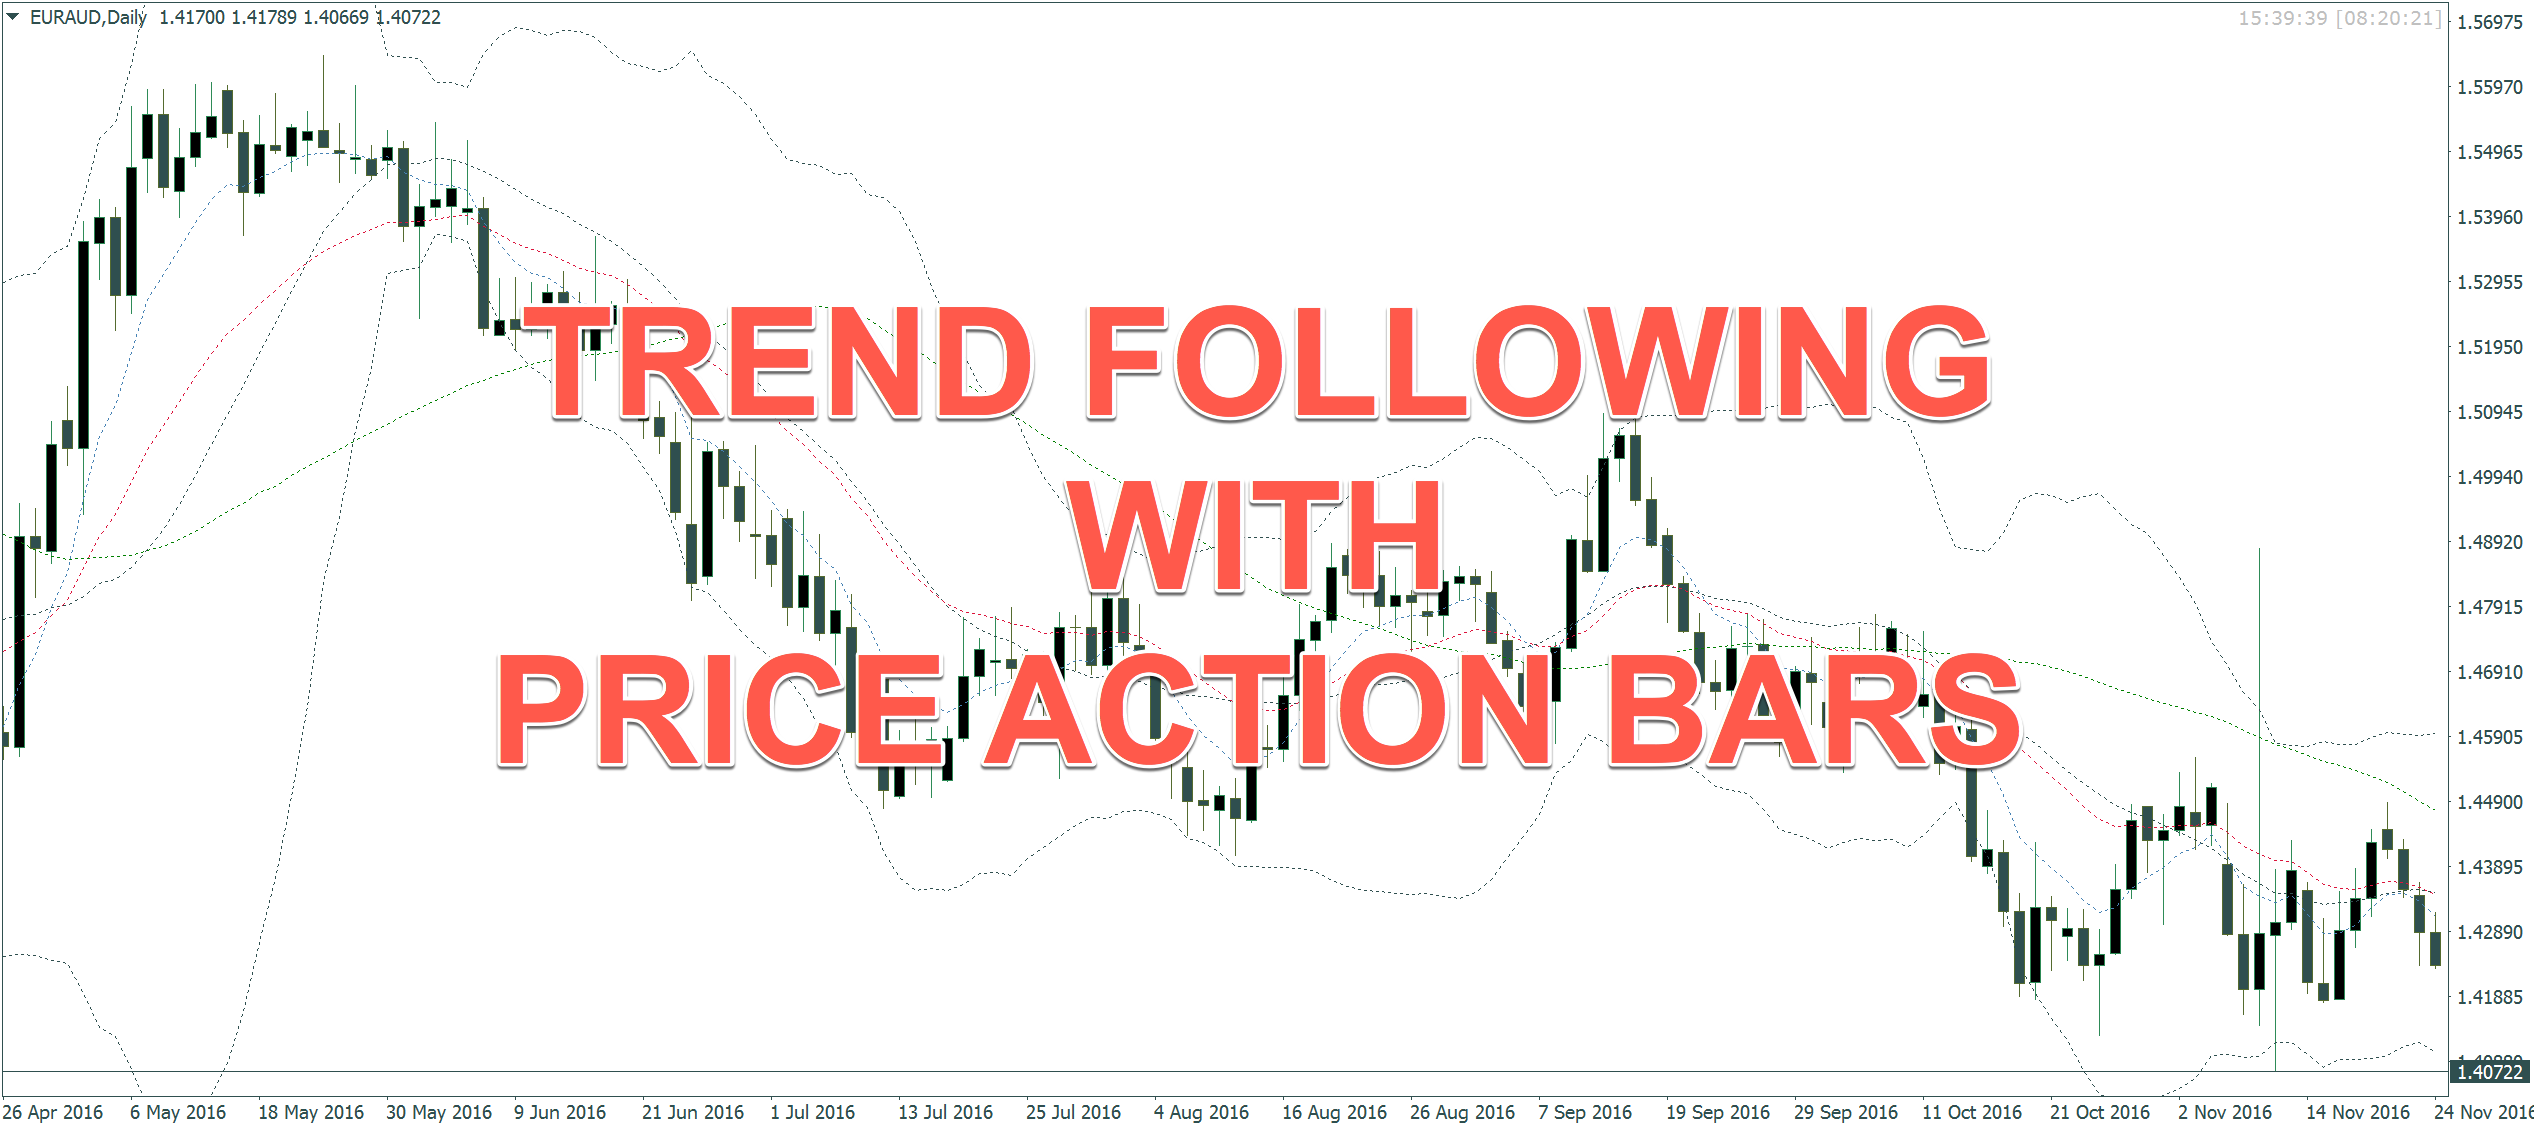
I have written about my higher timeframe price action trendfollowing strategy before, and many times was asked to elaborate a bit further on it, so today I will do just that. I trade this strategy on the 4-Hour, Daily, Weekly and Monthly Charts and, as always, mostly with the trend, sometimes there are setups in ranges or in reversals as well. My chart setup looks like this…
More: Learn our complete trading strategies
I use Bollinger Bands® with a SMA period of 20 and a Deviation of 2.5, like Rolf, plus the 50 SMA and the 10 and 20 EMA’s for trend direction. Then I trade pullbacks back into the trend with price action. Very simple and straight forward. The Take Profit is in 90% of cases the last swing low in a downtrend or the last swing high in an uptrend. I typically have a Reward:Risk between 2:1 and 5:1 and average around 2 trades a week.
I use various entry techniques on classic Price Action bars in order to ensure a competitive RRR and always have my stop behind the Price Action bars. I also occasionally will trade ranges or reversals if the conditions are right.
When I find trades on the H4, I will play them Set&Forget. When I find trades on the Daily, Weekly or Monthly charts, I typically scale in utilizing techniques on the next-lower timeframe.
The Price Action bars I use are pin bars, outside bars, inside bars and two-bar reversals. Additionally, I utilize Support & Resistance, Trendlines, Fibonacci ratios and Head & Shoulders (no other patterns).
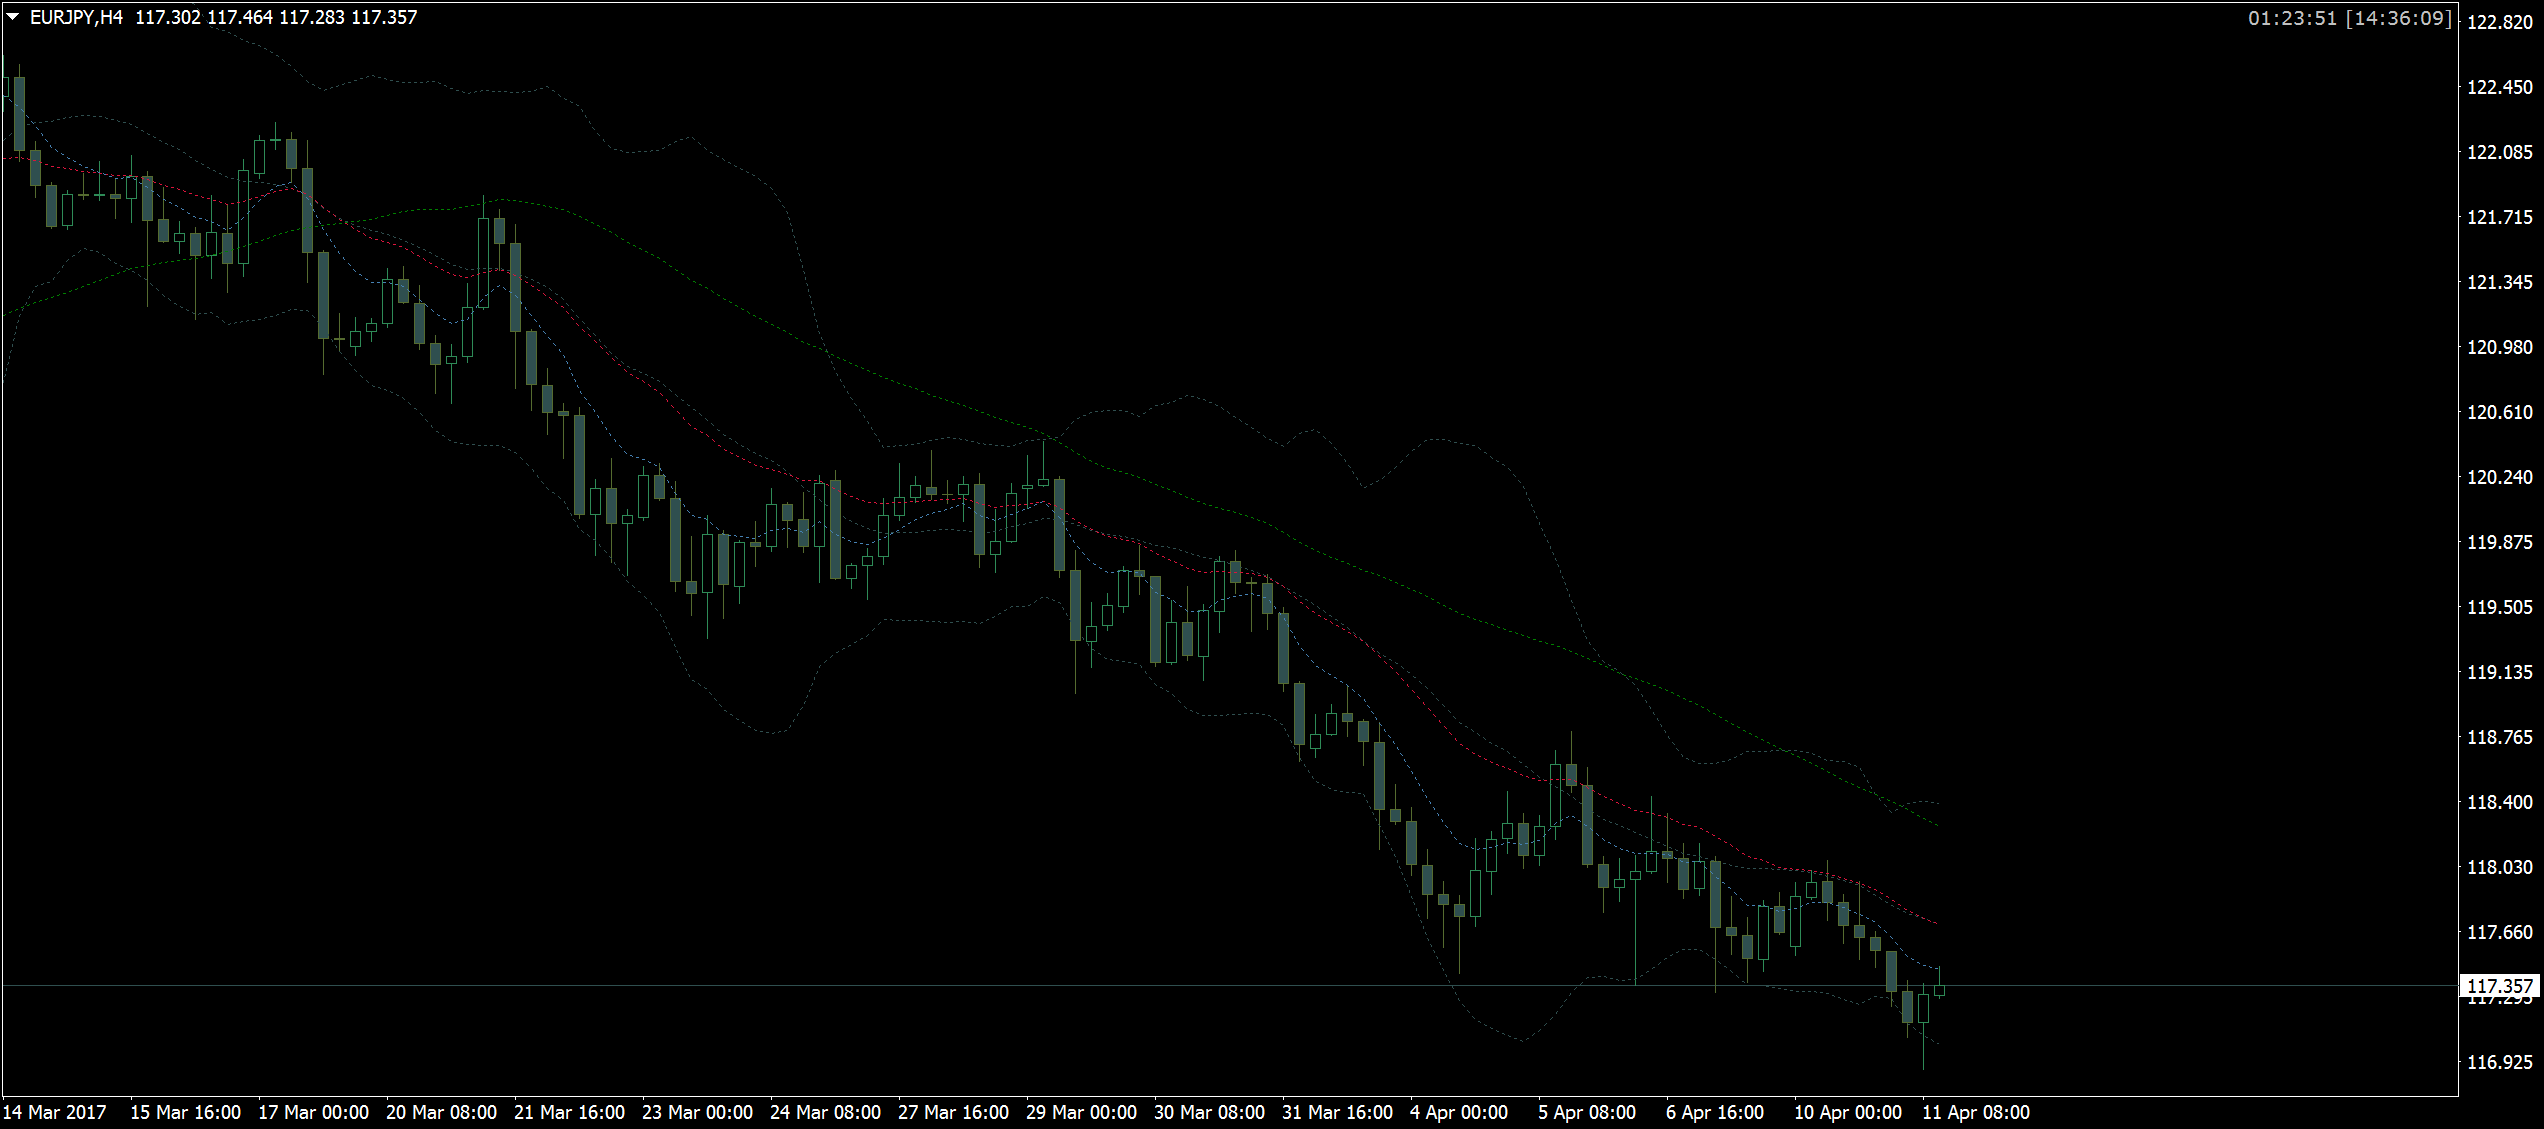
Here are a few example entries from the chart above, the EURJPY, which is trending nicely at the moment.
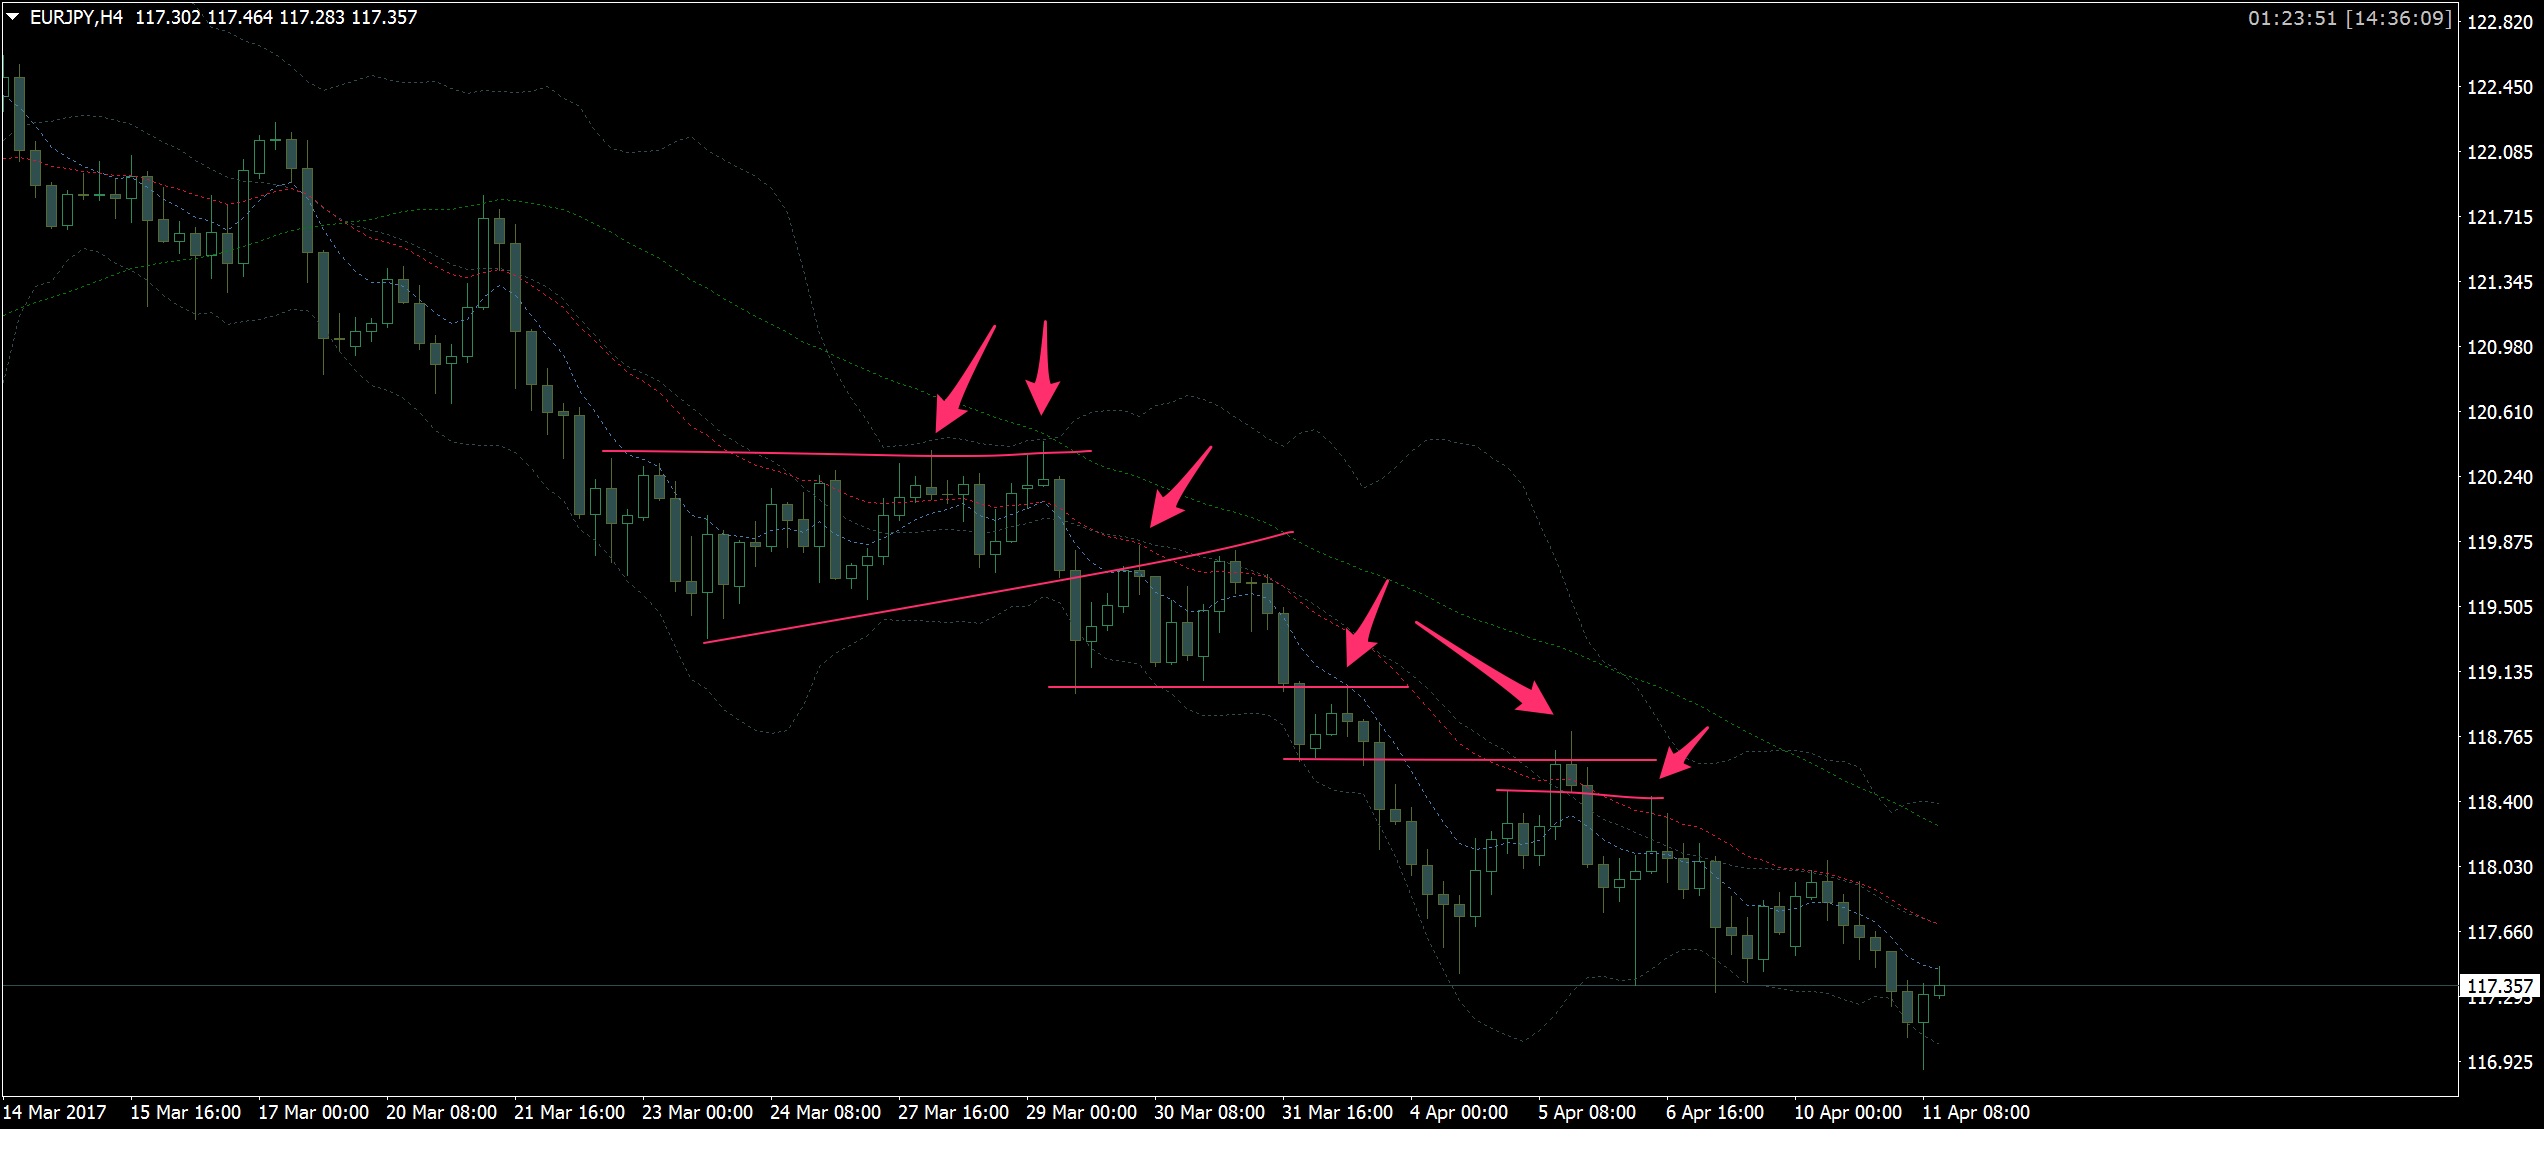
Those are all Pin bar trend continuation trades (Break & Retests). With the right techniques, these would produce a solid 2R or more per trade, playing them solely Set & Forget with a mechanical break-even rule.
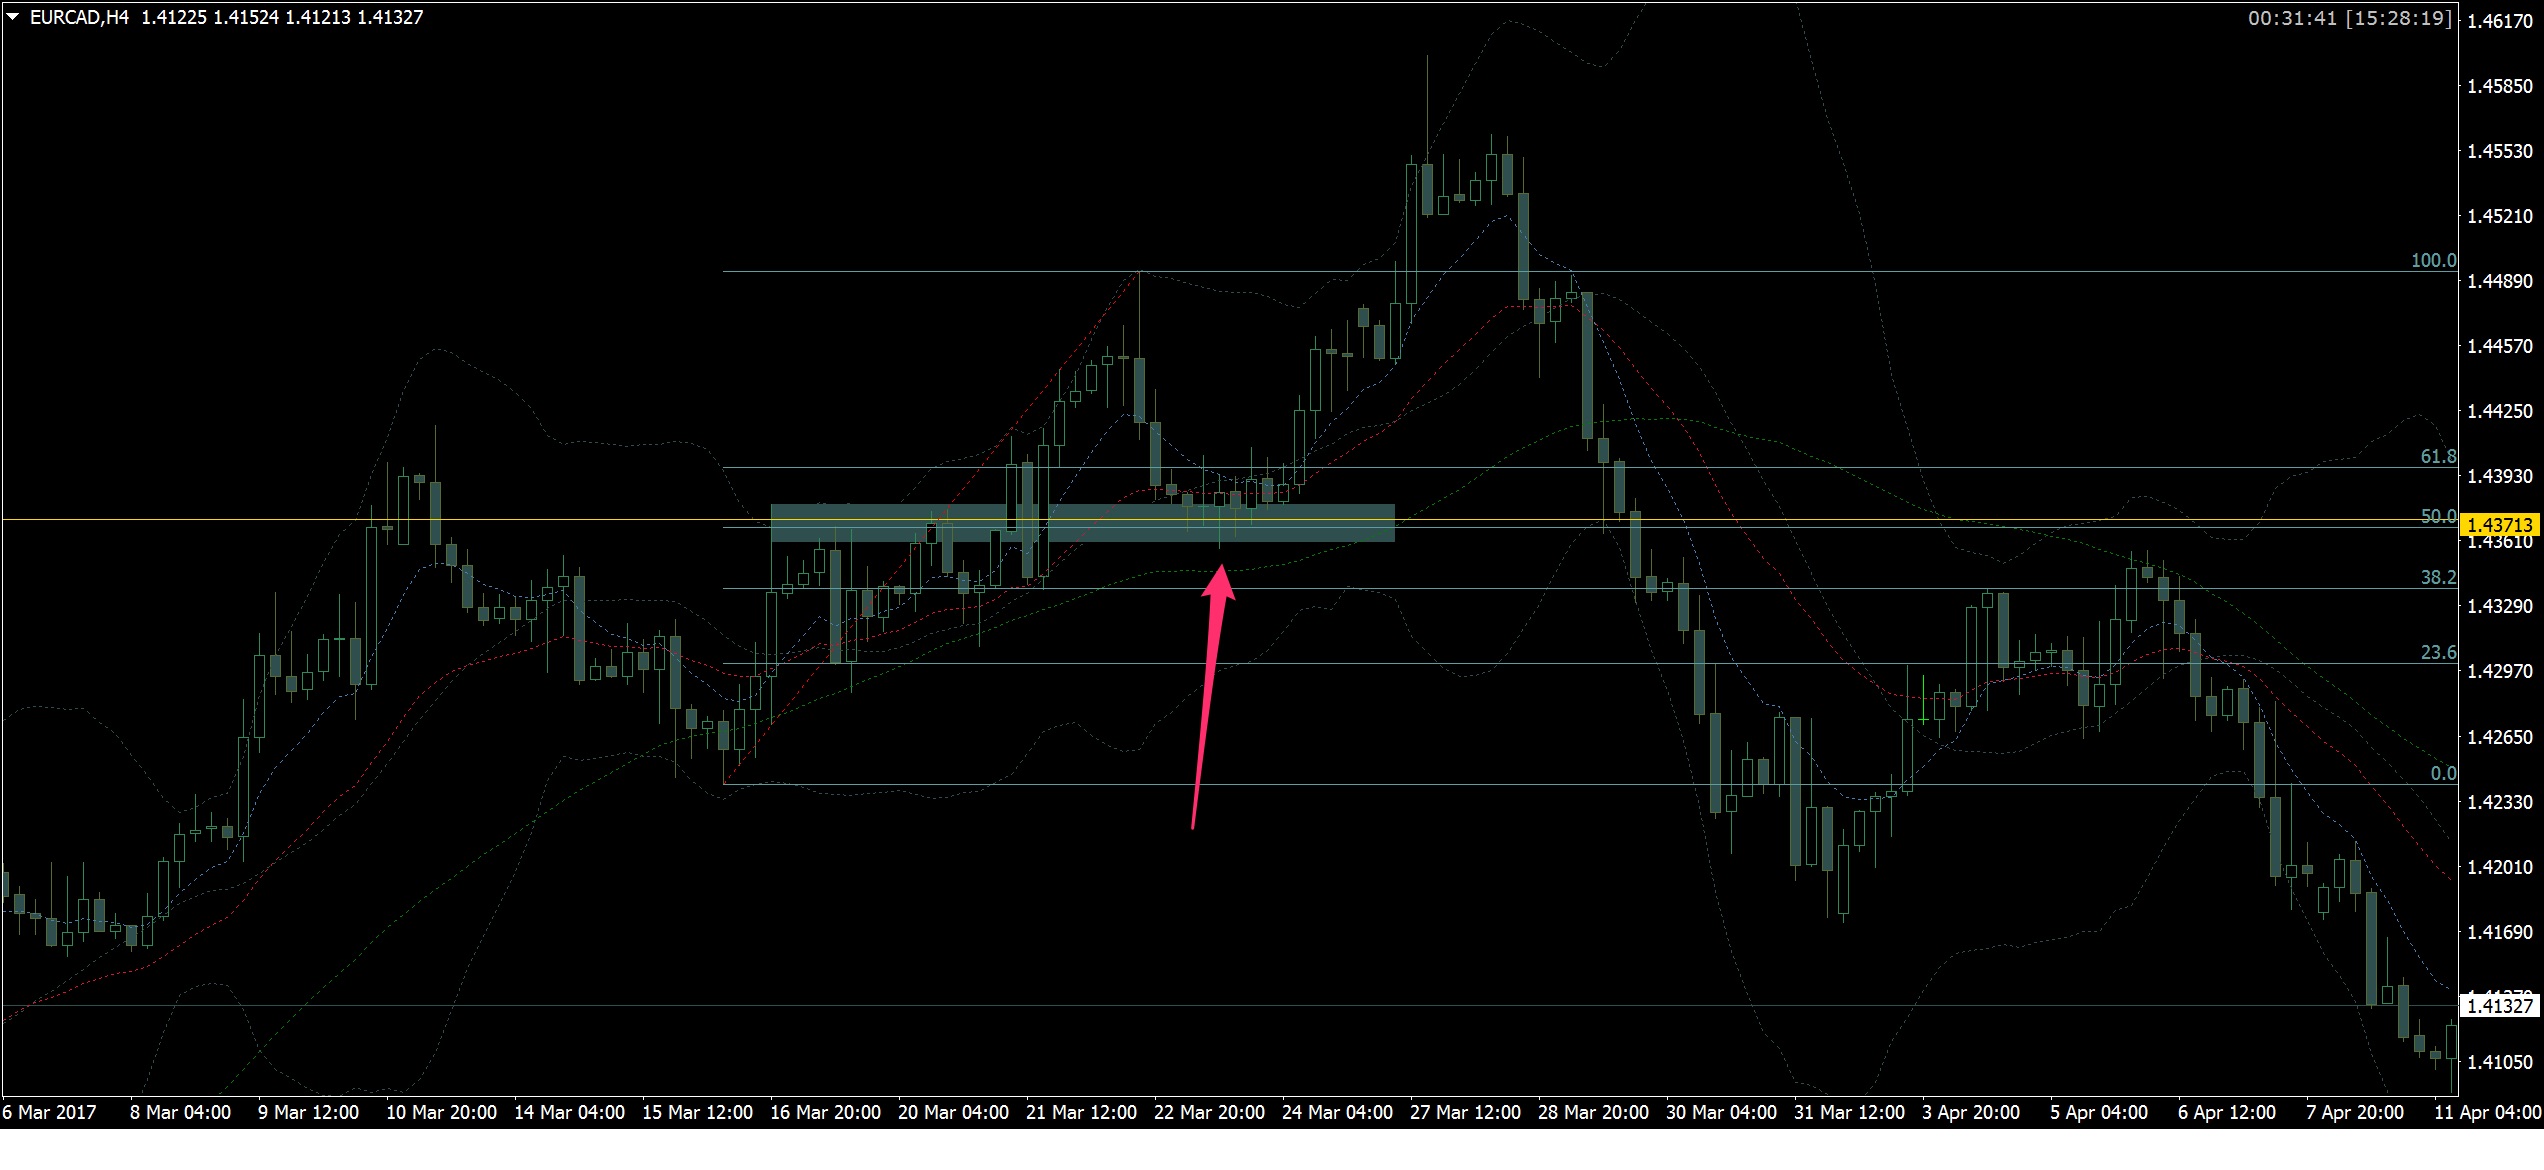
And here is one of those entries I love a lot, a cluster of S/R, 50% Fibonacci and pin bars and a succession of inside bars. This gave me an easy 5R.
The Bollinger Bands® I use as a visual guide to where the price cycle is at the moment. Typically, pullback trades from around the middle of the BB are simply the best.
The beauty is the simplicity of this strategy, all you need is patience and due diligence to check 60 charts every 4 hours, or however many instruments you want to trade. Flipping through all of them and scribbling down notes takes me around 5 minutes every 4 hours so the effort is absolutely ok. Besides, I could always choose to only trade this on the Daily or higher time frames and have an even more relaxed trading routine. For me, the perfect add-on to my daytrading – besides, whenever I see entries on the H4, I will very often also be able to find entries on the M5 – of course, then I’ll rather trade my M5 strategy, because of the increased RRR. More on how to scale in, how to manage risk on multiple positions, etc. in later articles and on Youtube in future videos.
Also, check out this video I recently recorded on one of the setups.


external link:


3 min read
“95% of all traders fail” is the most commonly used trading related statistic around the internet. But no research paper exists that proves this...

3 min read
Trendlines can be great trading tools if used correctly and in this post, I am going to share three powerful trendline strategies with you.

3 min read
Choosing the right trading journal is essential for traders wanting to analyze performance, refine strategies, and improve consistency. In this...