3 min read
Scientist Discovered Why Most Traders Lose Money – 24 Surprising Statistics
“95% of all traders fail” is the most commonly used trading related statistic around the internet. But no research paper exists that proves this...
Why do prices behave so differently around support and resistance levels? If you have been trading for a while you know that price behavior around a support and resistance levels is never the same and we are going to take a look at why this is so.
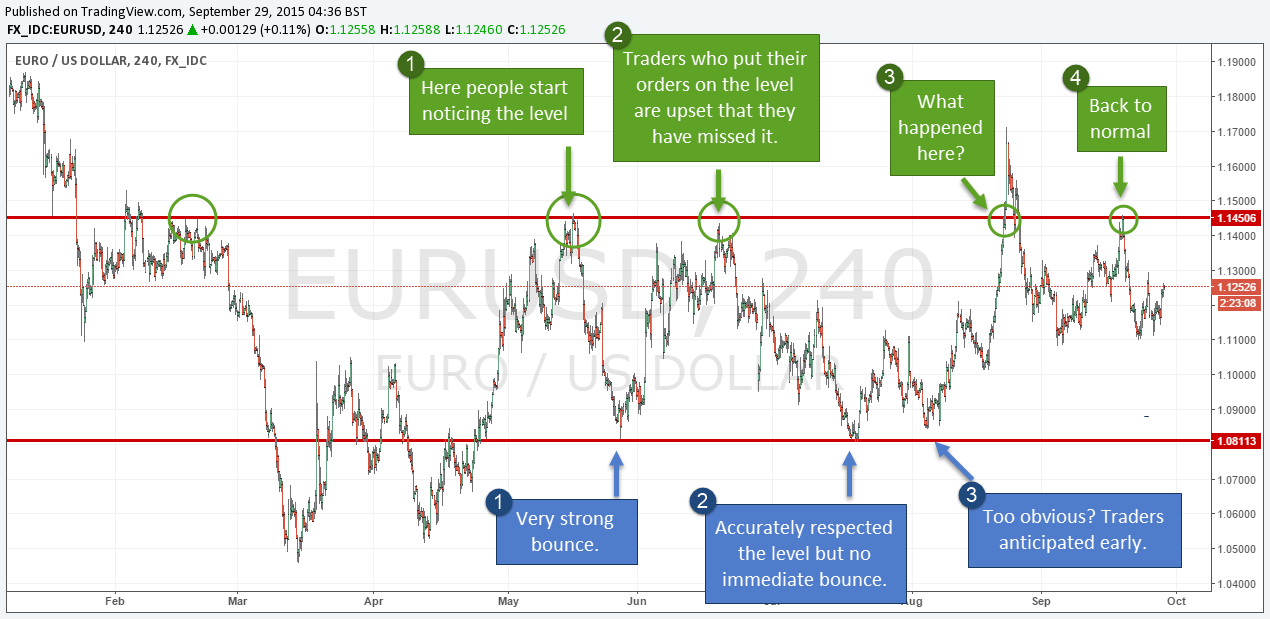
The chart below perfectly illustrates why support and resistance trading can be so challenging. Lets’ first take a look at the upper resistance level and the green comments.
At point 1, price makes a swing high and sells off sharply afterwards. This is when most trades will start noticing the level and they are prepared to sell when price comes back. At point 2, price is approaching the level again but turns ahead of the line. Many traders have missed this entry and are probably very frustrated – you can be sure that next time price comes back, they will enter more aggressively. Sure enough, price breaks through the resistance level at point 3 and all the traders that have missed the entry at point 2 and who now entered early are caught on the wrong side. Interestingly enough, at point 4, price again respects the resistance level to the point – but this time most traders will not be interested anymore…and they will be frustrated again to see the resistance level would have “worked” again.
Now, let’s take a look at the support level and the blue comments. At point 1 price made a swing low followed by a very strong rally. At point 2, traders probably expect a similar reaction – but this time, price hovered around the level for some time before going higher. Again, such a price behavior will rattle off many novice and inexperienced traders. At point 3, price didn’t reach the level and started rallying early, causing frustration among the traders who did not catch a trade entry.

This, if course, is subject to speculation and personal opinions but you can also apply some common sense to it. First, remember that all books and websites about technical analysis teach you that a support or resistance level becomes “better” the more price touched it. But, is this really the case? Wouldn’t it make more sense to say that the more obvious a price level is, the more likely is it that the majority of retail traders all are going to have the same trade idea?
A more plausible way of looking at support and resistance is that the more obvious a price level is, the easier it is to know what the average trader is going to do. Of course, the professionals know what the amateurs think and so they can drive price in ways to take advantage of the amateurs.
There is another area where this concept applies: what you identify as stop hunting is often just a way of placing stop loss orders at levels that are too obvious. Is it really so hard to guess that you are just placing your stop on the other side of a swing high or above a famous moving average?
This article does not have the purpose to demotivate you, but to awaken your awareness and to sharpen your mind for clues which you haven’t seen yet. “If it seems too good to be true… it probably is.” is a quote which often applies to trading.
Further reading: The reason why support and resistance isn’t working for you.


external link:


3 min read
“95% of all traders fail” is the most commonly used trading related statistic around the internet. But no research paper exists that proves this...

3 min read
Trendlines can be great trading tools if used correctly and in this post, I am going to share three powerful trendline strategies with you.

3 min read
Choosing the right trading journal is essential for traders wanting to analyze performance, refine strategies, and improve consistency. In this...