Supply and Demand Trading in 2026
We have been trading supply and demand strategies for over ten years, and they have stood the test of time remarkably well. Supply and demand is...
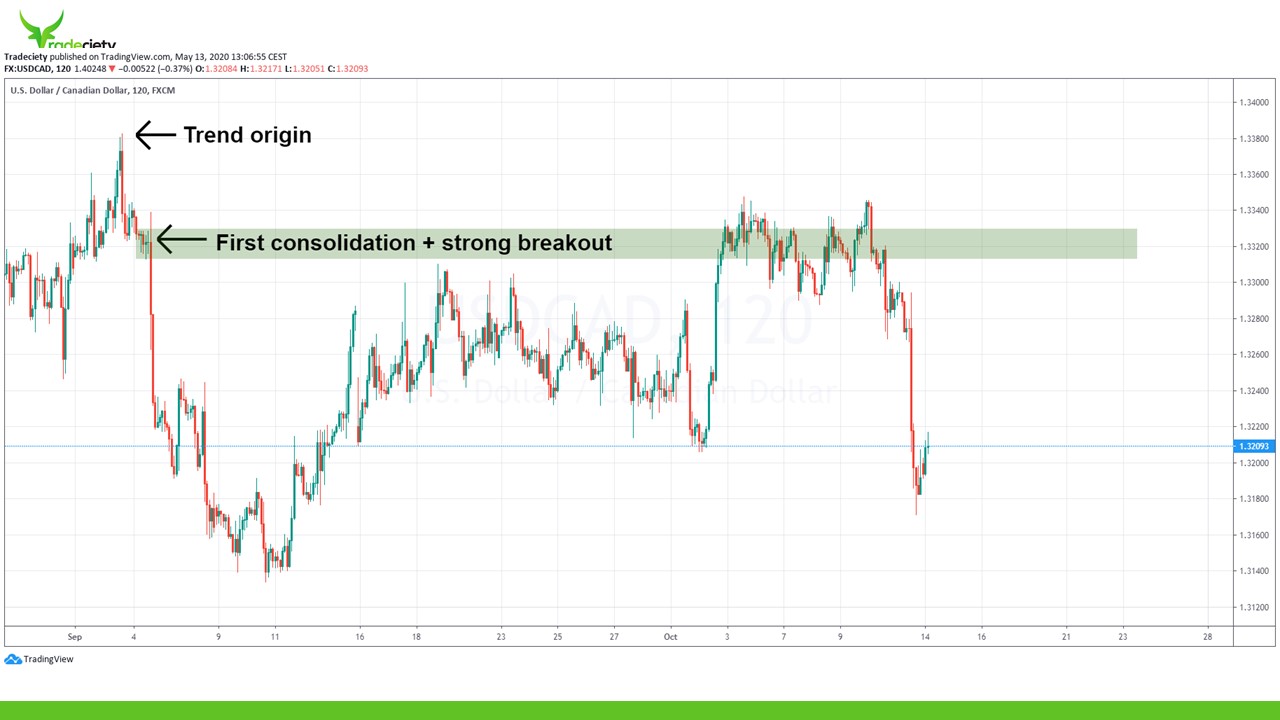
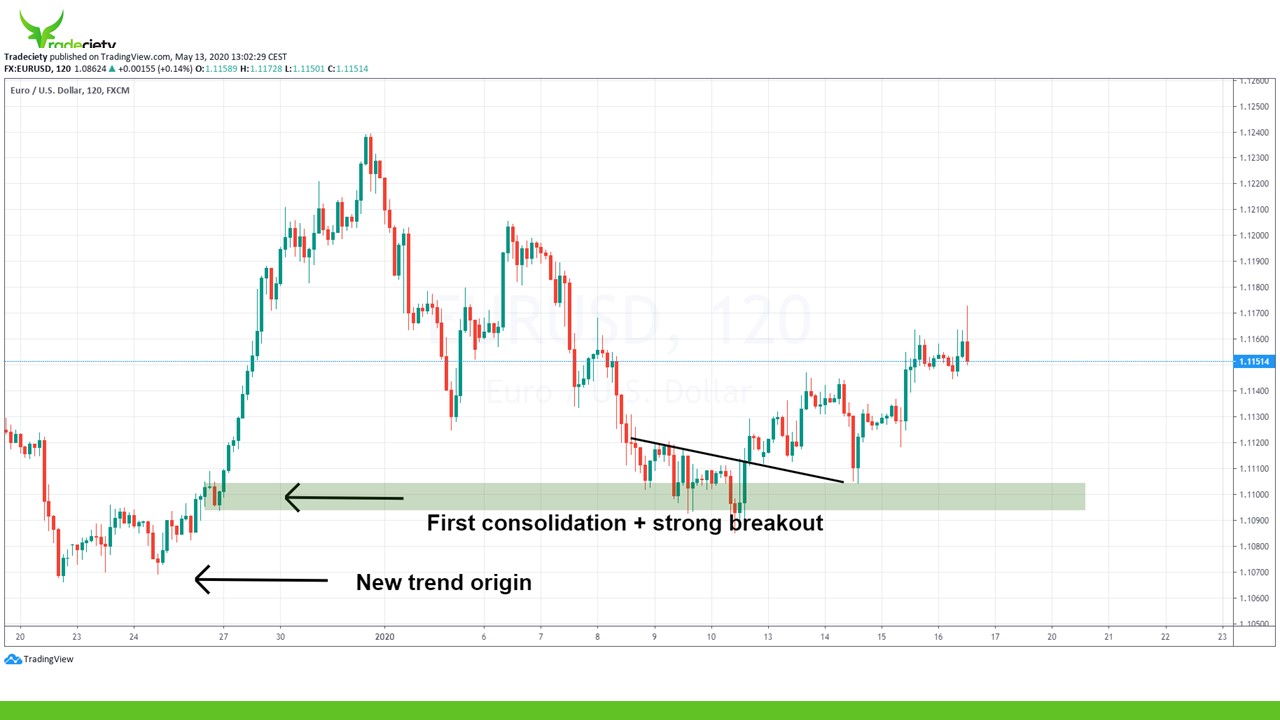
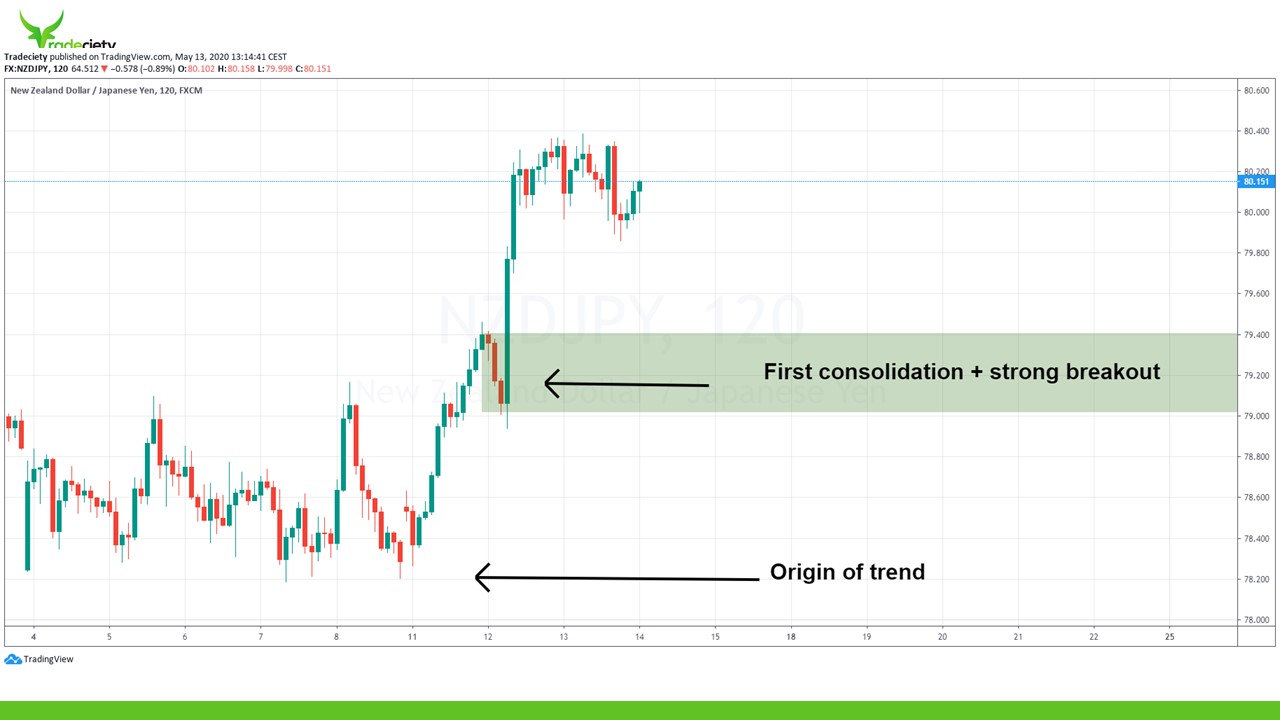
I compiled a few very, very interesting chart studies that will help you understand supply and demand zones and find them in your own trading. So, when it comes to finding supply and demand areas, I use a very, very straightforward approach. And what I do is I look for strong trending moves and the trend really has to be very, very strong. This is the first criteria. The second criteria is that a little bit, and this happens very often, a little bit away from the top or the bottom um, on the bottom, when we look for an uptrend, as we will see later on, usually there’s often a small first consolidation happening. This is very, very common market behavior. So you have the origin and you have the top of the trend or the top of the price move,
(01:11):
then you have an initial small move. You have a consolidation and then a very, very strong breakout away from the consolidation. And in here is then your supply and demand area. You have usually one, two, three, sometimes four or five, but not really more small candlesticks that describe your consolidation. You don’t want that. The candlesticks are showing you a large volatility. So usually the candlesticks during the consolidation are, are fairly small and then you have a very strong breakout. And it’s really, really important that the breakout away from the consolidation happens with strong candles, big candles, and they initiate a new and a very, very strong trending phase. So those are the criteria, the main criteria that will help you identify a supply and demand areas. There are a few different use cases as we will see later during the video. But this will help you already in your own trading.
(02:10):
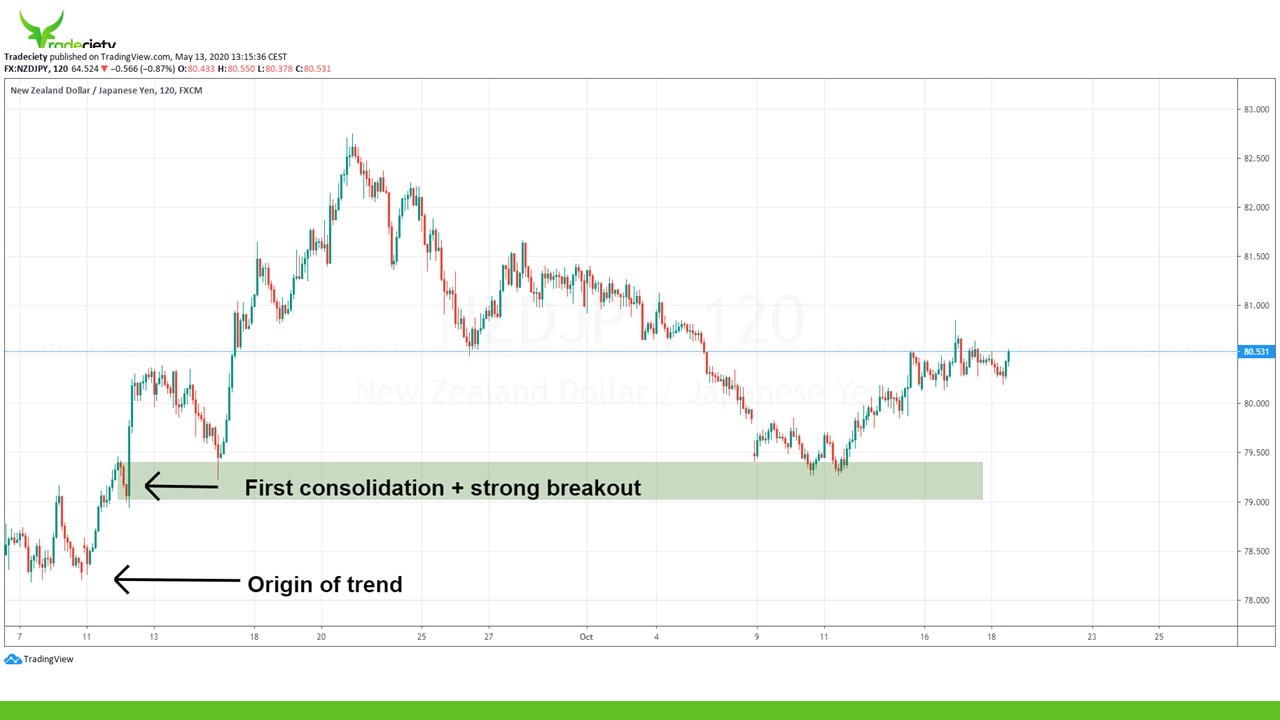
And what you then do is you wait for the market to come back into the, into the supply and demand area and then you wait for the market to give you some type of pattern. Could be a price pattern, could be anything really that shows that the market is moving into the level, giving you a sign of exhaustion and then starting a new downtrend. So this is what happened on this example. This is the supply and demand area that we marked in the previous slide. Very strong move away and then the market comes back into the level here, very, very precisely, picks up new selling momentum and then sells off. So this is a tweezer pattern, on the lower timeframes. This may look like an engulfing or an inside bar strategy and you can use it in many, many different ways.
(02:54):
What is really important is that you don’t trade a supply and demand area blindly because sometimes the market will just blow through the level and not pay any attention to it. So you really want to make sure that when the price gets there, you wait for some type of confirmation, some type of pattern before you then initiate your trade. And you can see even before the market dips into the area, the market came close a few times to the supply and demand area and then the market sold off a few times even before that, even before it touched the level. And this happens quite often, there’s often a very strong force, a radiating around a supply and demand area. So sometimes the market will turn just a few points below this, um, or in, in, in advance, uh, ahead of this supply and demand level,
(03:41):
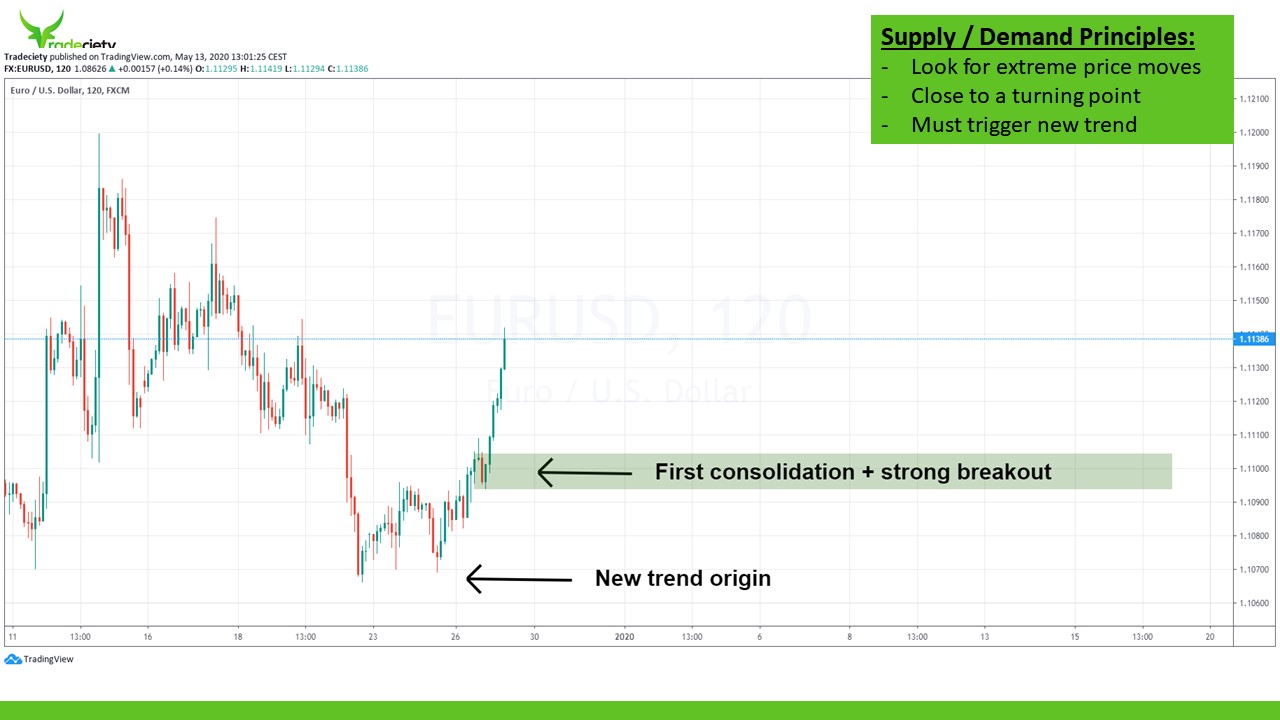
that’s something that’s really, really common. Here we have another example. We have the, the origin of the trend. So here’s the bottom. You have an initial small move and then you have a small consolidation. This consolidation is more or less just two candles, a small pin bar, a bearish candle, and then you have a strong breakout, you have a strong move away from the level. You can see one, two, three, four, five, six candles. Out of those six candles, five are very large and bullish. And so, this is our very, very powerful and very strong consolidation area that then um, is leading or is actually turning into a supply and demand area. So, and then the market, we wait for the price to get back to the level, give us some type of pattern and then we see how we could have traded this.
(04:27):
This is how it looks afterwards. So we have the origin of the trend. We have this small consolidation. The price really started a strong uptrend, which is a must-have criteria. The price comes back, gives you here this divergence pattern. So if you use a RSI or MACD or stochastic, you will see that this is a divergence. You have a very nice trend line, you have a breakout, then we have a pullback and then a new uptrend. So not always will the market dip into this level and just shoot higher away from it. That’s why it’s so important to have, um, a pattern structure around your, around the re-entry time. So the, the time or when the market re-enters to supply and demand area, you don’t blindly trade it with a limit order but you really wait for some type of signal and pattern to, to exist and to be created around the level.
(05:16):
Here another example, we have the trend of the origin. We have the first leg downwards and then the market completely dies down. We have a few consolidation candles and then you have this huge breakout candle, engulfs the previous one, two, three, four, five, six, seven candles with a huge candlestick. And then the next one is even uh, even a larger candlestick. So clearly this is showing you that something must have happened in this area to cause the price to really dump like this. So a very, very strong force must have entered here the market to absorb all the price or all the other orders. And then what you wait, is you wait just for the market to come back to the level. This is what happens afterwards. You can see the strong force around the zone radiated around the level, and then the market came close to it a few times, always kept selling off until here.
(06:09):
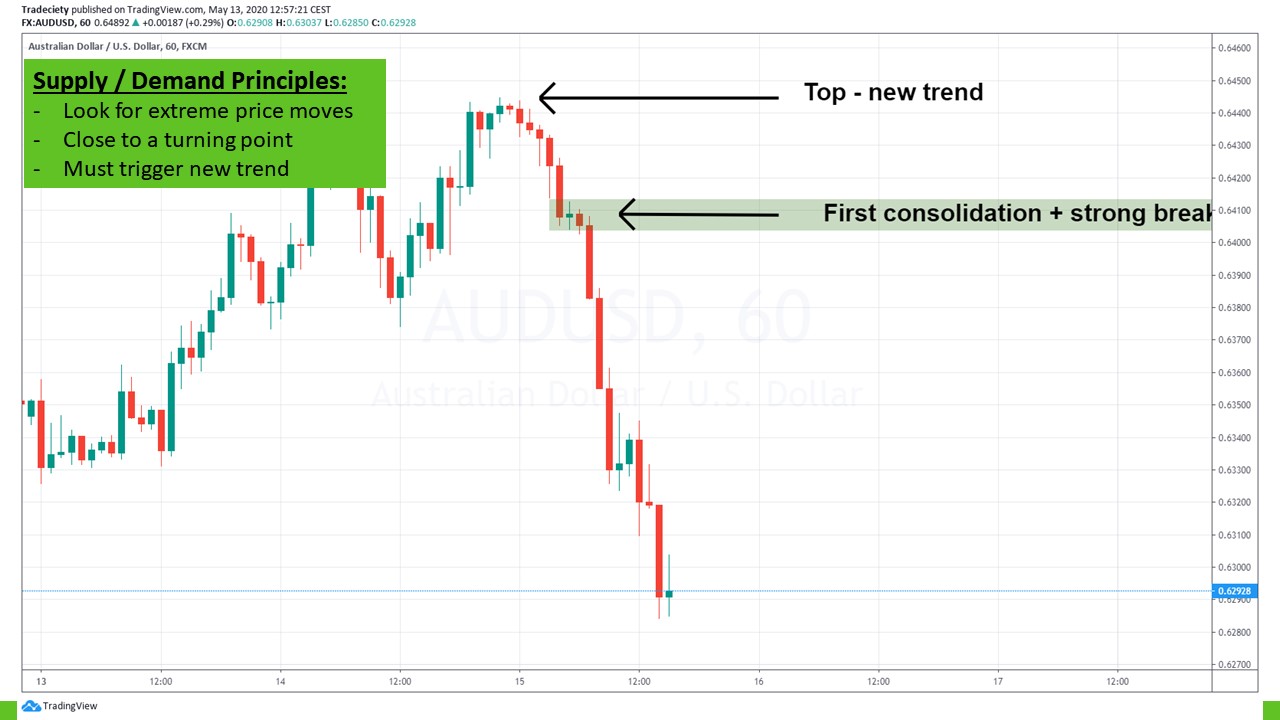
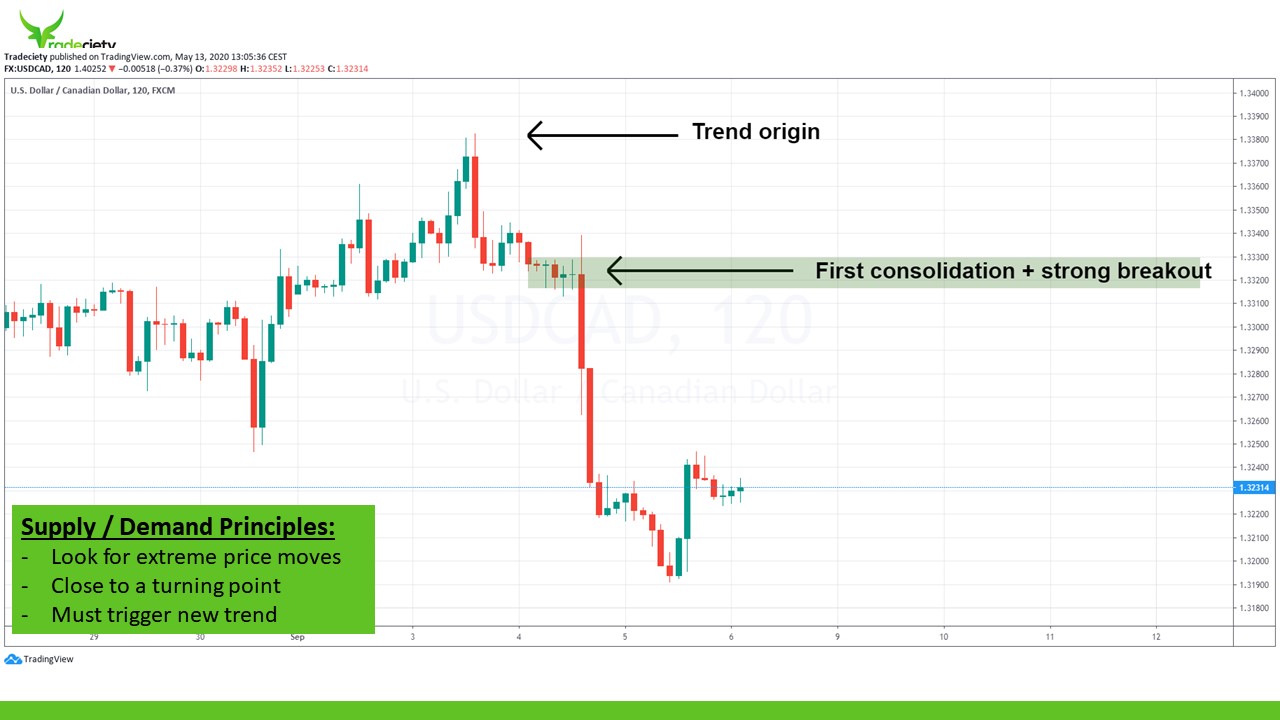
This is when the market fully traded back into the level. It overshot the area first and then here it started a new downtrend. So I can’t stress this enough that supply and demand areas are very, very powerful tools and concept that is really reliable, but you cannot trade it blindly. You must have other criteria around your supply and demand areas to just pick your trades in a better way. There’s, many different ways how you can find supply and demand areas in your trading. I showed you so far an approach where you look for the first consolidation in a new trend. Now we look at extreme price turning points, so we really want to see that something extreme has happened on, on the, on the charts, like in this example, the market traded downwards. This may have been news cost. It doesn’t really matter. The only thing that matters is that we are looking at something really, really extreme so you can see the bears pushed the price down and then within the same candle the market’s shot back up and you can see among probably how many candles do we have here?
(07:16):
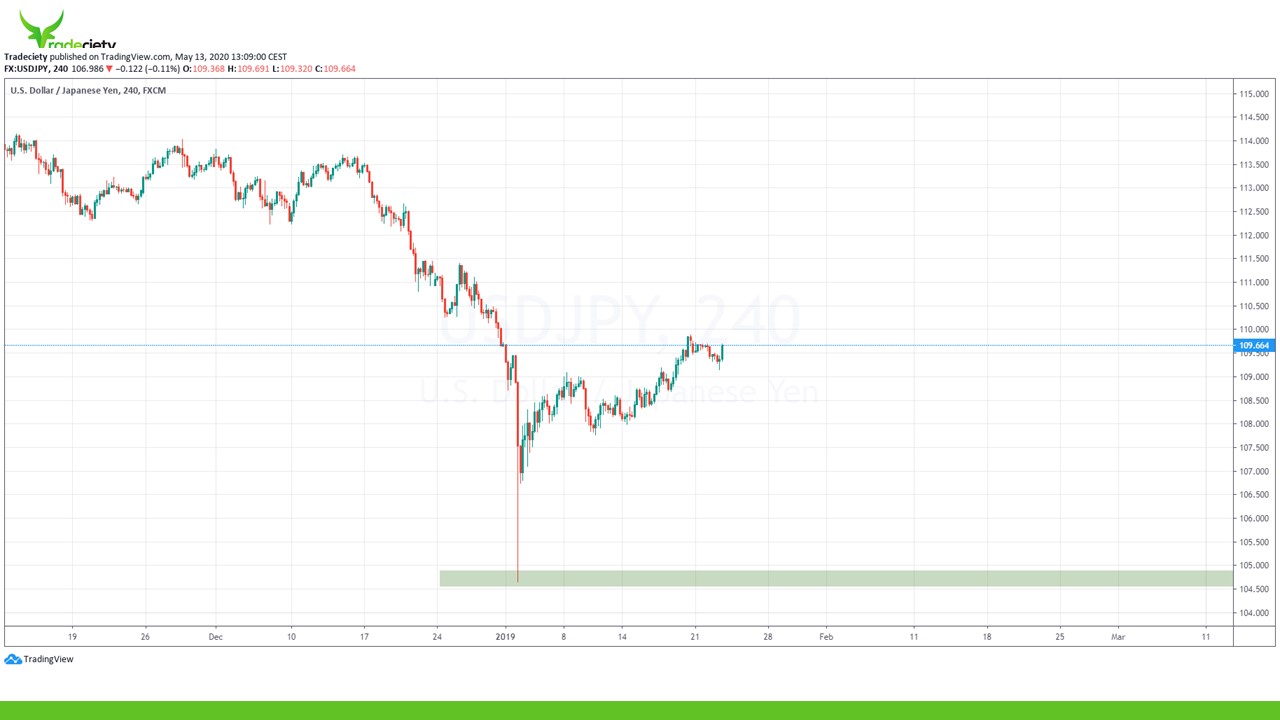
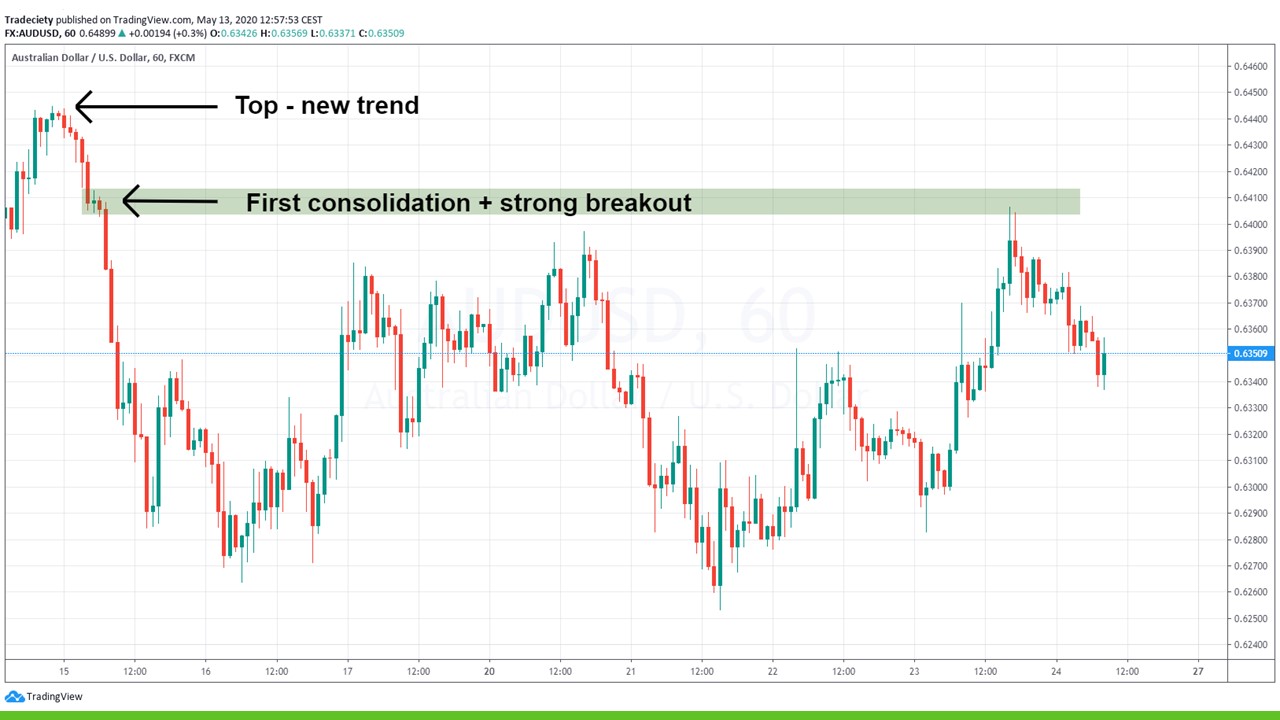
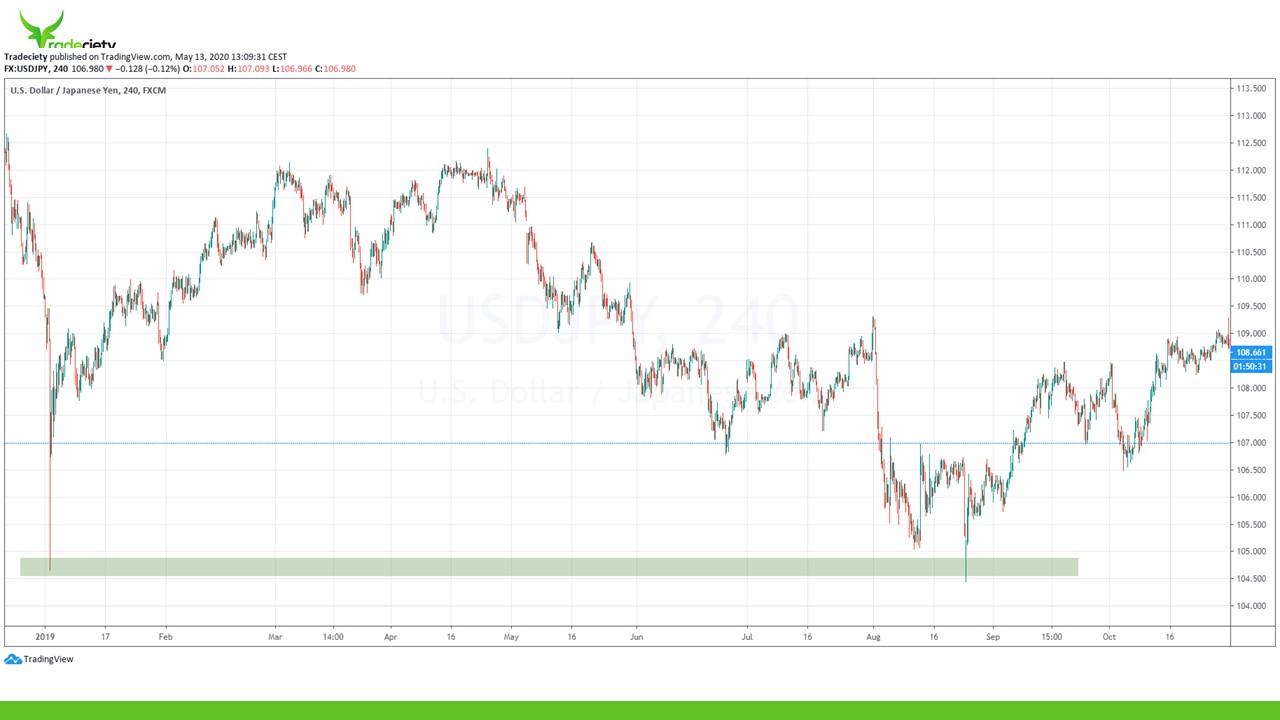
Maybe 200. The market, um, never showed us anything that is coming close to the size of the candle and the size of the rejection. So clearly something really, really significant must have happened. Then we draw our supply and demand area on the tip of the candlestick and we wait for the price to get back there. This is what happened. This is the initial spike, the market trade back away from it, came back to it and did that exact same thing, not as strong, but you can see the market dipped into the level and then started a new uptrend. So you may use such an approach also for the higher time frame or for multiple timeframe approach. Where this is your higher timeframe, then you wait for the lower timeframe on the lower timeframe for the price to get back to the level and then you look for buying opportunities.
(08:05):
Here we have another example, origin of the trend, first consolidation and the market shoots up. So that’s what we’ve been talking about in the previous examples as well. This is how it looks like afterward. You can see we have two touch points. We have a fairly immediate retest where the price moves back into the supply and demand zone, picks up new selling, a new buying momentum, new buying interest, shoots up and then comes even back a second time. You can see we can, again, we could have drawn a trend line in here. We probably have some type of divergence in here. We have a double bottom and then the market started a new uptrend. So it really, really pays off to look at those, um, those supply and demand areas. And you must make sure that you always look for zones that have really an extreme price move and an extreme breakout.
(08:52):
The more extreme the candle is, the better usually the supply demand area. Here we are looking at a V-shaped reaction zone. Again, the market was in a downtrend and then something must have happened that not only, it not only did stop the downtrend, but it completely reversed it into a new uptrend. So clearly at this point the, the balance between the sellers and the buyers has completely changed from a seller surplus to a huge buyer surplus. So we want to mark those important turning points. Then, the price gets back into the, the area, gives us here some type of breakout pattern, very clear defined resistance level, very clear breakout. And then here the new uptrend has started. So it really pays off to look for those reaction points. So, and this is it for my intro video on supply and demand zones. Let me know in the comments if you like those types of videos, let me know if you find this interesting and want to know more about this. I really would like to hear from you, I can’t stress this enough. It really pays off to know about supply and demand zone so make sure to look and start looking for those zones on your area, on your charts. Make sure to look for really extreme price movements, and then track those zones and wait for the price to get there. And don’t trade them blindly, wait for some type of confirmation and build your trading approach around those zones. Until the next time, happy trading!
external link:


We have been trading supply and demand strategies for over ten years, and they have stood the test of time remarkably well. Supply and demand is...

3 min read
Choosing the right trading journal is essential for traders wanting to analyze performance, refine strategies, and improve consistency. In this...

3 min read
“95% of all traders fail” is the most commonly used trading related statistic around the internet. But no research paper exists that proves this...