3 min read
Scientist Discovered Why Most Traders Lose Money – 24 Surprising Statistics
“95% of all traders fail” is the most commonly used trading related statistic around the internet. But no research paper exists that proves this...
Harmonic patterns form the basis of a method of analysis and trading. The foundation for harmonic chart patterns was laid down by H.M. Gartley, a financial analyst and author who published the first developments of this unique approach in his 1932 book, Profits in the Stock Market.
Generally, harmonic patterns have been developed to do two things:
This is what makes the action zones relatively easy to understand. If you follow the procedures for each pattern, one that predicts the length of a move, then you can expect a tradeable price reversal.
Now, let’s narrow our focus to the patterns themselves. Before we begin, let’s break down a few underlying concepts on which these patterns are based.
If there’s anything that you absolutely need to have a solid grasp on before you jump into harmonic patterns, you need to know how Fibonacci retracements and extensions work. If you don’t know your “Fibs,” stop reading now, check out this Investopedia article on fibonacci numbers, and come back.
Most traders are familiar with Fibonacci retracements (which we explained here – click): 23.6%, 38.2%, 61.8% and 78.6% and even 50% (which is not a Fib ratio ). Fibs are commonly used to measure the depth of price retracements from peak to valley. What may be less popular are Fib extensions (e.g. 161.8%, 261.8% and 423.6%). But if you can understand one, then you can easily understand the other.
Most Fib retracements and extensions are used to measure (or project) prices along a vertical grid (like an XY grid). They measure price downward or upward. What makes harmonic patterns unique is that they geometrically fold the fibs into the pattern itself.
Right now, you’re probably trying to visualize what we’ve just written, and it’s likely driving you nuts. No worries. It will be much easier to understand once we go over each pattern. For now, just remember that Fibonacci retracements and extensions are key to understanding how harmonic patterns are formed.
Remember this sequence: X, A, B, C, and D.
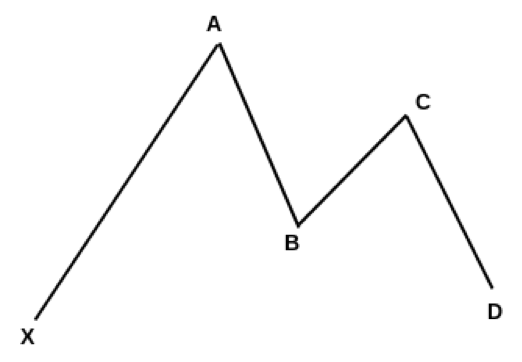
Here’s how it generally works: you have to measure each price point, making sure that it aligns with a specified fibonacci model (depending on the harmonic pattern). If points X, A, B, and C measure up, then your action zone is at D.
Before we get into the actual rules, we need to address how traders generally interpret the rules. If you’ve read different harmonic trading articles, you might have noticed something funny: among the traders who insist on following the rules (e.g. Fib measurements) in a “strict” manner, many of them seem to be in disagreement with one another, as if they were all following different rules.
So ultimately, whether you adhere to or bend the rules is up to you. Will you allow the model to choose a reality, or will you allow a reality to bend the model?
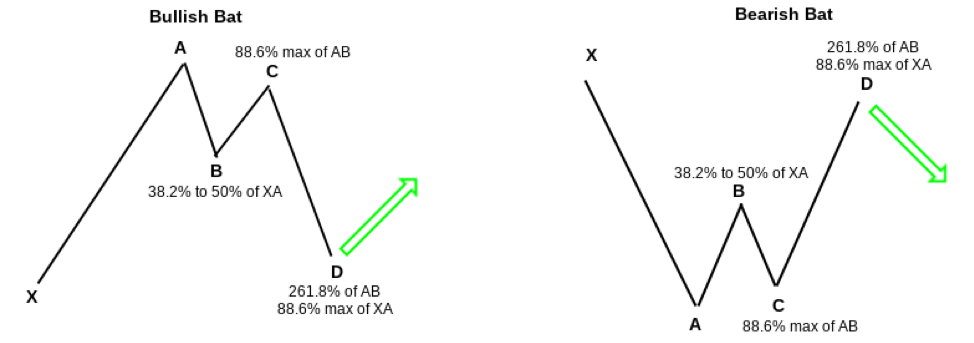
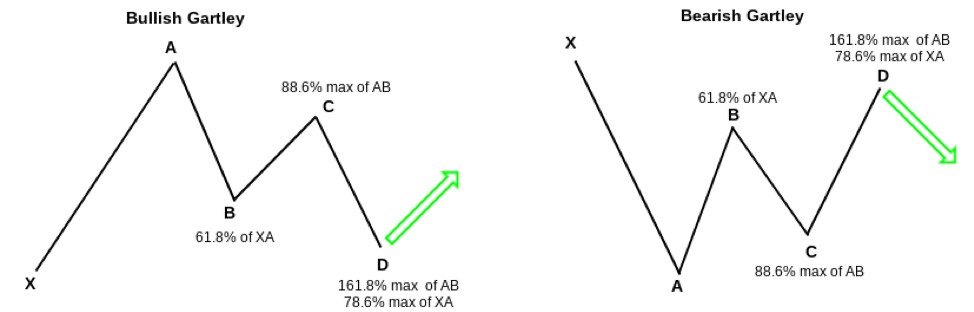
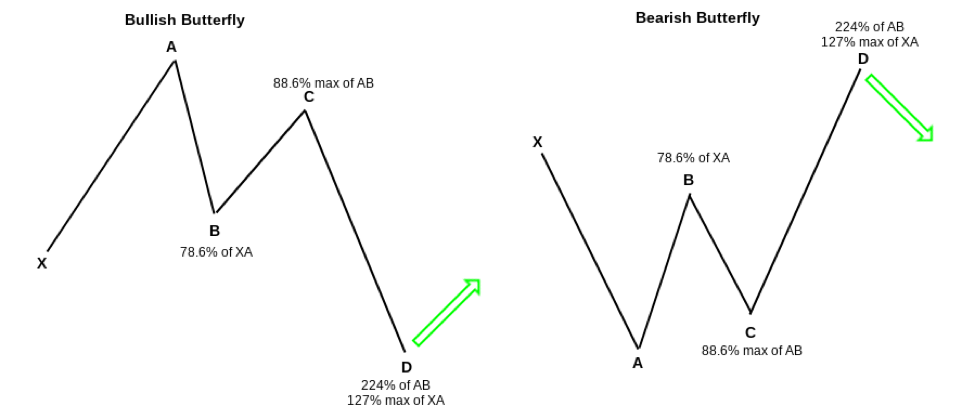
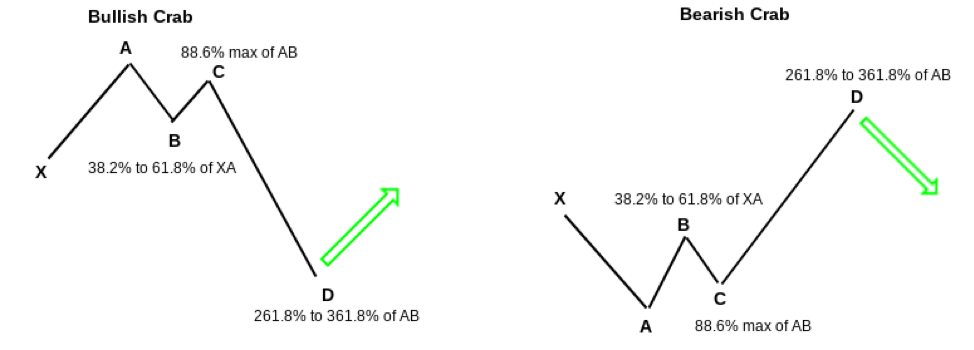
There are four primary harmonic patterns. The first one is the Gartley (the image we provided above). This is the pattern that H.M. Gartley presented in his 1932 book. The next three are variations of the Gartley: the Butterfly, the Bat, and the Crab.
Each pattern has a bullish and bearish version, wherein you can take a long or short position, respectively. Each pattern has a unique set of Fibonacci measurements that distinguish one from the other.
Description and Rules:
Description and Rules:

Description and Rules:
Description and Rules:
Harmonic pattern theory may be complex, but the action procedures to identify and trade them are relatively simple.
I hope this article helped shed more light on the complexity and simplicity of harmonic patterns.


external link:


3 min read
“95% of all traders fail” is the most commonly used trading related statistic around the internet. But no research paper exists that proves this...

3 min read
Trendlines can be great trading tools if used correctly and in this post, I am going to share three powerful trendline strategies with you.

3 min read
Choosing the right trading journal is essential for traders wanting to analyze performance, refine strategies, and improve consistency. In this...