Supply and Demand Trading in 2026
We have been trading supply and demand strategies for over ten years, and they have stood the test of time remarkably well. Supply and demand is...
3 min read
Rolf
Jun 19, 2017 8:00:00 PM

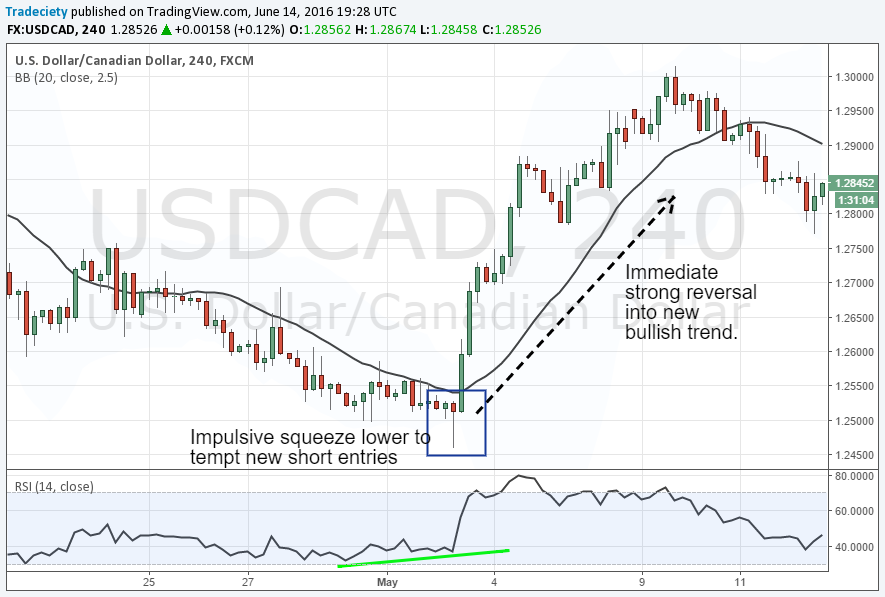
The Bear trap is a very important chart formation and price pattern and if you haven’t heard about It yet, then probably because you were the one getting trapped in it. The bear trap describes a scenario which tempts the unknowing trader, with very obvious signals most of the time, to enter a sell trade just to immediately reverse on him.
To understand why and how bear traps form, we have to understand the Orderflow (how traders plan and execute their trades) and put ourselves in the shoes of the average struggling trader who always gets trapped in those situations:
1) Price traded in a long downtrend and the traders who missed such a downtrend are now frustrated and are looking for ways to somehow jump on the train and get at least some money out of it.
2) Swing highs and lows are a very popular trading concept and many traders use such swing points to time trade entries. In our example, many traders would have looked at the swing low and then entered short once the level broke.
There are a few things wrong with this trade:
Later we will learn how to make better trading decisions around such swing points.
3) Price did move a bit lower after breaking the swing low and the short-positioned traders probably felt very comfortable with their trades. Dead wrong!
4) Price did not only move back up above the previous swing point, it gapped up! Let’s examine what happened here exactly:
When the amateur traders, who ran into the bear trap, executed their short trades, they sold to the professionals who happily bought from them. But the buying interest from the professionals was so huge that it consumed all the sell orders and a lot of open interest remained. In our supply and demand article, we learned that a market has to move higher if there is more buying than selling interest and that’s what happened at the gap.
5) Price continued to climb higher and the trapped traders were forced to get out of their short trades which means they had to initiate a buy trade, further fueling the new uptrend.
Now we know what a bear trap looks like but how can we avoid those situations before they happen? Here are two very important tips you need to internalize:
Of course, it doesn’t make sense to say that you should stop trading breakouts at swing points. Under the right circumstances, those can be very profitable trading opportunities.
What you should avoid, though, is chasing after a mature trend. After long trending phases, we must be very cautious and read the warning signals correctly.
In our previous example, we can see that just before the bear trap happened, price showed a strong impulse move to the upside and even above the moving average. This is usually not something you want to see during a mature trend because it shows that more buyers are coming in and that sellers weren’t able to keep price as low anymore.
Read: How to find the end of a trend
I am constantly looking for signs of bull and bear traps because they can be very good trading opportunities. I am not a classic trend-follower and, thus, I wait for those trend reversal signals to catch a new trend early on.
Once I see a bull or bear trap, I start looking for opportunities into the direction of the new trend. Of course, just a bear trap isn’t enough, but it’s a good starting point for your price analysis.
To conclude, I want to introduce the most common types of price traps so that you can familiarize yourself with them and recognize them when they happen.
Double tops are very classic patterns and they show areas where buyers fail to push price into new highs. Often, we can see double tops with rejection Pinbars or candles. A long shadow through a double top shows a failed breakout attempt and many people will jump on such signals when the candle is forming because it looks like a successful breakout.
I am sure that you recognized yourself when reading this article and that’s totally OK. We all have gotten trapped in such a move before. But with your new knowledge, you should be able to view the markets in a new light and become the one who is on the right site of the trap in the future.

We have been trading supply and demand strategies for over ten years, and they have stood the test of time remarkably well. Supply and demand is...

3 min read
Choosing the right trading journal is essential for traders wanting to analyze performance, refine strategies, and improve consistency. In this...

3 min read
“95% of all traders fail” is the most commonly used trading related statistic around the internet. But no research paper exists that proves this...