Supply and Demand Trading in 2026
We have been trading supply and demand strategies for over ten years, and they have stood the test of time remarkably well. Supply and demand is...

I just concluded the best first half of a year in my whole trading career. I did so while drastically reducing my average risk(%) per trade. This sounds counterintuitive at first, but let me get into the details.
Previously, I employed a dynamic risk model that varied position size depending on multiple factors, i.e. quality of setup, expected RRR, time frame, correlation, and so on.
I was quite ok with this but never satisfied. I felt that I could achieve more by optimising my position size, so I looked at my performance and found, among others, 4 significant treasures.
Now, what do I make of this? Curiously enough, in various optimization backtests of random strategies years earlier, a friend and me found that an arbitrary 3:1 RRR (depending on the Stop Loss) almost always performed best, no matter the strategy. It even turned some losing into winning strategies to simply place a Set&Forget Take Profit at 3R in relation to the chosen Stop Loss.
So then I decided that – for this particular strategy I am talking about – I would never again take a setup below 3:1 RRR. Additionally, I would trade smaller and smaller, the higher my RRR was, and bigger the lower my RRR was. Obviously, as 3:1 RRR trades are in the middle of my bell curve, I want to bet most on them.
This also had the advantage of freeing up a lot of capital because trades with a higher RRR also had a much higher average holding time in my database, thus binding more capital longer which then forced me to give up on other trade opportunities.
By the way, the strategy I am talking about is a very long term strategy based on the weekly and daily charts.
So I started to go through my old trades again with new position sizing rules and tested various approaches in the hopes of decreasing volatility even if it meant giving up a few returns here and there.
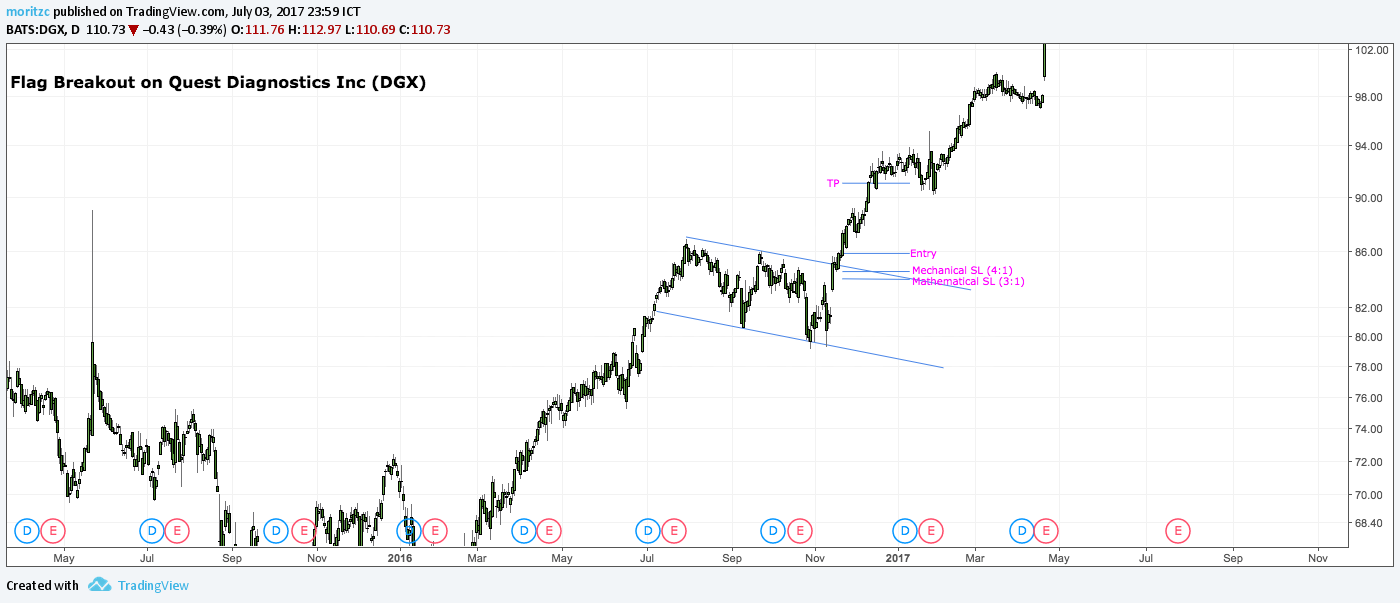
I eventually came to the conclusion that I would employ a mathematical stop and a technical/mechanical stop. I would then apply my initial 1% risk (my maximum position size from that time on) to the mathematical stop, which was simply the take profit distance divided by 3 (you get it, 3:1…), and then draw my technical stop based on charting rules, and pull my stop then to the mechanical stop, effectively increasing my RRR while decreasing my risk.
So a trade that I would have initially risked 2% on with, let’s say a 6:1 RRR, was now a 6:1 trade with a risk of 0.5%. And if my technical stop was ever wider than my mathematical stop, hence giving me an RRR worse than 3:1, I would skip the trade.
Sounds complicated? Here are 3 examples.
I think the examples are self-explaining, but here we go step by step.
Now the great thing about this technique is not only that it smoothens out my equity curve, it also allows me to take on more positions simultaneously and thus ride out variance faster.
Previously, my maximum of simultaneously open positions was 11, now my record is 31, and I still haven’t hit my maximum portfolio exposure yet.
Additionally, the return we get from a winner (if it reaches TP and we don’t get taken out prematurely due to our trade management), is always 3%. This takes a lot of the greed out of my trading.
With my old risk model, when I saw a trade of 5R or more, I had the dollar signs in my eyes (“10% in one trade, wow!”) and absolutely did want to hit the homerun, which affected my trade management. Also, the increased risk and varying returns from trades made me pay more attention to some trades than to others. I got “married” to some of them.
Now, all I control is my risk – I never even think about the return, because it is always the same. This takes a lot of the excitement out of trading, and thus, makes me think much more objectively.
I did all of this testing and modelling only with my trading journal and my bare hands. It didn’t take me long, and it was worth every second. I advise you, too, to think about my approach and whether it would be beneficial to your trading.
It certainly was for me. I am taking a lot more trades now, have much less volatility, can ride out variance faster, and overall simply make more money on less risk per trade while keeping the same portfolio risk guidelines as with my previous approach.

We have been trading supply and demand strategies for over ten years, and they have stood the test of time remarkably well. Supply and demand is...

3 min read
Choosing the right trading journal is essential for traders wanting to analyze performance, refine strategies, and improve consistency. In this...

3 min read
“95% of all traders fail” is the most commonly used trading related statistic around the internet. But no research paper exists that proves this...