Supply and Demand Trading in 2026
We have been trading supply and demand strategies for over ten years, and they have stood the test of time remarkably well. Supply and demand is...
The Parabolic SAR indicator is a price AND time based trend-following indicator. SAR stands for “stop and reverse”. The Parabolic SAR is one of the more complex trading indicators when it comes to the underlying calculations but in this article, you will learn exactly what it is that the SAR does.
Furthermore, I encourage all traders to approach their chosen indicators with a similar approach. It is crucial to really understand what your indicators are doing, what causes them to rise or fall and how are the signals calculated. As we have seen in previous articles about the STOCHASTIC or the RSI indicator, it becomes obvious rather quickly that the majority of traders (including books, websites etc) are using those indicators incorrectly.
So let this guide inspire you on what it takes to really understand your trading tools.
The SAR rises below price as long as the price is in an uptrend. The idea behind theParabolic SAR is that it signals a trailing stop loss and during an uptrend, the SAR will only rise and never go down – always increasing the protected unrealized profits.
When the price reverses and when the price falls below the SAR (after an uptrend), then the direction changes and the SAR rises above price – acting as a trailing stop for the downtrend.
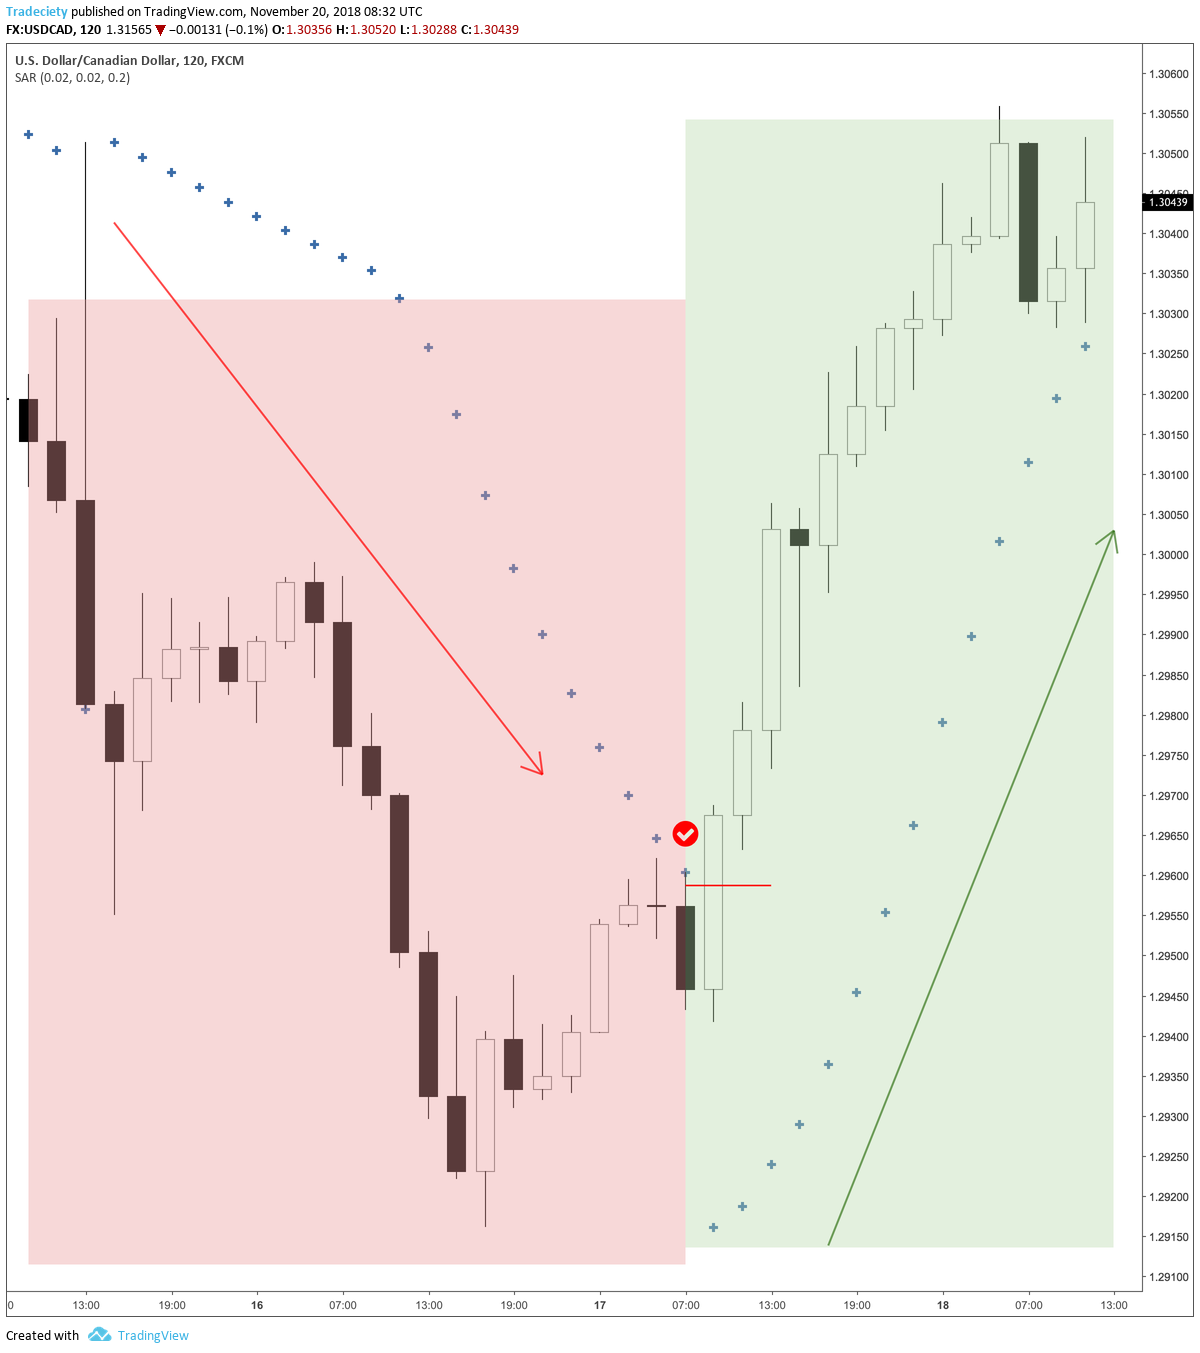
The screenshot below shows those basics effectively and during the downtrend on the left, the SAR dots were above the price, acting as a trailing stop. The candle marked when the red checkmark highlights the candle where price, for the first time, hit the SAR. When the price hits the SAR, it would lead to a stop hit, and the SAR signals a change in direction.
How close the SAR trails behind the price is a key factor because it determines how sensitive the SAR reacts to price changes. The high the sensitivity, the faster the SAR changes its direction. This can be both good and bad, depending on the objective of the trader. If a trader prefers to get in and out of trades quickly, a high sensitivity should be chosen. A trader whose objective it is to ride trades for an extended period and remain in trades during (minor) retracements should pick a lower sensitivity.
In most charting platforms, the sensitivity is either called “step” or “increment.
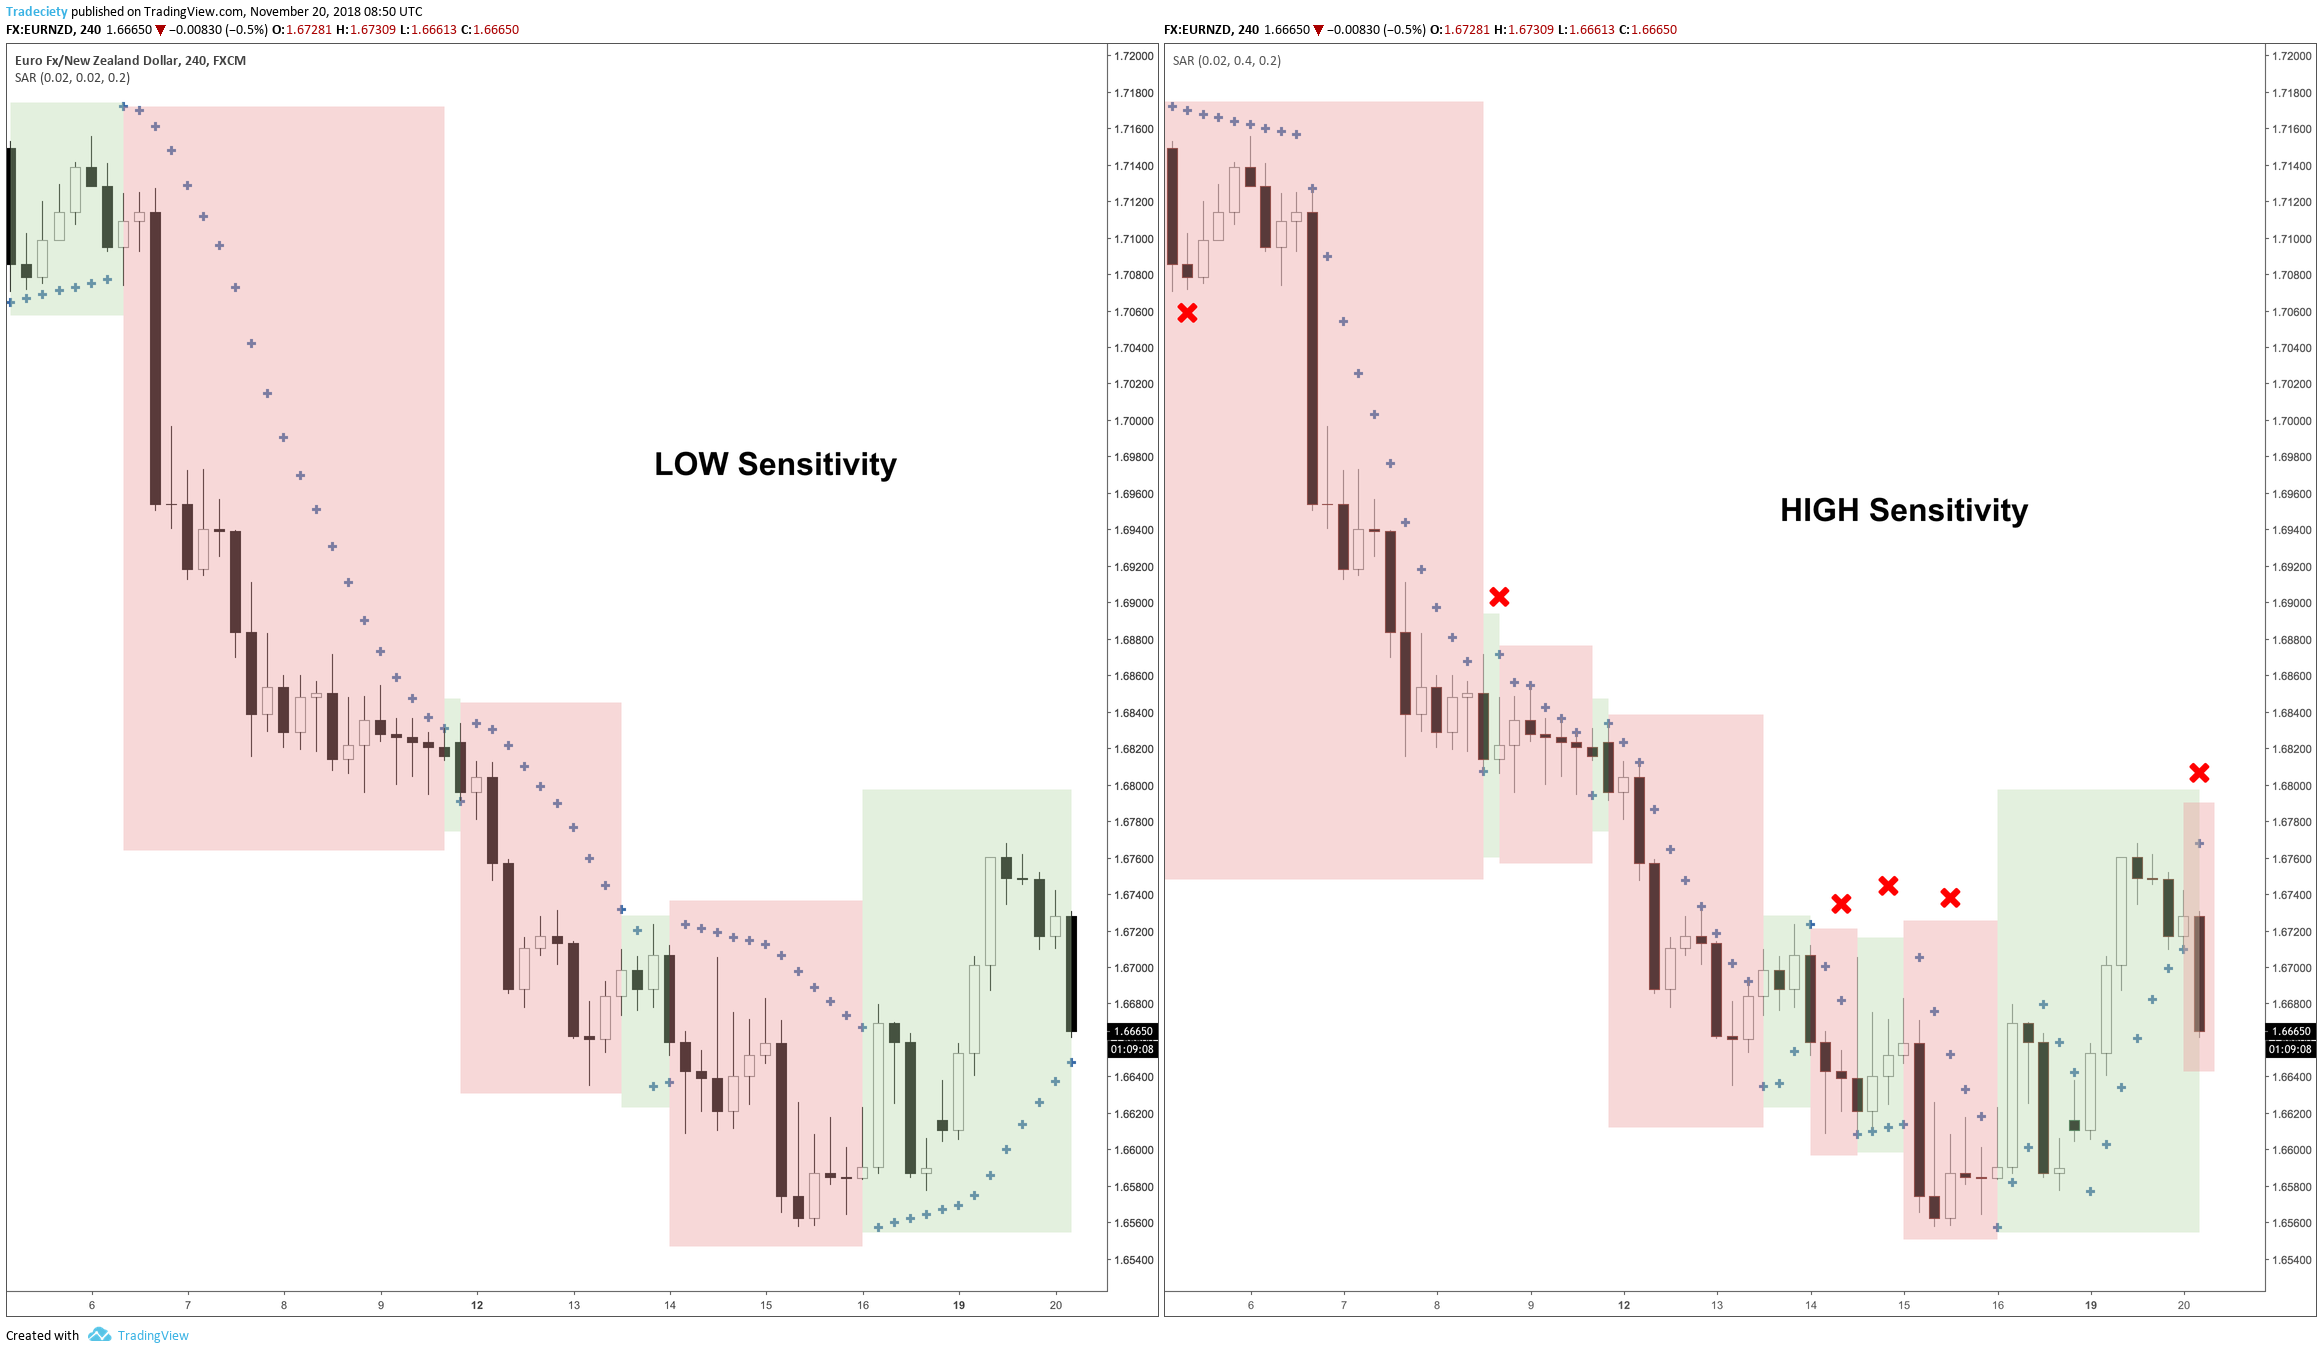
Let’s compare how sensitivity impacts the SAR signals. On the left, we see the default setting of 0.2 for the increment. On the right, I set the increment to 0.4. We can see right away that the SAR on the right is giving more signals and whereas on the left the indicator seems to be smoother, the high sensitivity jumps around a lot. However, we can also see that on the most right candlestick, the price is falling rapidly and whereas the low sensitivity SAR still signals a long trade, the high sensitivity already signaled a change in direction.
Thus, the low sensitivity is good during long and strong trends, but when the direction changes quickly, a low sensitivity could lead to evaporating profits.
The SAR does work well in certain conditions but, as all trend following-indicators, it fails during volatile range markets.
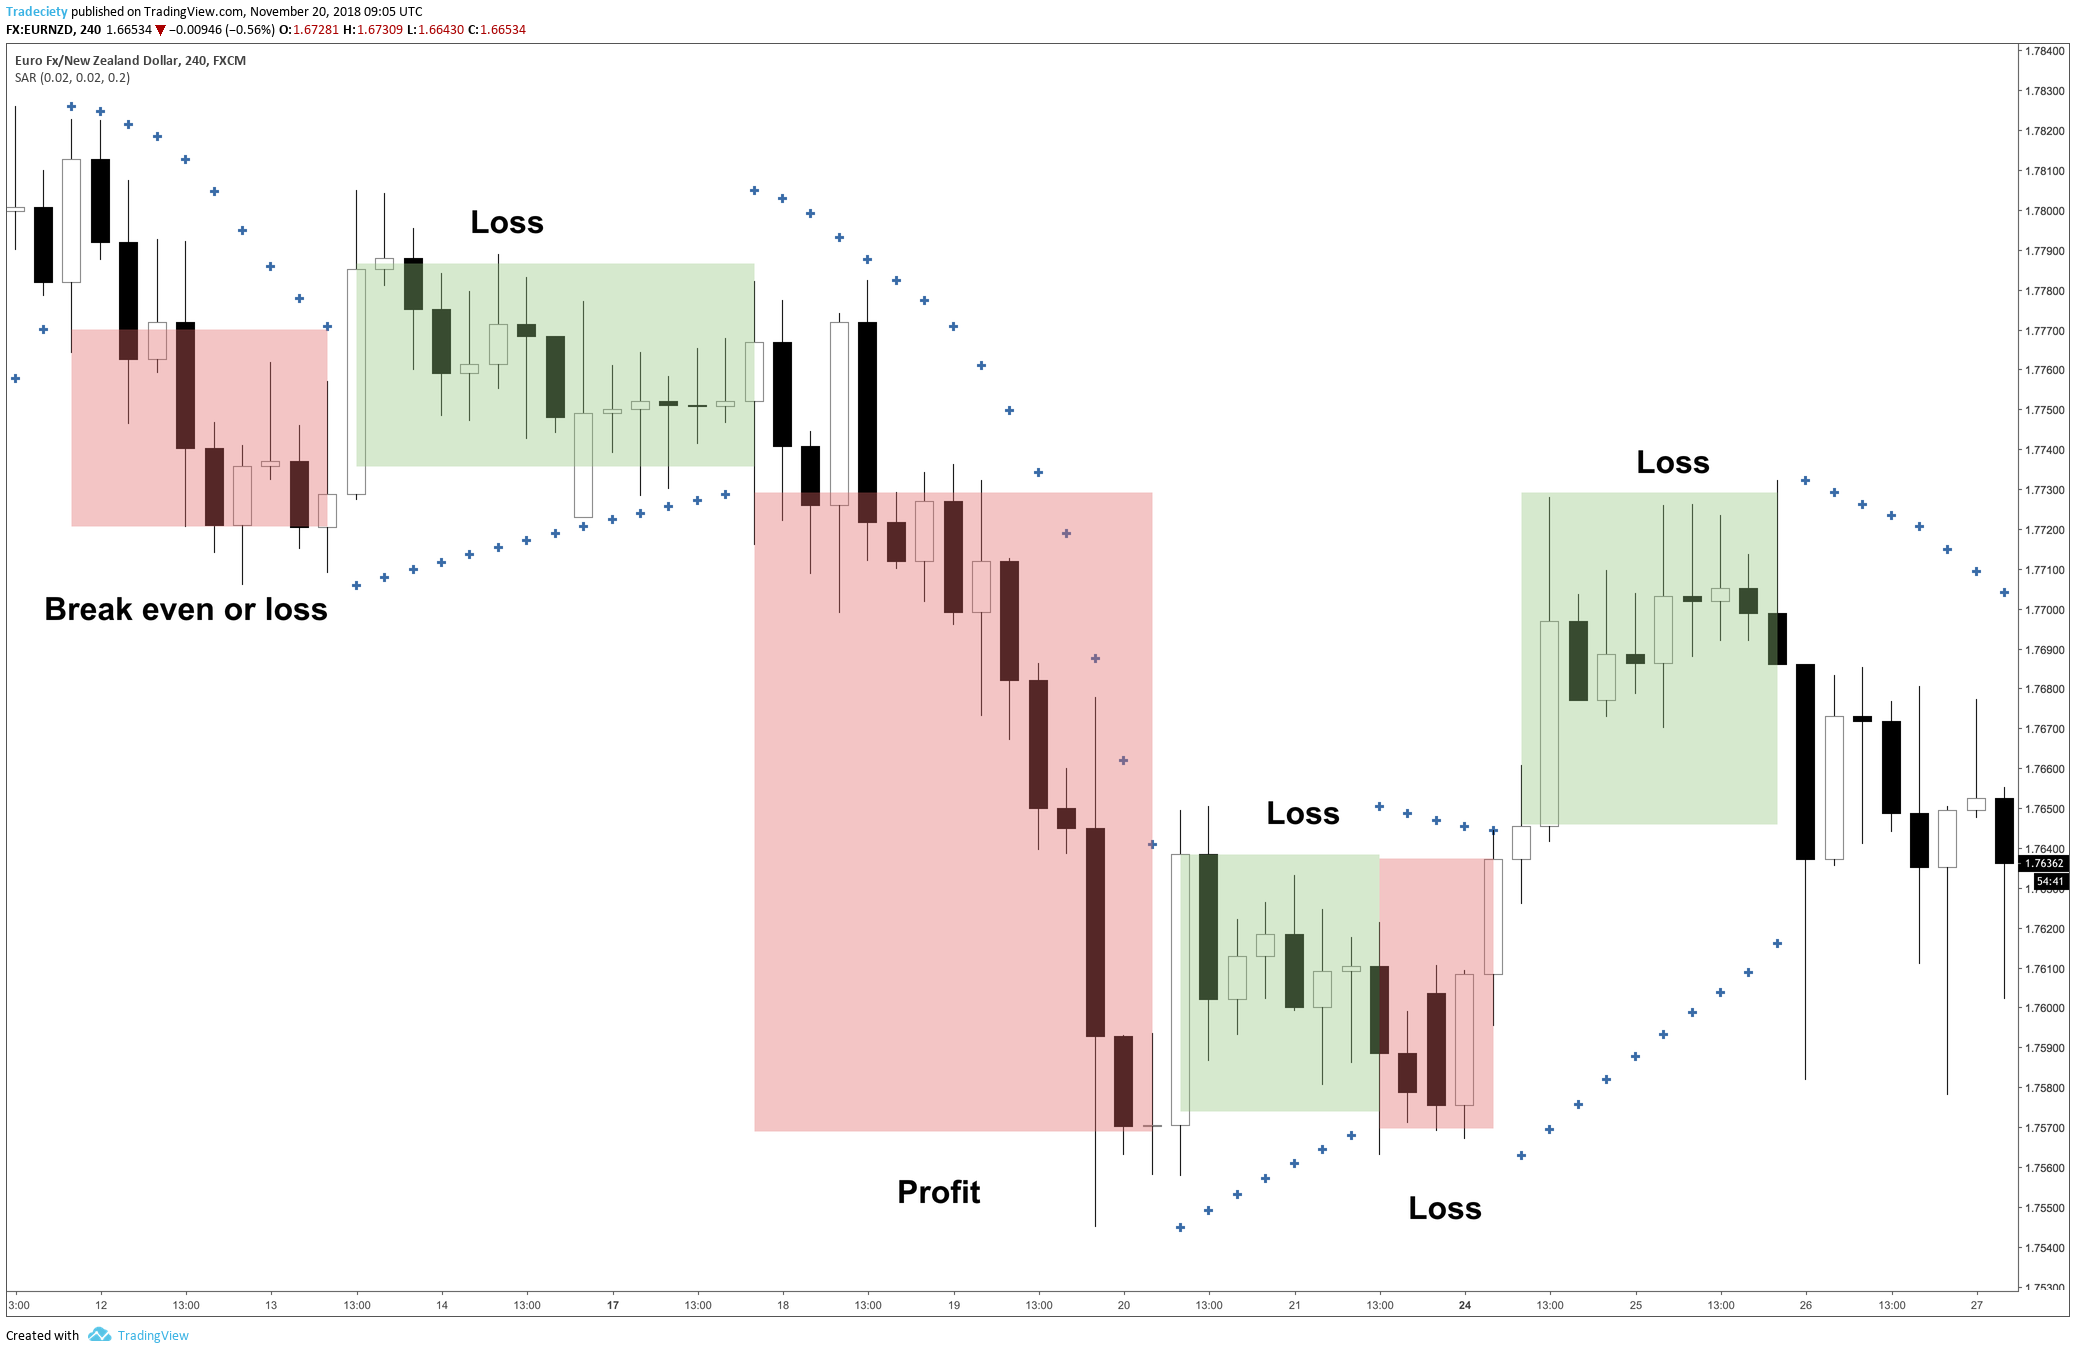
The screenshot below shows that the SAR changed directions 5 times during the chosen period. The SAR would have signaled 2 certain losses, 1 good sized profit, and 2 medium sized profitable trades. This might sound ok, but as we all probably can agree, rarely things go as planned and a loss quickly leads to an emotionally driven decision and things go downhill from there. It is, therefore, recommended to approach backtesting or regular chart review from a more pessimistic point of view.

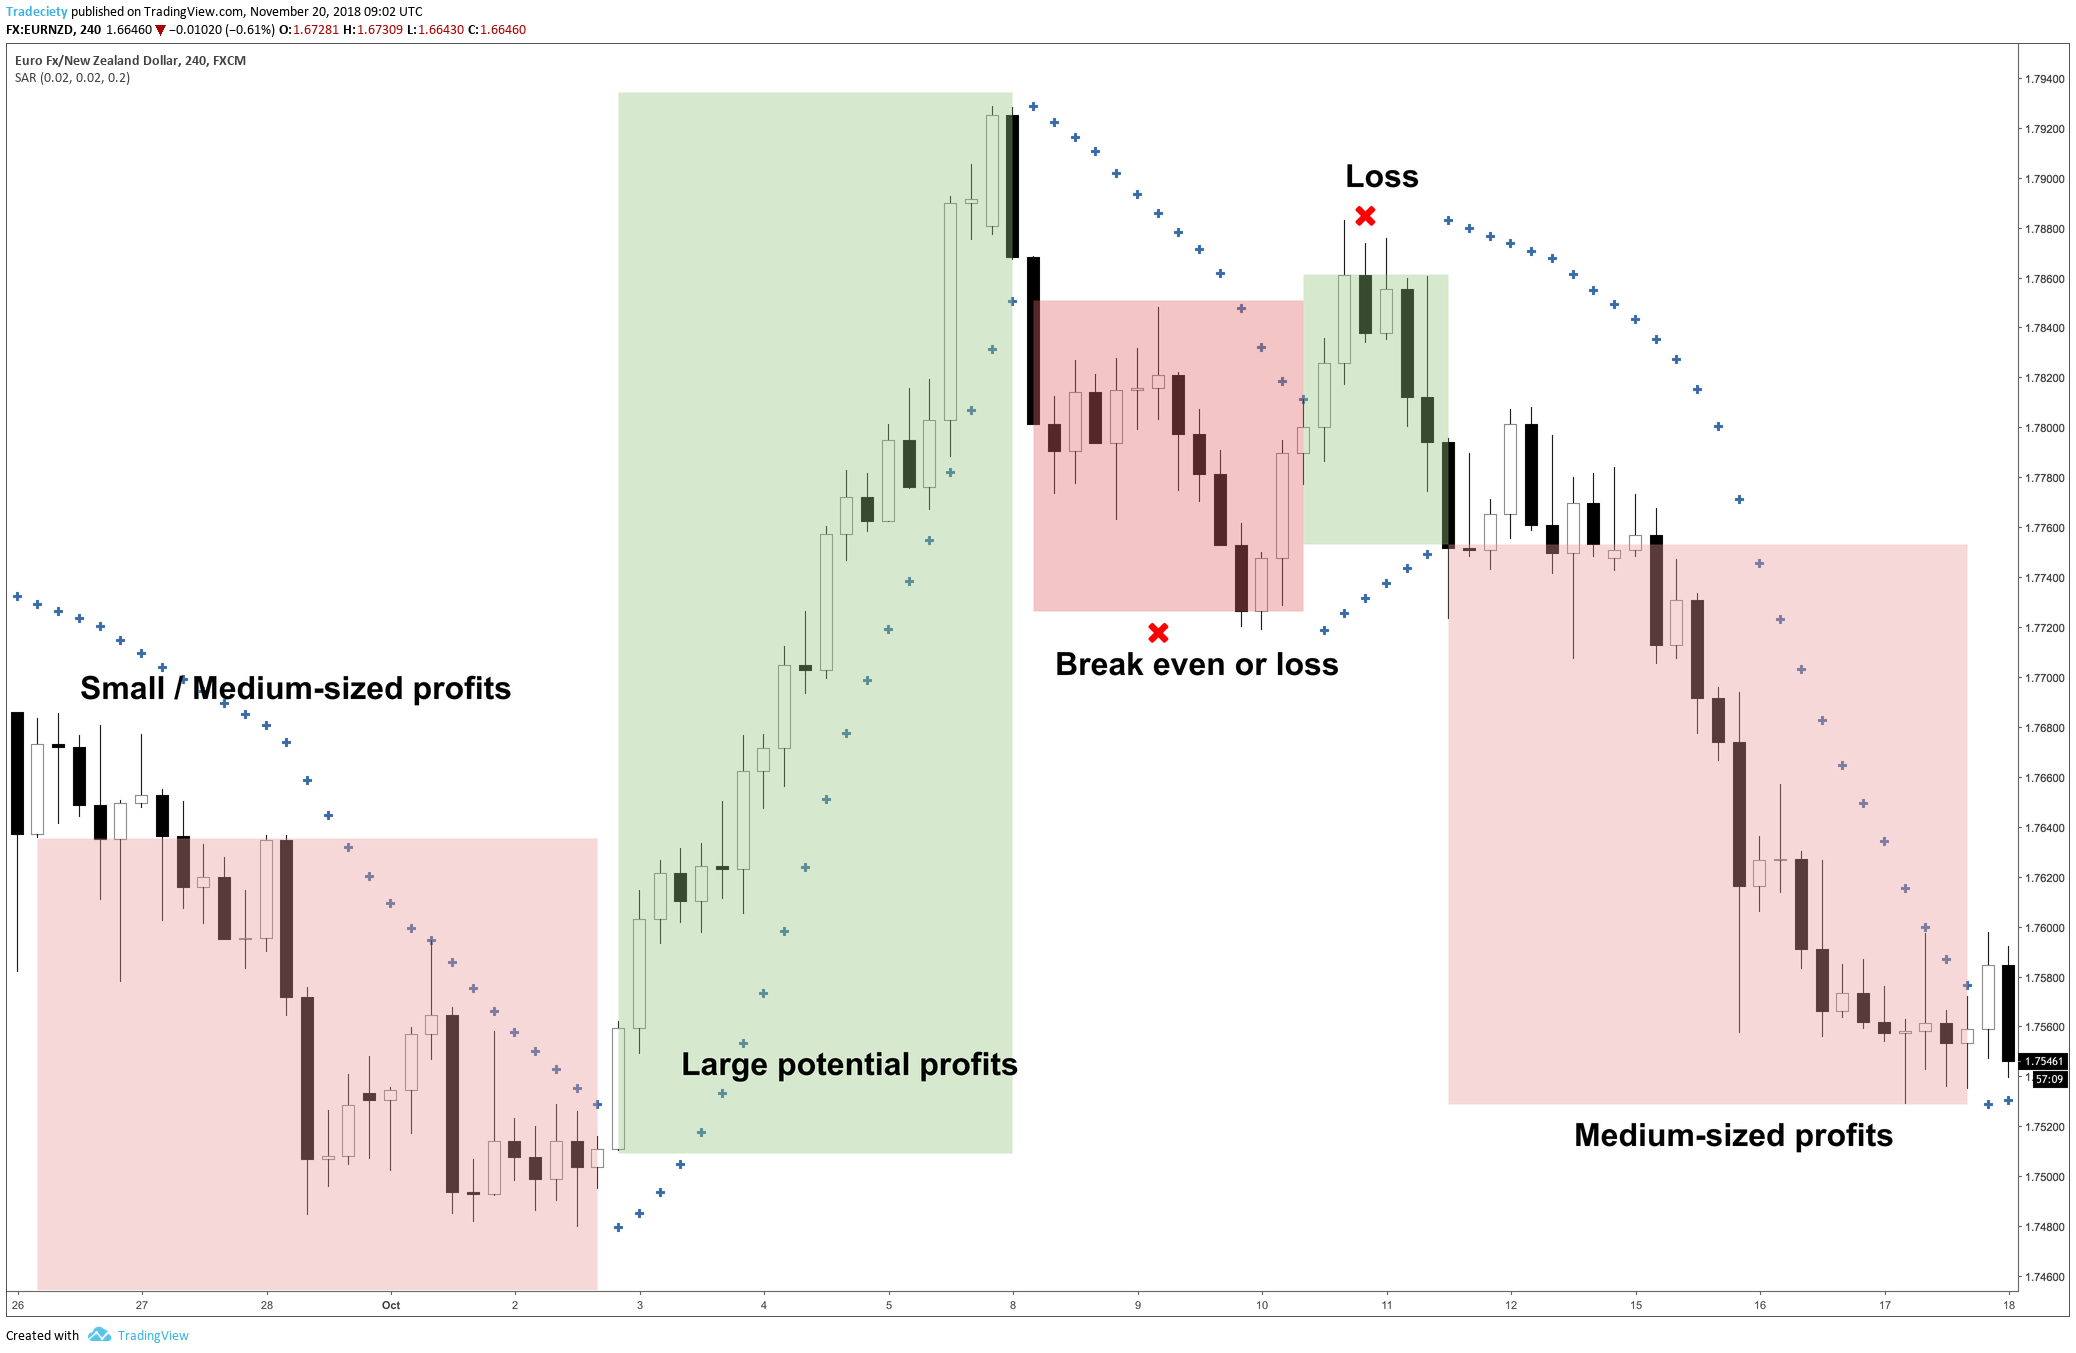
This scenario shows an even worse situation and out of the 6 SAR signals, 5 would have provided losing trades and just one potential profit.
However, this does not mean that the SAR is generally bad indicator or that the signals are flawed. It just means that a trader really needs to know how to use the indicator and when to stay out of the market.
This is pretty much the premise of all trading strategies. Nothing will work 100% of the time and it’s a trader’s duty to understand when his system works and when he does not have an edge.
As with all trading indicators, tools or concepts, they should never be used on their own – generally speaking. It is always advisable to use additional filter tools to improve signal quality.
Let me provide you with a few possible solutions on how to improve the signal quality of the Parabolic SAR.
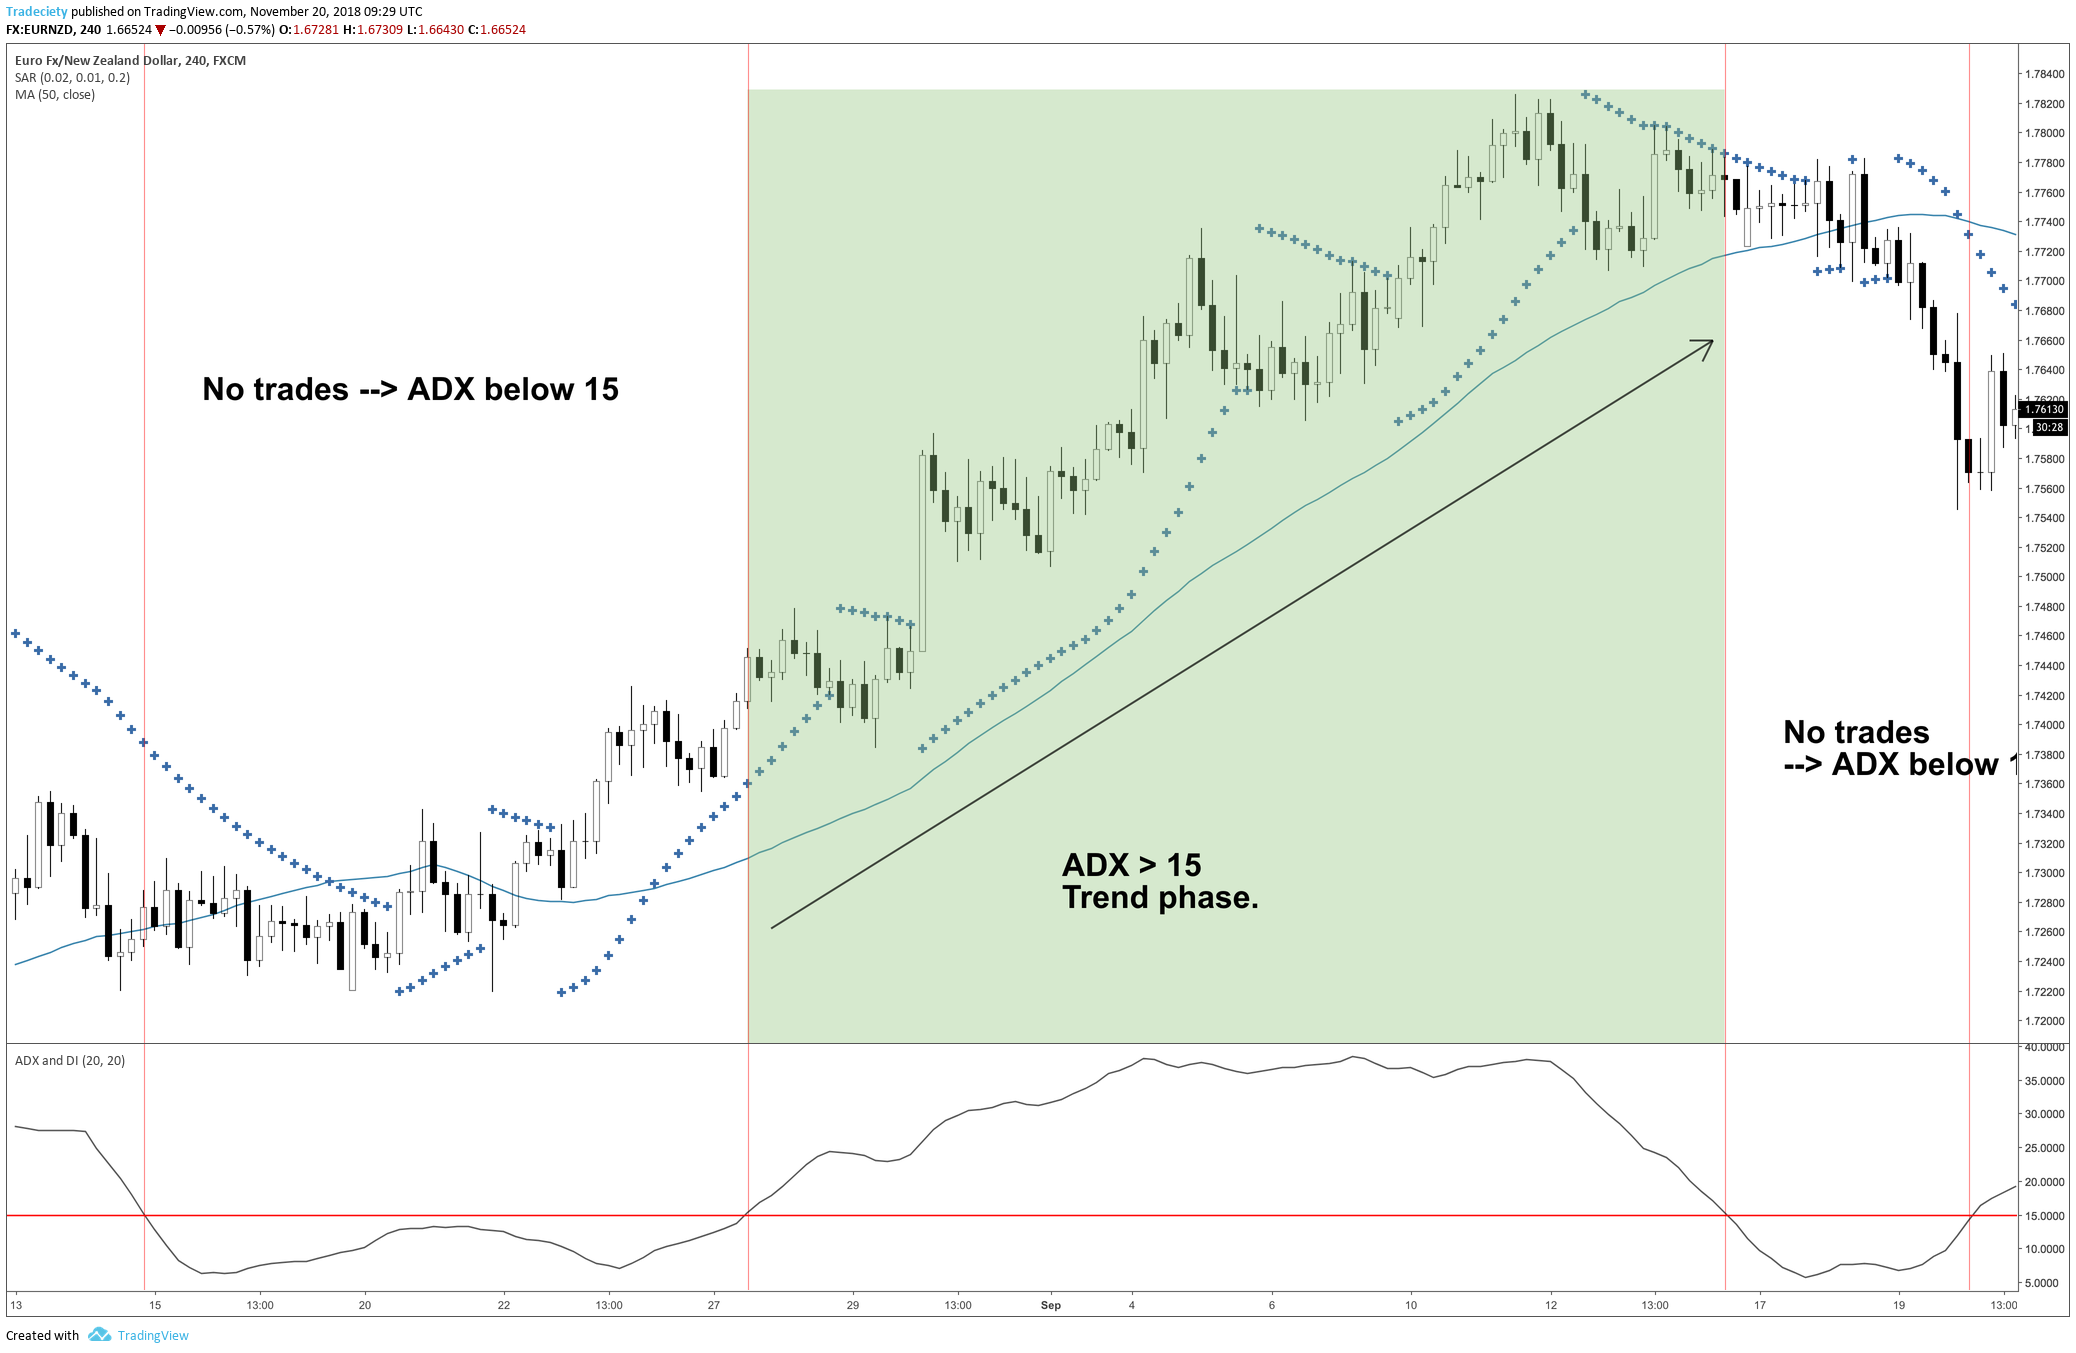
A popular combination is a moving average together with the ADX. The weakness of the SAR is range markets and that’s why this combination can improve the SAR trading signals potentially.
Here are the two filter layers:
In the screenshot below, there is one trending phase where the ADX is above 15. During this phase, the price is above the moving average. Thus, the trader will stay aside in all other market conditions and only look for potential long entries as long as the price is in the green marked area.
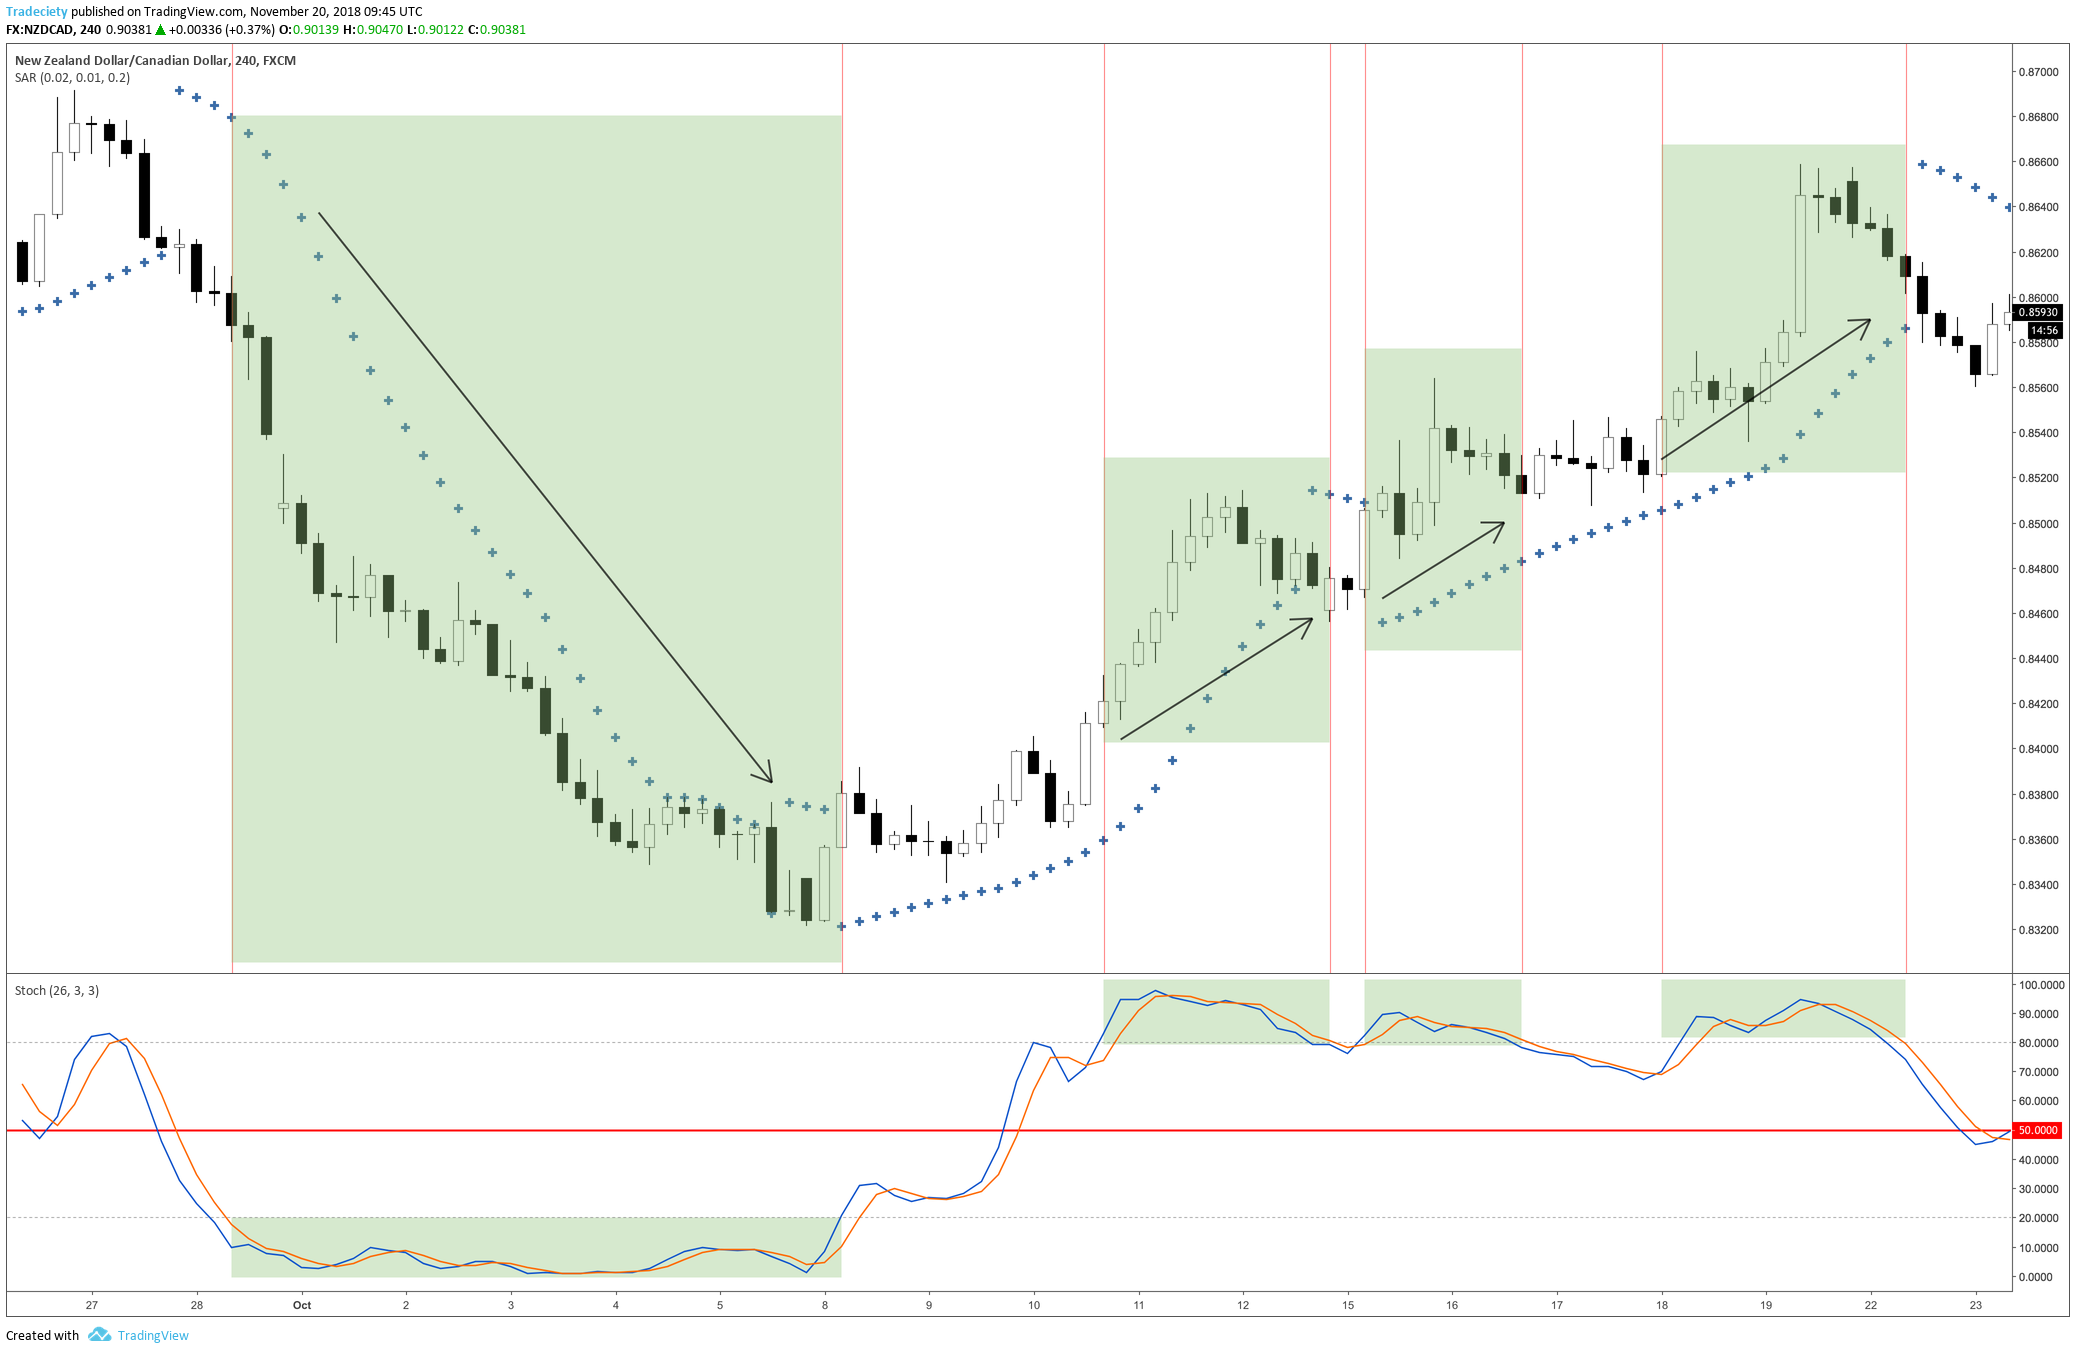
Remember, the goal of the filter tools is to filter out range periods. In the example below, we, thus, chose a slow STOCHASTIC setting (26,3,3). The STOCHASTIC signals strong trending markets when the lines go above 80 or below 20.
In the screenshot below you can see how precise the STOCHASTIC seems to signal trend markets. First, the STOCHASTIC confirms a long downtrend when it dips below 20 and stays there for an extended period. The SAR stop only got hit when the STOCHASTIC also rose above 20.
Afterward, the STOCHASTIC moved in and out of 80 three times. The SAR would have allowed riding the long trades as well. Between the second and the third time, the SAR stop wouldn’t have been hit so that the trader could have stayed in the trade even longer.
When it comes to indicator trading or using any trading tool for that matter, it is important to remember a few key points.
external link:


We have been trading supply and demand strategies for over ten years, and they have stood the test of time remarkably well. Supply and demand is...

3 min read
Choosing the right trading journal is essential for traders wanting to analyze performance, refine strategies, and improve consistency. In this...

3 min read
“95% of all traders fail” is the most commonly used trading related statistic around the internet. But no research paper exists that proves this...