Supply and Demand Trading in 2026
We have been trading supply and demand strategies for over ten years, and they have stood the test of time remarkably well. Supply and demand is...
The moving average is one of the most widely used technical analysis tools out there. Moving averages basically calculate the average price of a certain number of periods in a given time frame to smooth out the price action and helps traders get a proper visual representation of the overall directional movement of an asset. In Forex trading, moving averages are mainly used to generate trading signals. But the larger period moving averages such as 50 and 200 Simple Moving Averages (SMAs) are also used to gauge potential support and resistance.
When moving averages are used to generate directional movement-based signals to buy or sell a currency pair, the underlying concept is that traders believe the past price action will continue in the future and it can be profitable to follow a trend. On the other hand, when moving averages are used to predict major support and resistance, it is based on the idea of self-fulfilling prophecy.
In this moving average strategy guide, we will discuss how you can utilize and diversely apply moving averages by adapting it to different strategies. Moreover, we will also touch base on some of the problems of using trend lines compared to the moving average and how to mitigate such issues to improve a strategy’s performance.
The moving average strategies we will discuss:
#1 Moving Average Crossover
#2 Moving Average Pullbacks
#3 Moving Average Trend Trading
#4 Moving Average Stop Loss
#5 Moving Average Take Profit
There are hundreds of different versions of moving averages that utilize similar concepts, but slightly different numerical calculations. However, the two most common variants of moving averages used in Forex trading are the Simple Moving Average (SMA) and the Exponential Moving Average (EMA).
There are hundreds of online articles about how to calculate different types of moving averages and you should learn the basics of how to calculate it. However, all charting software will calculate this for you. As we will focus on how to use a moving average based trading strategy, we will only discuss the merits of using different types of moving averages in this article.
The SMA, as the name suggests, only draws lines based on the average price action. However, the interesting bit about EMAs is that it gives a higher weighting to more recent time periods. So, if you are drawing a 21-period moving average, the line will prioritize the last few periods (or bars) compared to the time periods at the beginning of the series.
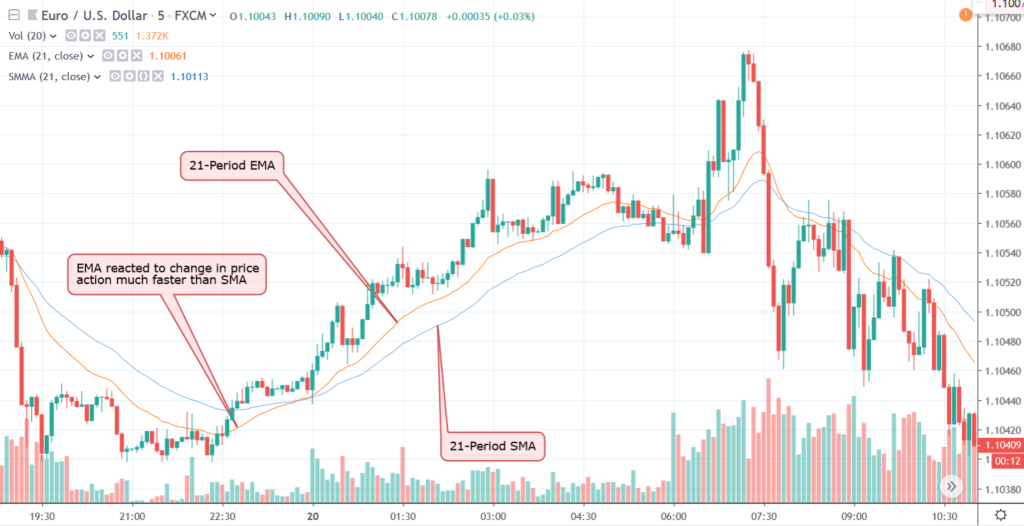
Figure 1: EMAs Reacts to Change in Price Action at a Much Faster Rate Compared to SMAs
While EMAs are more sensitive to recent price action and can generate trading signals much earlier compared to SMAs, there is a pitfall. It can generate more false signals compared to when using SMAs. After all, a minor retracement can tilt the EMAs at a much faster rate compared to SMAs, which can send a false reversal signal.
Basically, using EMAs will get you into a trade earlier, but you might get out of the trade based on a false reversal signal. By contrast, using SMAs will get you into a trend later, but you will likely ride it longer because there will be less false signals about reversals. However, if you are following a trend, using SMAs will lag more to a change in trend and you may leave a lot of profits on the table.
Hence, it makes sense that we try to develop trading strategies where the SMAs will generate an entry signal to trade and help minimize false signals, where using EMAs will generate exit signals. Because it is more important to get it right when entering the market than leaving some profits on the table. However, to keep things simple, we will use EMAs to demonstrate how you can use moving averages in your trading strategies.
There’s more than one way to skin a cat and there are certainly more than a few ways you can integrate moving averages into a winning trading strategy. Here, we will look at six of the most effective ways you can trade with moving averages.
Moving average crossover is one of the most popular trading strategies and it is popular for a good reason. Since moving averages smooth out price action, when a lower period moving average crosses above or below another higher period moving average, it confirms that the direction of the price has changed.
While you can use any moving average, be it the combination of 5 and 10, or 15 and 30, the best crosses are always based on the Fibonacci sequences such as 5, 8, 13, 21… etc. Since professional and institutional traders often use Fibonacci numbers moving average crosses, it ends up acting as a self-fulfilling prophecy as well.
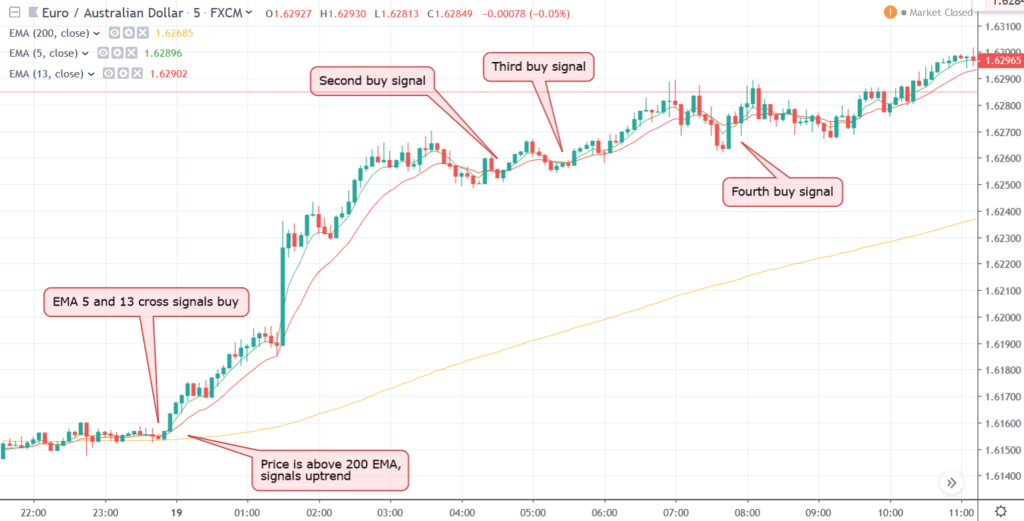
Figure 2: Price Above the 200 EMA Confirms Uptrend and Shorter Period MA Crosses Trigger Trades
In figure 2, we can see that the EUR/AUD price is above the 200 period EMA, which confirms the bullish bias in the market. Under the circumstances, whenever a shorter period MA crossover happens, here we used EMA 5 and 13 cross – both Fibonacci numbers, you can consider placing a new buy order to keep scaling into your position and ride the long-term trend.
During a downturn, the price will remain below the 200 EMA and the shorter period MA crosses will signal sell orders.
Trading a trend would be much easier if there were no pullbacks and it often confuses beginner traders. However, there is a nifty way to identify if crossover in the opposite direction is a retracement or really a reversal. For this, you need an oscillator indicator on your chart, such as the Stochastics indicator.
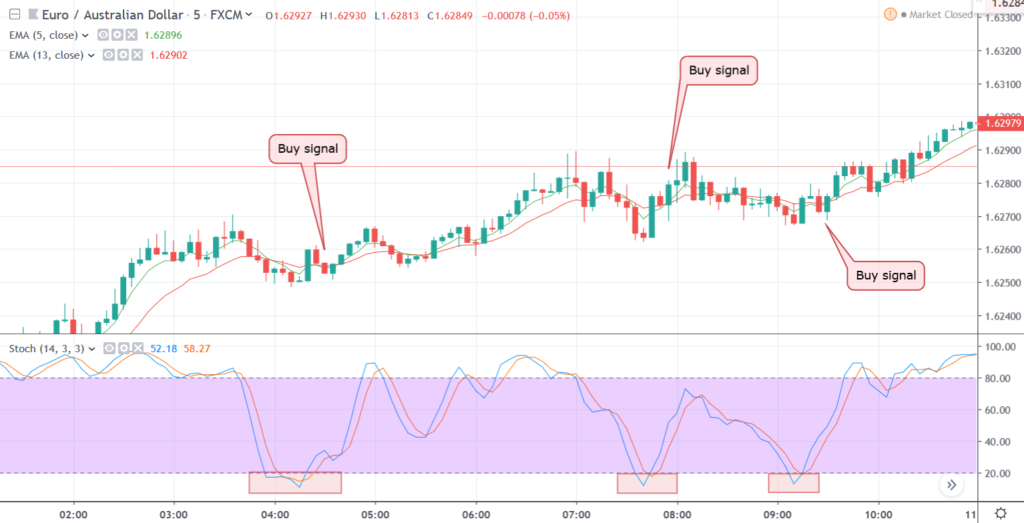
Figure 3: Using an Oscillator Can Help Identify Perfect Entries During Pullbacks
In figure 3, we can see that during the uptrend, the EMA 5 and 13 crossed several times in the opposite direction. But every time, the Stochastics turned oversold fairly quickly as it fell below the 20 level when this happened, but the EMA 5 and 13 do not fall below the previous lows, it signals a retracement and not a complete reversal of the trend. The concept used here is called a divergence.
If you find such divergence in the market, wait for the shorter period EMAs crossover to signal that the trend has resumed and then, enter the market again. This way, you can keep following the trend and scale in to maximize your profit from a single long-term trend.
Most currency pairs remain range-bound for the majority of the time and trends only occasionally. However, getting into a trend at an early stage yield the highest reward to risk ratio trades. That’s why trend following strategies are often the most profitable ones. Most beginner traders consider using trend lines to follow a trend. However, there are some major problems with using trend lines and trading trends with moving averages is a better strategy than solely relying on trend lines.
Trend lines are great at forecasting potential support and resistance levels during an uptrend and a downtrend, respectively. But, the slope of the trend line can differ. If you are not careful; you might end up getting out of a trade too quickly if the angle of the slope of the trend line is too much. On the other hand, you might allow a retracement to eat up the bulk of your unrealized profits if the slope of the trend line is too low.
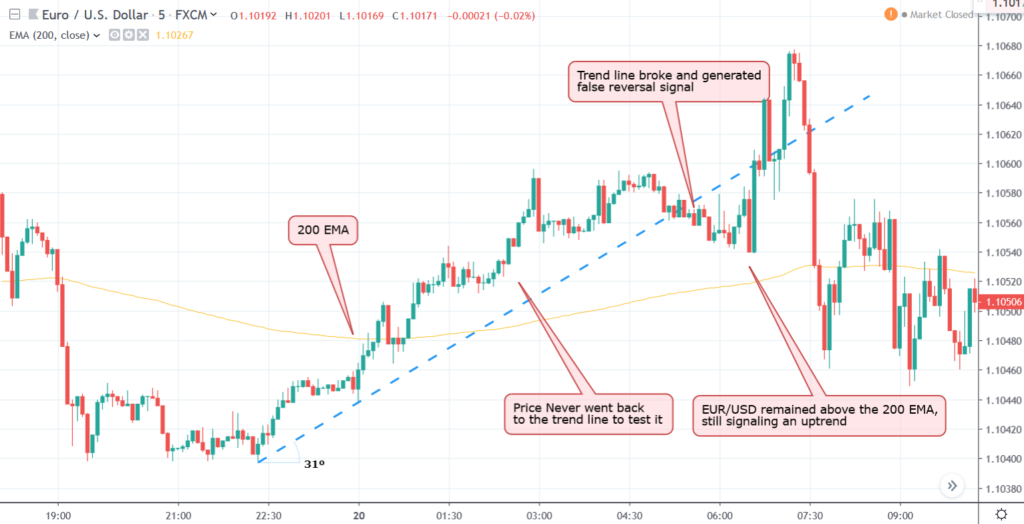
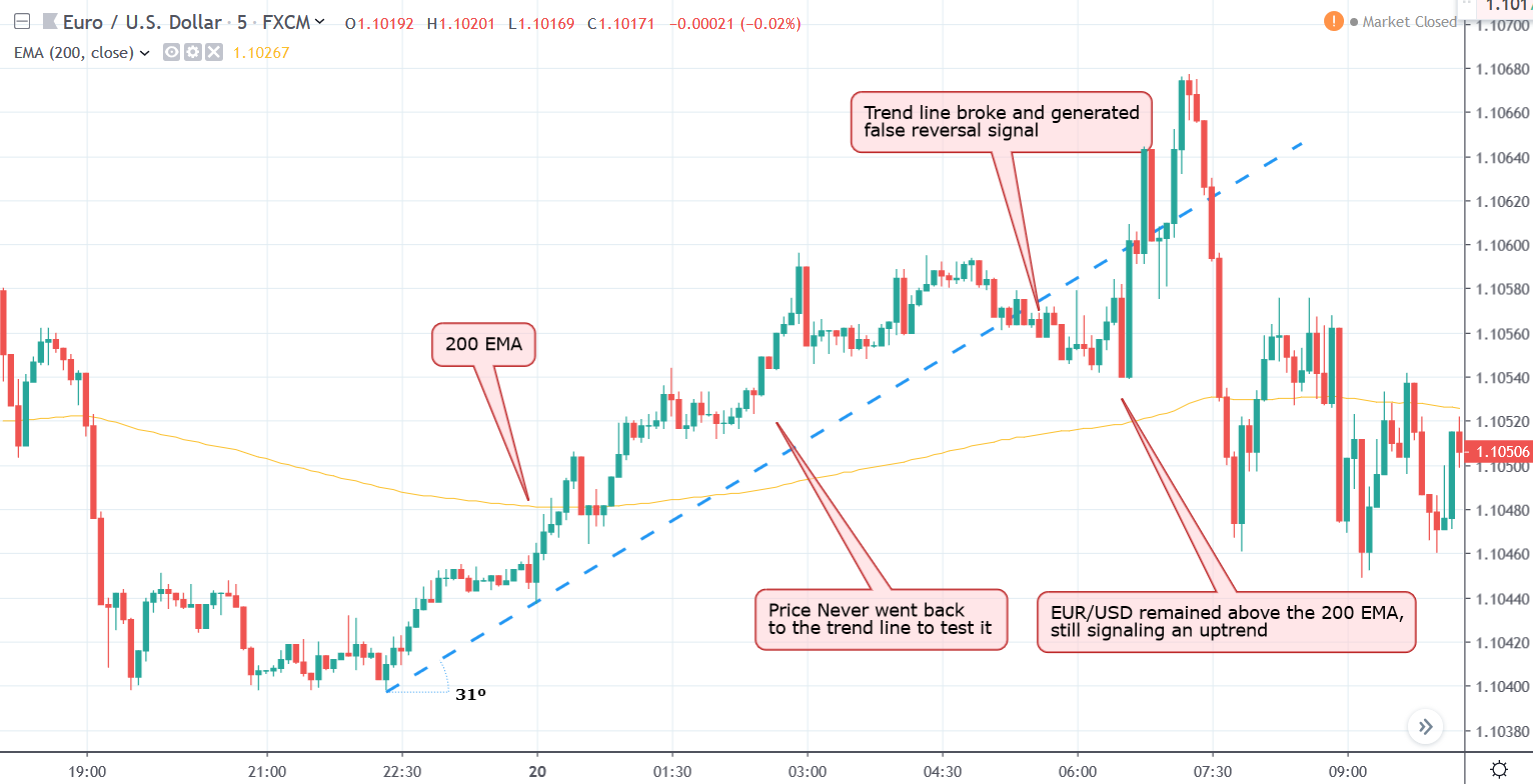
Figure 4: Breaking of a Major Trend Line Can Still Give False Reversal Signal
Moreover, the problem with trading trends with trend lines is sustained retracements. During an uptrend, a Forex pair might start a multi-stage retracement that breaks the uptrend line and similar things can happen during a downturn as well. A google example can be found in figure 4, where the EUR/USD broke below the uptrend line, but soon resumed the trend. If you were using a 200-period EMA, you would still consider it as an uptrend and may re-enter the market based on shorter period MA crosses.
Hence, knowing how to differentiate a retracement from an actual reversal of the trend can end up separating the profitable trend following strategies from the rest.
It is common sense that you should not trade against the trend. Therefore, longer period moving averages can help you identify a long-term trend. But, at the same time, using a shorter period moving average can generate an early signal to identify when is the right time to enter the market and when to get out.
Moving averages can help you get into a trade and continue following a trend. But you can also use moving averages to get out of the trade without sacrificing the bulk of your unrealized profits.
If you wait for an MA cross to happen in the opposite direction to get out, it might be too late. By contrast, if you simply place a stop-loss order above the moving average during a downtrend (or below the moving average during an uptrend) to set a stop loss, the price may test the moving average and resume the trend, taking you out of the trade.
Hence, the best way to get out of a trade would be waiting for the price to close above or below the higher period moving average in a cross before you can take some profits off the table.
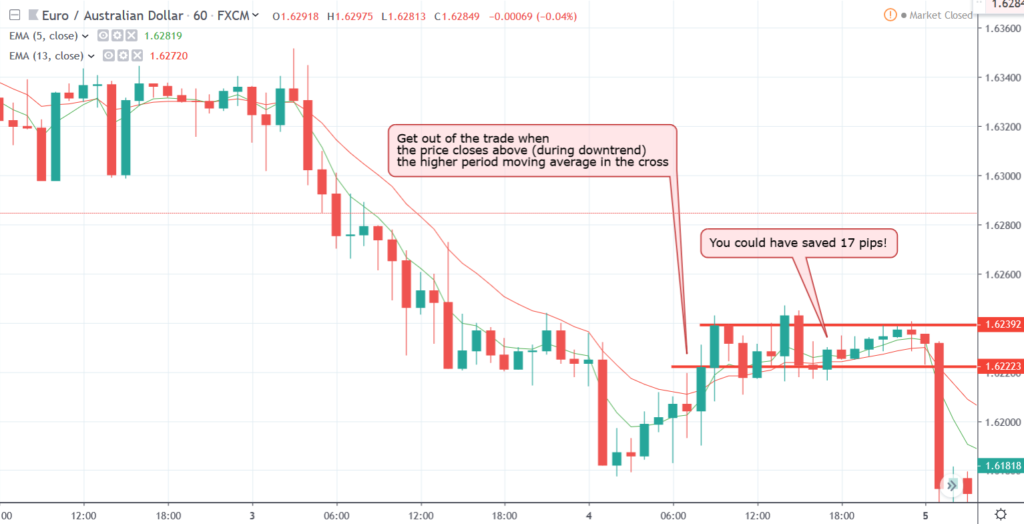
Figure 5: Using Moving Average to Get Out of a Trade Can Save Substantial Unrealized Profits
In figure 5, we can see that the EUR/AUD price crossed the 13 period EMA several times and found strong resistance. However, when a bullish bar finally closed above it, only then the bullish retracement found some momentum. If you have waited for the moving average cross in the opposite direction, you would have left around 17 pips on the table!
That’s why being proactive about protecting your profits can pay off the additional time and attention you might have to invest in a particular trade.
Most moving average strategies are focused on following trends and it is fundamentally different from setting a predefined arbitrary profit target like 100 pips or 200 pips based on your reward to risk ratio expectations.
Trend traders simply try to let their profitable trades run until the market itself provides ample reasons to get out of a trade. Hence, the best way to take profit when applying moving average based strategies would be to get in and out of a trend using the stop loss strategy we discussed above.
However, if you see the price moving closer to strong support or resistance during a trend, you can always scale out and take some profits off the table. You can always re-enter the trade once price has crossed the support or resistance or later when the retracement has ended and you got a re-entry signal from lower period MA crossovers.
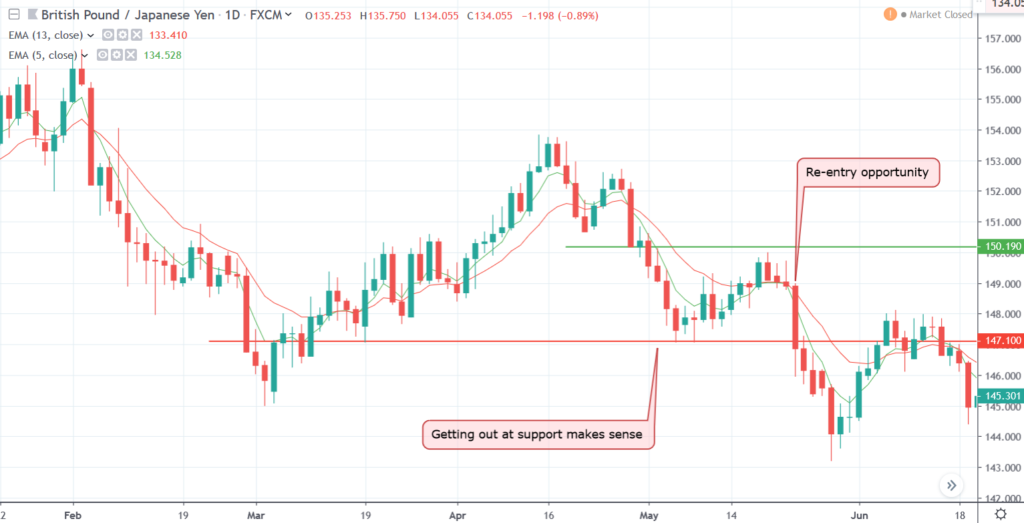
Figure 6: Using Support and Resistance to Take Profit Makes Sense
In figure 6, if you got out near the support around 147.10, then re-entered the market later, you would have made almost 200 pips more compared to keeping the trade open and riding the full retracement towards the resistance near 150.00 level.
Nonetheless, once you see the price crossing the 200 EMA on the opposite side of the trend you are following, it is best to re-evaluate the situation. If you are an aggressive trader, using a 100 EMA would be more appropriate. Once you see price closing below the moving average, be it 100 or 200 EMA, that you use for finding the overall direction, you can start looking for trading opportunities on the opposite direction of the prevailing trend as well.
Moving average strategies are some of the simplest and most effective ways to trade trends in the Forex market. However, you need to keep in mind that large trends are rare, and it takes a lot of patience to catch one of those giant trends.
As a trader using moving averages to fish these large trends, you need to be prepared to live through a number of false signals and you might get stopped out more often compared to range traders, who can find more trades on a daily basis than trend traders. The key to success as a trend trader would depend on your psychology of allowing small losses but letting your profitable trades run during a sustained and long-term trend. The moving average strategies we discussed above will help you find a balanced way to achieve it.

We have been trading supply and demand strategies for over ten years, and they have stood the test of time remarkably well. Supply and demand is...

3 min read
Choosing the right trading journal is essential for traders wanting to analyze performance, refine strategies, and improve consistency. In this...

3 min read
“95% of all traders fail” is the most commonly used trading related statistic around the internet. But no research paper exists that proves this...