3 min read
Scientist Discovered Why Most Traders Lose Money – 24 Surprising Statistics
“95% of all traders fail” is the most commonly used trading related statistic around the internet. But no research paper exists that proves this...

The Turtle traders were a legendary group of traders coached by two successful traders, Richard Dennis and William Eckhardt. They selected 10 people (turtles) with little to no prior trading experience and turned them into winning traders by providing them with a set of very precise trading rules.
The building block of the turtle traders’ success was their advanced risk and money management and their position sizing approach. The following 5 principles explain the most important risk and management principles of the turtle traders’ strategy.
The turtle traders used a volatility based stop loss order, which means that they determined the size of their stop loss based on the average ATR indicator (Average True Range). This also means that for every trade, they used a different stop loss size to react to changing market conditions.
The charts below show why this stop method is so powerful. Both charts show a breakout scenario with very different price dynamics. Whereas the left chart shows very small candlesticks and a low ATR (low volatility), the right chart shows larger candlesticks and a higher ATR value (high volatility). How much sense would it really make to use the same stop loss technique on both breakout trades? Correct, it wouldn’t make any sense. A trader should use a small stop loss for the trade on the left chart and a wider stop loss on the right to account for the different market phases and price behavior.
At the same time, a wider take profit would be used on the right than on the left to capture larger price moves. Adjusting the stop and the target simultaneously will also make sure that the reward:risk ratio stays relatively stable.
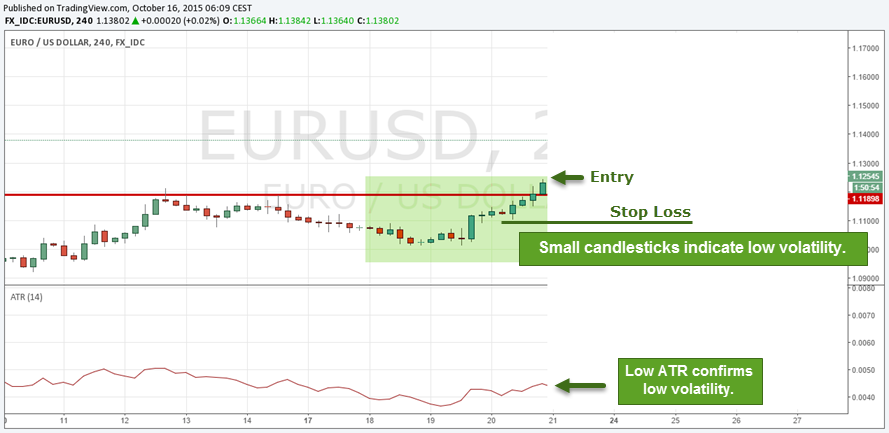
Low volatility results in closer stops (click to enlarge) |
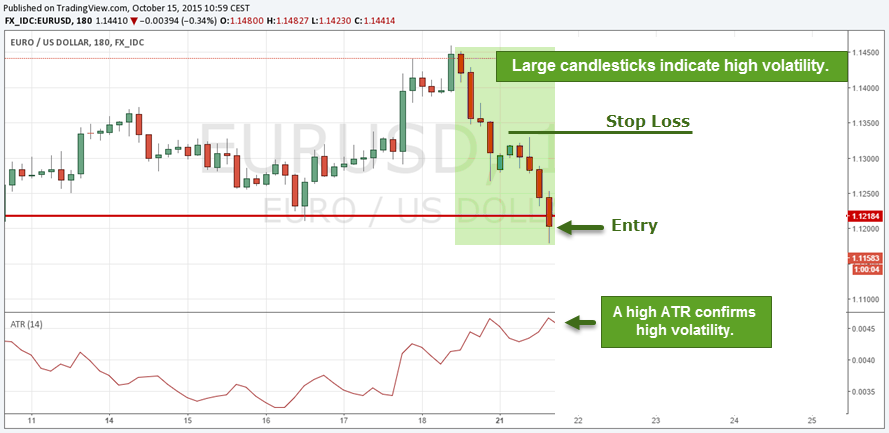
High volatility results in wider stop (click to enlarge) |
Although the stop loss size (in point distance) changed for every trade, the percentage risked always stayed the same. The maximum allowed risk (position size) on any one trade was 2% of the current total account balance. The table below shows two examples of how the turtle traders would adjust their stop and position size based on volatility.
| Volatility | Entry Price | Stop Loss Price | Stop Distance | Account Size | Risk per trade | Contracts to buy |
| LOW | $ 100 | $ 96 | $ 4 | $ 100,000 | 2% ($ 2,000) | 500 |
| HIGH | $ 100 | $ 90 | $ 10 | $ 100,000 | 2% ($2,000) | 200 |
The numbers are for illustration purposes only
Although the risk is identical (2% or $ 2,000), the turtle traders have to buy more contracts during lower volatility because the stop loss is set closer.
Always determine the stop loss distance first. Most amateur traders start by evaluating how many contracts they want to buy and then set their stop loss order so they can achieve a random risk goal. Never start by thinking how many contracts you want to buy/sell before you know your stop loss.
If the turtle traders want to enter two trades in different instruments, they had to look at the correlation between the two markets first.
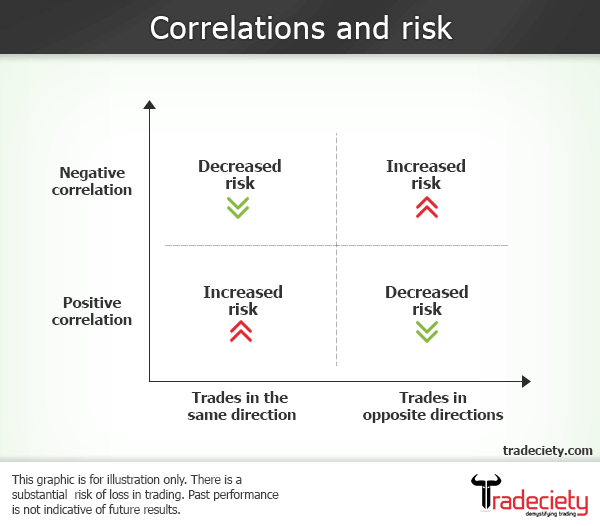
A quick reminder: Correlations describe how “similar” two markets move. A positive correlation means that the two markets move in the same direction and a negative correlation means that they move in opposite directions.
Further reading: How to use correlations in your trading
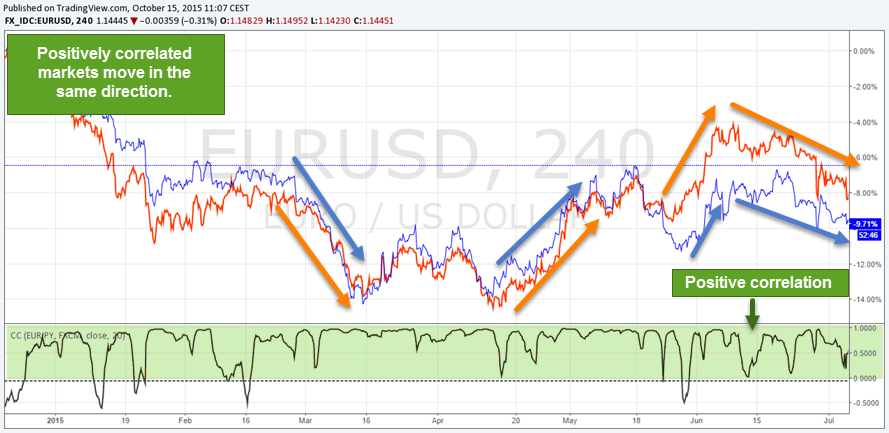
High positive correlation. Two markets move together (click to enlarge) |
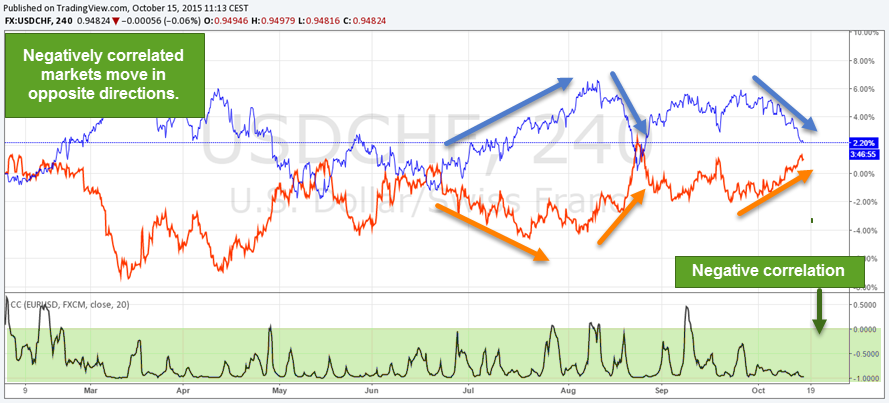
Negative correlation. Two markets move in opposite directions (click to enlarge) |
The two charts above show two completely different scenarios: On the left, you see two price charts with a very high positive correlation (the two graphs almost move identical). On the right, you see two charts with a negative correlation (they move in opposite directions).
A trader who enters two trades in the same direction (two buy or two sell trades) on positively correlated markets increases his risk because it is more likely that the two trades end up the same. A trader who enters two trades in different directions (one buy and one sell trade)in positively correlated instruments will probably (not guaranteed) not have the same result.
(click to enlarge)
When trading positively correlated markets in the same direction, your risk increases. When trading negatively correlated markets in the same direction, you can lower your risk.
The turtle traders did not come up with this strategy, but it has been used by professionals as long as trading exists. It is the irrefutable law of how financial markets work and understanding correlations is of great importance.
The turtle traders usually did not enter the full position size on the first entry. Remember that they were allowed to use 2% per trade, but they usually split their order across multiple entries and added to a winner. Their first position would be 0.5% and after the trade has moved into profits, they would add another 0.5%. They would keep adding to their trade until they reached the maximum of 2%. At the same time, they moved their stop loss behind price to protect their position.
The advantages of adding to a winning trade:
You have to minimize your losses and try to preserve capital for those very few instances where you can make a lot in a very short period of time. What you can’t afford to do is throw away your capital on suboptimal trades. – Richard Dennis
Dennis and Eckhardt understood that the most important thing during a losing streak is not how fast you can recoup your losses, but the degree to which you can limit your losses. Their rule to limit drawdowns during losing streaks shows this principle:
If your account drops 10%, you then trade as if your account has lost 20%. If you lost $10,000 on a $100,000 account, you then trade as if your account only has left $80,0000.
This means that even though your account is now $90,000 and your 2% would be $1,800, you only trade as if your account is $80,000 with a maximum risk of $1,600. This strategy will greatly reduce the losses once a trader enters a significant losing streak and it takes away a lot of emotional pressure as well.
Featured image obtained through unsplash.com


external link:


3 min read
“95% of all traders fail” is the most commonly used trading related statistic around the internet. But no research paper exists that proves this...

3 min read
Trendlines can be great trading tools if used correctly and in this post, I am going to share three powerful trendline strategies with you.

3 min read
Choosing the right trading journal is essential for traders wanting to analyze performance, refine strategies, and improve consistency. In this...