Supply and Demand Trading in 2026
We have been trading supply and demand strategies for over ten years, and they have stood the test of time remarkably well. Supply and demand is...
2 min read
Rolf
Feb 5, 2015 7:00:00 PM
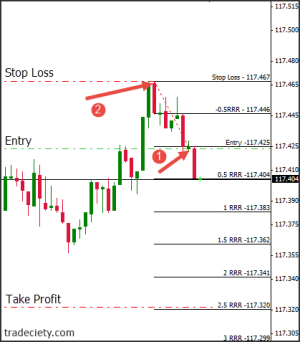
We talked about why the risk:reward ratio is one of the most important concepts in trading and how you should use it to make better trading decisions and easily increase your trading performance. Now is the time to show you how to visual the risk:reward ratio on your charts to help you make better trading decisions. The Fibonacci tool is ideal to use it as a risk:reward ratio tool because it works with ratios and if you are a Metatrader user, you can even modify the ratios on your Fibonacci tool. In the following article we show you step by step how to turn your Fibonacci tool into the ultimate risk:reward ratio gadget.
Be aware that if you change the settings of the Fibonacci tool, it will not show you the actual Fibonacci levels anymore and you have to change the parameters again before you can use the Fibonacci levels!
When you open your Metatrader platform, you find the Fibonacci tool in the menu bar at the top. If you cannot see it go to Insert > Fibonacci > Retracements
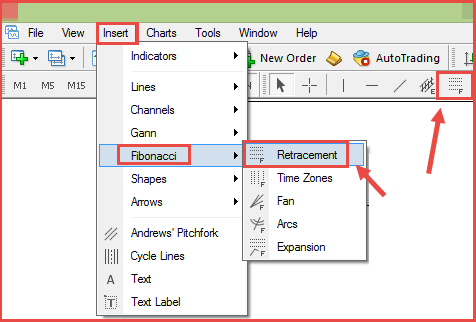
After you have selected the Fibonacci retracements, drag it to the current chart. For now you do not have to worry where to put it, this just serves the purpose to turn the Fibonacci retracements into a risk:reward ratio tool. After you put the Fibonacci on your chart, a window like the one below will open. In the first step, you have to select each item on the left (0 – 0.0 | 0.236 – 23.6 |…) and delete every item from the list until the window is empty.
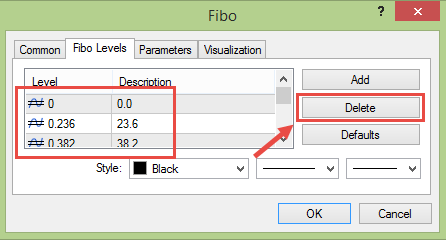
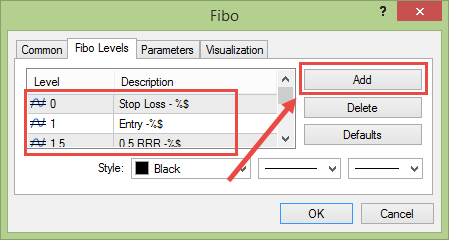
After you have deleted all previous entries, you are ready to enter the new values for the risk:reward ratio display. We provide you with sample data you can use the following:
Level |
Description |
| 0 | Stop Loss – %$ |
| 0.5 | -0.5 RRR – %$ |
| 1 | Entry – $% |
| 1.5 | 0.5 RRR – %$ |
| 2 | 1 RRR – %$ |
| 2.5 | 1.5 RRR – %$ |
| 3 | 2 RRR – %$ |
| 3.5 | 2.5 RRR – %$ |
| 4 | 3 RRR – %$ |
The values you enter on the left under “Level” define the distance. For example, the level of 0 defines the place of your Stop Loss. The value “Level” 1 is the place of your entry. The Fibonacci toll will then use the distance between your Stop loss order and your Entry to calculate the other risk:reward levels.
The values you enter on the right under “Description” is going to be the text you see on your charts with the riskr:reward levels. The code “%$” means that Metatrader will show the actual price next to the risk:reward ratio level.
You are done and are ready to use the risk:reward ratio tool on your charts. First, click the Fibonacci Retracement icon again to select the tool. Then go over to your chart and click on your entry (or potential entry), hold the mouse and drag the tool to the place of your Stop Loss order and release it. Done! You can now see the different risk:reward ratio levels on your charts.
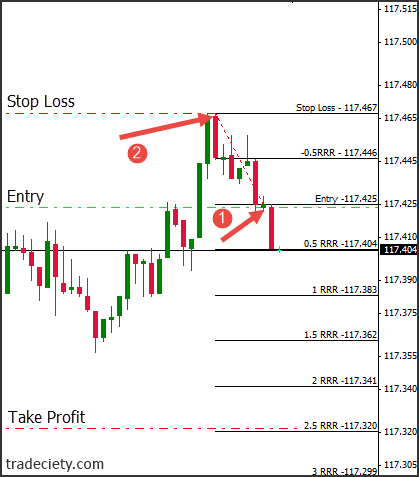
If you want to change back to your Fibonacci levels, delete all the risk:reward ratio levels as done in step 2 and add the actual Fibonacci levels similar to step 3, but use the following parameters.
| Level | Description |
| 0 | 0.0 -%$ |
| 0.146 | 14.6 -%$ |
| 0.236 | 23.6 -%$ |
| 0.382 | 38.2 -%$ |
| 0.5 | 50.0 -%$ |
| 0.618 | 61.8 -%$ |
| 0.786 | 78.6 -%$ |
| 0.942 | 94.2 -%$ |
| 1.0 | 100 -%$ |

We have been trading supply and demand strategies for over ten years, and they have stood the test of time remarkably well. Supply and demand is...

3 min read
Choosing the right trading journal is essential for traders wanting to analyze performance, refine strategies, and improve consistency. In this...

3 min read
“95% of all traders fail” is the most commonly used trading related statistic around the internet. But no research paper exists that proves this...