Supply and Demand Trading in 2026
We have been trading supply and demand strategies for over ten years, and they have stood the test of time remarkably well. Supply and demand is...

Channels are popular trading indicators and for a reason. A trader who knows how to utilize channels the right way can add a great tool to find more confluence factors for his/her price analysis. In this article I will talk about the Keltner Channel and the Bollinger Bands® – and which one you should use.
We talked about the Bollinger Bands® numerous times on this blog already. I, thus, want to briefly repeat what the Bollinger Bands® are doing.
I wrote an in-depth guide about the Bollinger Bands® here: Bollinger Bands® trading 101
Although many traders believe that there is no difference between the Bollinger Bands® and the Keltner Channel, there is! Although they look similar, it is very important to know about the differences. Here is what the Keltner Channel does:
I wrote about the ATR here: ATR indicator guide
As briefly mentioned, the Keltner Channel uses the ATR as its core to define the width of the channel, whereas the Bollinger Bands® use the standard deviation. In the screenshot below, I plotted both indicators – I used Bollinger Band® width – below the price chart.
The ATR shows more fluctuations over the short-term, whereas the Bollinger Band® width seems to be smoother at first glance.
Upon close inspection, it seems like the general directional output seems to be much smoother for the ATR, though. The Bollinger Band® width often changes directions and, thus, indicates a change in market conditions more frequently. The ATR indicator rarely changes the direction completely.
What does this mean for a trader?
It is important to understand that there is no better or worse when it comes to faster vs. slower reacting indicators. Each approach has advantages and disadvantages.
The faster Bollinger Bands® can potentially react faster to a changing market and, thus, provide signals earlier. On the other hand, it is also more likely to provide false-signals based on short-lived price fluctuations. It, thus, highly depends on the trader and the trading style which indicator should be chosen.
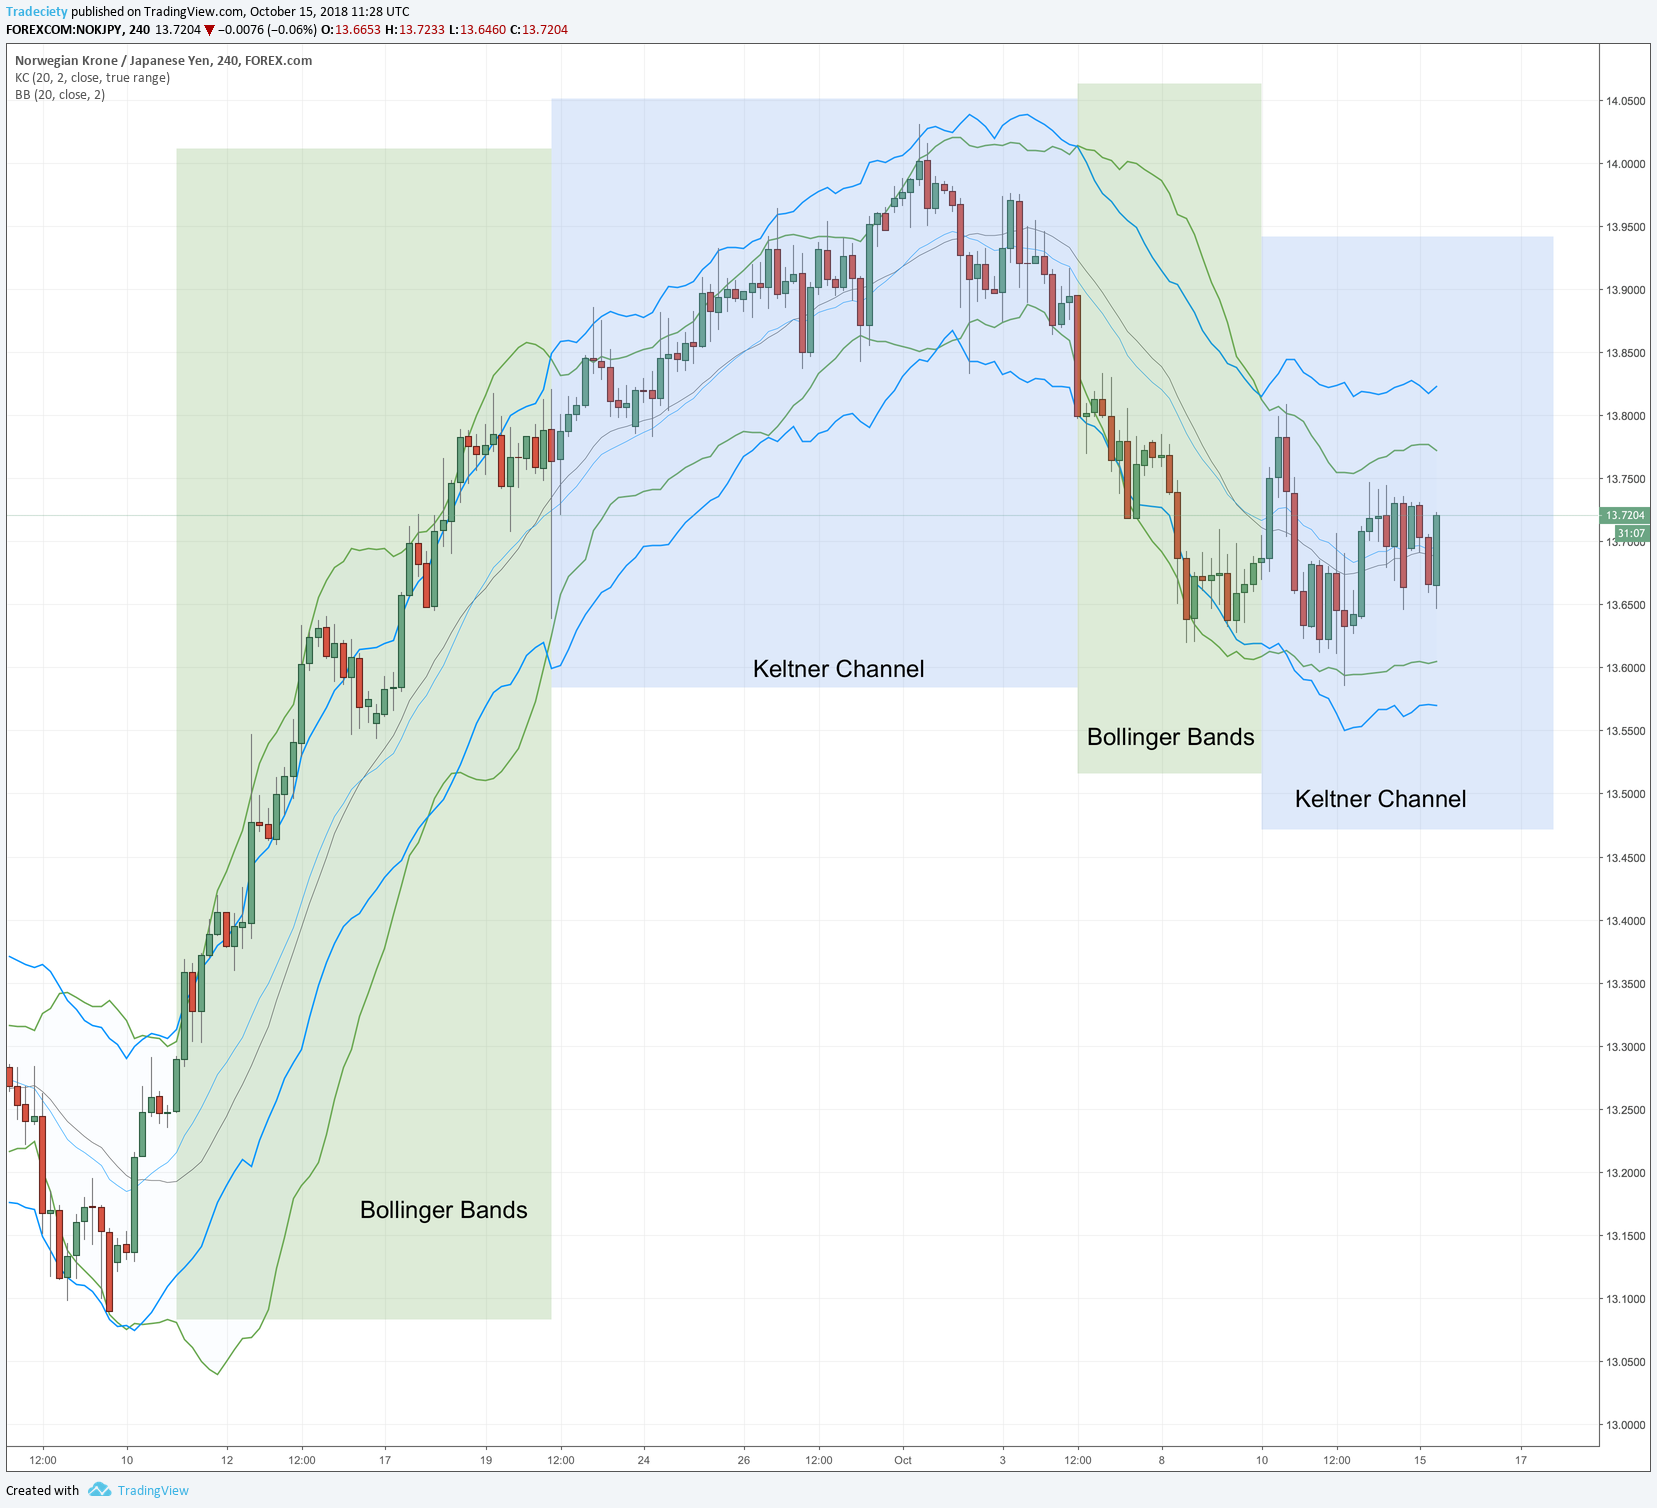
Another interesting signal that deserves further investigation is the Channel-Cross.
The screenshot below shows that the Bollinger Bands® exceed the Keltner Channel during strong trending market periods, whereas the Keltner Channel crosses above the Bollinger Bands when the trend slows down.
This makes sense since the Bollinger Bands® widen faster (based on the calculations of the Std Dev) during periods with long candlesticks.
This phenomenon shows that it can pay off to understand how your indicators are calculated and which formulas are at the core of your indicators. I have talked about the issue of surface-level technical analysis in a previous podcast (Do indicators work?).
The Channel-Cross works best when the general volatility is low – when the trend does not fluctuate back and forth a lot. When volatility increases, the accuracy of the Channel-Cross decreases because both channels will cross each other frequently.
Finally, we can summarize that neither indicator is superior over the other. Personally, I prefer the Bollinger Bands® because of the statistical component of the standard deviation. Without getting too much into statistics at this point, the standard deviation is used to calculate confidence intervals. This means that when the Bollinger Bands® are set to 2 standard deviations, only 5% of all price action should be outside of the bands. A breach, thus, signals a statistically significant occurrence. The ATR and the Keltner Channel is behaving similarly, though, and will often provide similar signals. It comes down to a trader’s preferences. Consistency is the most important aspect here.
What to read next? The complete Ichimoku guide

We have been trading supply and demand strategies for over ten years, and they have stood the test of time remarkably well. Supply and demand is...

3 min read
Choosing the right trading journal is essential for traders wanting to analyze performance, refine strategies, and improve consistency. In this...

3 min read
“95% of all traders fail” is the most commonly used trading related statistic around the internet. But no research paper exists that proves this...