3 min read
Scientist Discovered Why Most Traders Lose Money – 24 Surprising Statistics
“95% of all traders fail” is the most commonly used trading related statistic around the internet. But no research paper exists that proves this...

As a technical trader who knows anything about price action and some common technical indicators, you might as well have come across the phenomena of ‘Divergence’, either as a stand-alone concept to validate your entries, or a tool to simply gauge market momentum.
Today, we will explore a way of analyzing and trading divergences with pure price action.
Implicit Divergence is what I like to call the art of extracting divergent price action straight off the charts without the crutches of lagging technical indicators. Sounds technical enough? Bear with me as I try to explain.
Let’s first take a quick look at Divergence broadly:
Divergence is simply a repetitive market phenomenon where a continuing price trend is ill-matched with a secondary indication implying that the market could be losing steam. That is exactly what the MACD (or the RSI indicator for that matter) with the lower lows matched with higher highs on the price bar chart is supposed to convey.
Implicit divergence, on the other hand, helps you pick off relevant cues directly from the price chart itself. So yes besides a cleaner chart and the awesome feeling of trading naked (Oops!), you also benefit from getting early indications of momentum exhaustion.
What is a technical trader without the obsession with price bars and bar patterns? A gothic mystic who trades with a crystal ball rather than a computer screen maybe? Who knows…
Point is, at some stage we have all been obsessed with bar patterns and the bars’ relative wick and body sizes and open and close levels, as some sort of Holy Grail. Perhaps these concepts already form the pivot in your successful trading methodology.
That obsession – while great in its own regard – often times blinds traders from seeing the holistic picture as made up of bars put next to each other like beads in a string of amazing storylines. Implicit divergence then, is really just another fun chapter.
Implicit divergence has roots sunk deep into the basic concept of a trend. That is, price should continue to post successive highs when in an uptrend and successive lows when in a downtrend.
However, taking a closer look at price action, it is sometimes fairly easy to tell when price still seems stuck in a trend but could be losing steam. If that is the case, often bars will venture beyond the range of the prior bar in the direction of the trend but will struggle to close strongly. The phenomenon is also frequently assisted by regular wicks on candlesticks protruding in the direction of the trend, as order flow from the other side starts kicking in.
Let’s take a look at a live example:
We’re looking at the USD/CAD daily chart
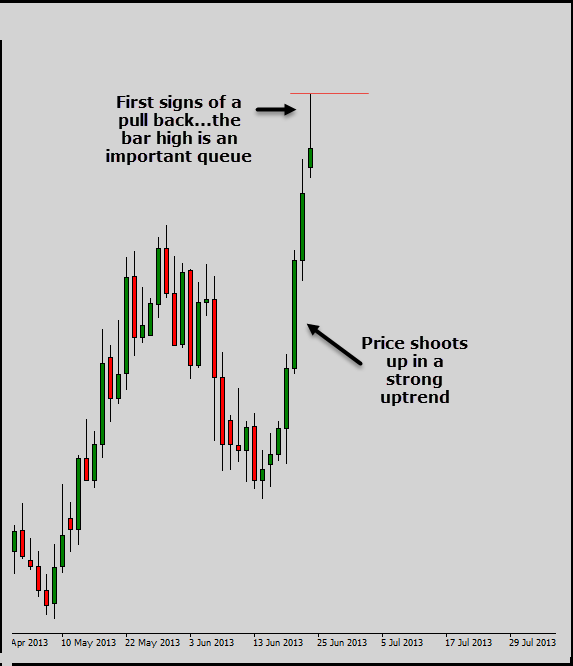
Here we have a nice strong uptrend that is showing first sign of weakness as price trickles back down to close weakly and leave behind a wick. This is close to a pin bar but not quite with the close not being within the prior bar. The weak close and the long wick (especially the high on that bar as marked out) is a crucial queue for us.
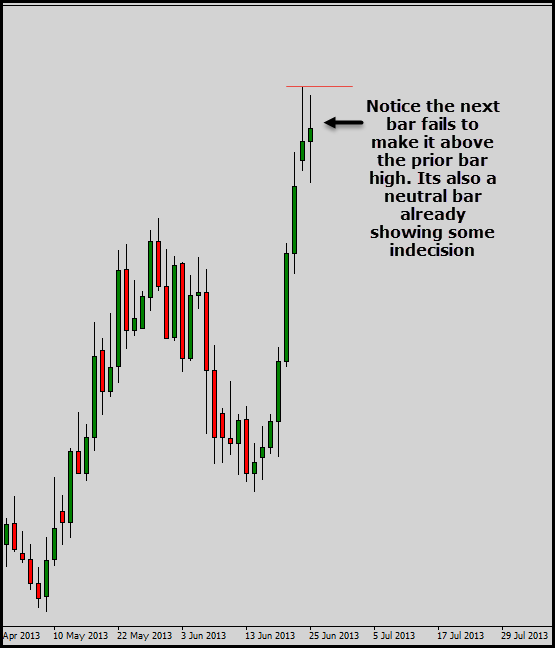
The next bar reveals more of the story. Clearly we seem to have hit some kind of resistance here. It is testing times for the bulls.
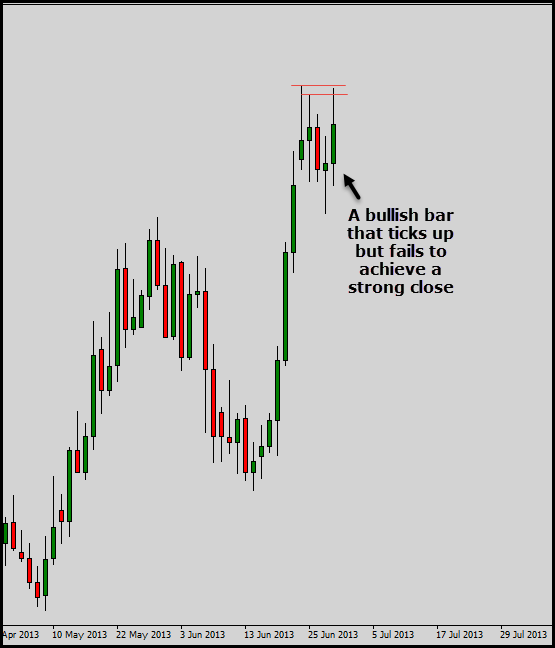
We now have a serious problem. Notice how recent bars are really struggling to close past prior bar highs. You might argue the latest bar actually does close well above the second last bar, but what I am teaching you here is to look at the holistic picture.
Implicit Divergence does not entail that every succeeding bar needs to necessarily fail to close beyond the prior bar, even though such a situation is rather neat and damn well obvious to spot.
Rather it encourages looking out for weak closes on bars indicating a trend that is intact yet appears sluggish and weak.
We again have a bullish bar but look at the weak close and the wick protruding in the direction of the trend. Price is clearly headed nowhere.
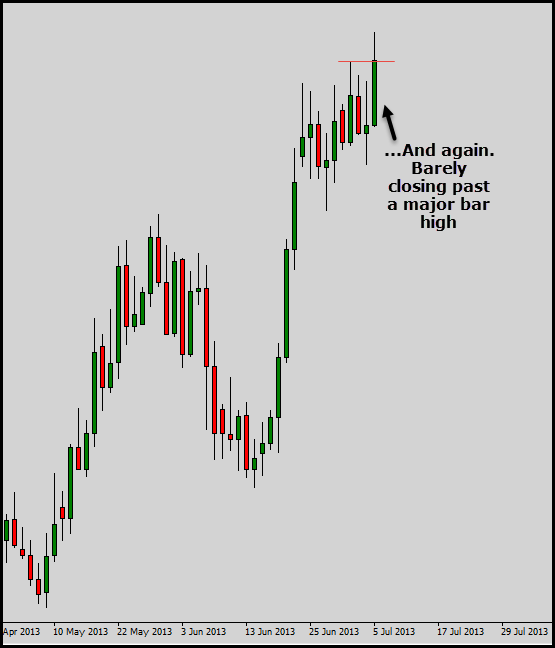
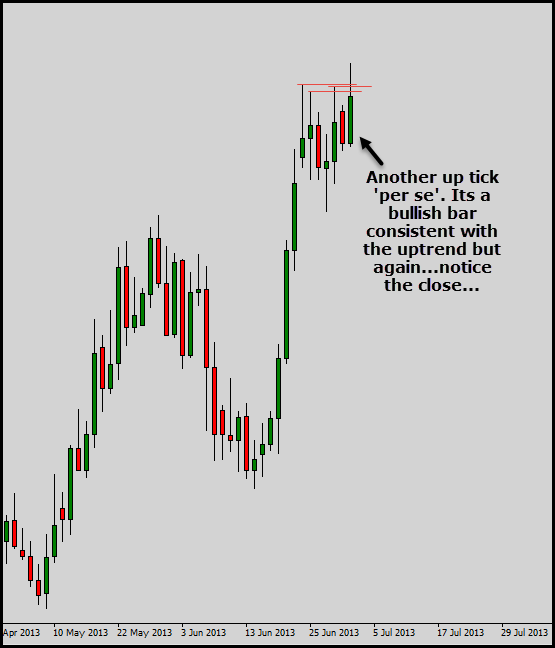
Another bullish bar that seems to be entangled within the prior bar ranges. It closes just above a major bar high from the recent past, and also above the prior two bar highs, but we have a strong buildup to the implicit divergence story.
Care to think how many traders would actually look at that as a “strong” bar likely signaling the continuation of the uptrend? These are the traders who perhaps gathered no queues from the preceding price action and are too glued to just spotting and trading standalone bar patterns with no context.
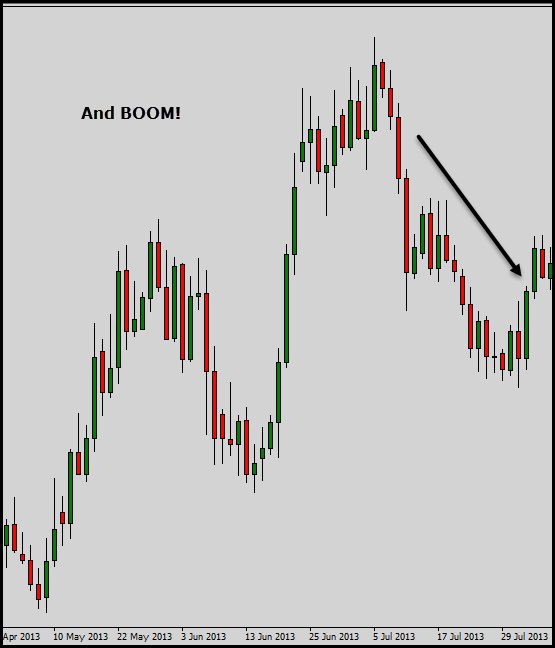
Here we go. An inside bar indicating even more indecision before we finally have a pop down.
Combine this bar-to-bar story making with the broader context of major long-term support and resistance levels and other aspects (trend lines, MAs, round numbers etc) and you have solid groundwork laid for a successful trading system.
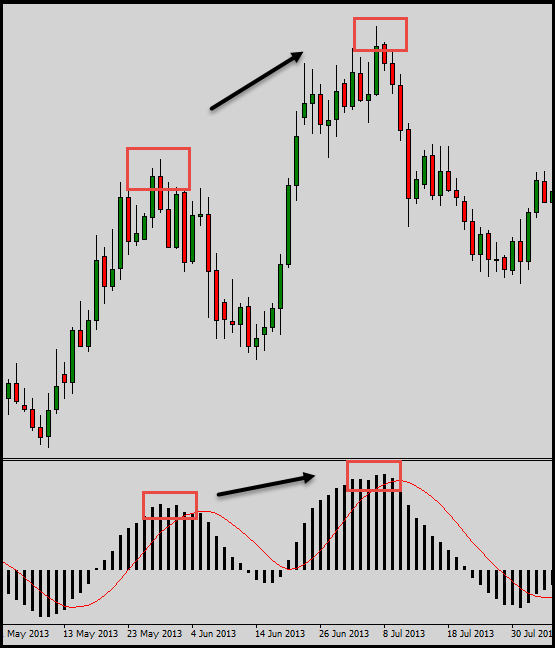
Oh…and for the lovers of conventional divergence: there was actually no conventional divergence in this case at all.
If you look closely enough, there are actually other neater occasions on the same chart where implicit divergence helped us pick a swing point.
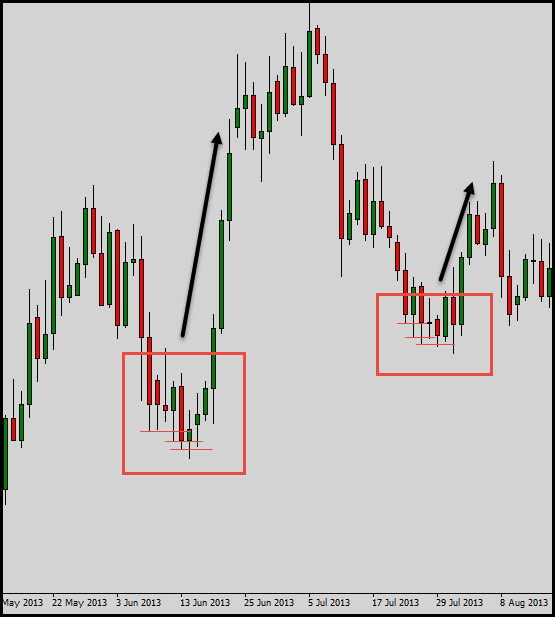
How neat are these huh?
I totally admit these have been cherry picked and carefully selected, but they needed to be to get the point across in a clear manner, and I hope I achieved that.
Having said that, I urge you to start looking at your price charts as part of a broad connecting picture and with enough chart time I assure you, ideas like implicit divergence do become second nature. Implicit divergence as I said is really just one fun chapter among many, many others.


external link:


3 min read
“95% of all traders fail” is the most commonly used trading related statistic around the internet. But no research paper exists that proves this...

3 min read
Trendlines can be great trading tools if used correctly and in this post, I am going to share three powerful trendline strategies with you.

3 min read
Choosing the right trading journal is essential for traders wanting to analyze performance, refine strategies, and improve consistency. In this...