3 min read
Scientist Discovered Why Most Traders Lose Money – 24 Surprising Statistics
“95% of all traders fail” is the most commonly used trading related statistic around the internet. But no research paper exists that proves this...
The STOCHASTIC indicator is among the most popular trading indicators and rightfully so. The STOCHASTIC indicator is a great momentum and trend-following indicator. It can assist traders in understanding trend dynamics and improve their chart reading.
However, I am always astonished that many traders don’t really understand the indicators they are using. Or, even worse, many traders use their indicators in the wrong way and then make bad trading decisions that could have been easily avoided.
In this article, I will help you understand the STOCHASTIC indicator in the right way and I will show you what it does and how you can use it in your trading.
The STOCHASTIC indicator shows us information about momentum and trend strength. As we will see shortly, the indicator analyses price movements and tells us how fast and how strong the price moves.
This is a quote from George Lane, the inventor of the STOCHASTIC indicator:
“Stochastics measures the momentum of price. If you visualize a rocket going up in the air – before it can turn down, it must slow down. Momentum always changes direction before price.” – George Lane, the developer of the Stochastic indicator
Before we get into using the Stochastic, we should be clear about what momentum actually is.
Investopedia defines momentum as “The rate of acceleration of the price of a security.” via Investopedia
I am always a fan of digging into how an indicator actually analyzes price and what makes the indicator go up and down. That way, we can gain important insights about the best application for the indicator quickly.
The stochastic indicator analyzes a price range over a specific time period or price candles; typical settings for the Stochastic 14 periods/price candles.
The Stochastic indicator takes the highest high and the lowest low over the last 14 candles and compares it to the current closing price. It is as simple as that.
We will see how this works with the following two examples.
When your Stochastic is at a high value, it means that the price closed near the top of the range over a certain time period or a number of price candles.
The graphic below marks the lowest low and the highest high of the last 14 candlesticks.
The high is at 0.6283
The low is at 0.6258
And the close is at 0.628
The range between the high and the low is 0.0025 (0.6283 - 0.6258).
And the distance between the close and the highest high is 0.0003 (0.6283-0.628).
All we do now is divide 0.003 by 0.0025 to check how close is the price to the absolute high of that range. The calculation gives us 12%.
This means that the current close is 12% away from the top and 88% (100%-12%) from the bottom.
And, indeed, the Stochastic in this example is at 88.
The Stochastic indicator, therefore, tells you how close has the price closed to the highest high or the lowest low of a given price range.
-1.png)
The math is actually quite simple.
You just check the total distance of the range between the highest high and the lowest low. And then all you do is see how close the price is closing to the highest high or the lowest low.
Conversely, a low Stochastic value indicates that the momentum to the downside is strong.
In the screenshot below we can already see that the price has moved lower significantly over the last 14 candles. And we can also see that the current close is relatively close to the absolute low. Only a small candlestick wick is sticking out lower.
Just by understanding that we can already assume that the Stochastic indicator has to be very low since the Stochastic measures how close the price is closing to the lowest low and how far away the price is from the highest high.
And, indeed, the Stochastic indicator shows a value of 13. This means that the price is 13% away from the lowest low and 87% away from the highest high.
-1.png)
The misinterpretation of overbought and oversold is one of the biggest problems and faults in trading. We’ll now take a look at those expressions and learn why there is nothing like overbought or oversold.
The Stochastic indicator does not show oversold or overbought prices. It shows momentum.
Generally, traders would say that a Stochastic over 80 suggests that the price is overbought and when the Stochastic is below 20, the price is considered oversold. And what traders then conclude is that an oversold market has a higher chance of going down and vice versa. This is wrong and very dangerous!
As we have seen above, when the Stochastic is above 80 it means that the trend is strong and not that it is likely to reverse. A high Stochastic indicates that the price is able to close near the top and kept pushing higher. A trend in which the Stochastic stays above 80 for a long time signals that momentum is high and not that you should get ready to short the market.
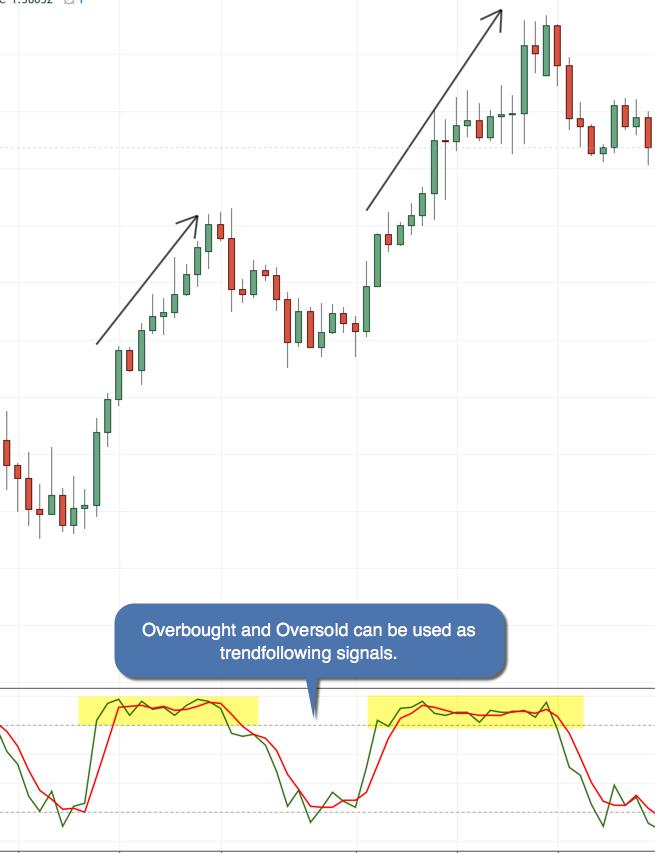
The image below shows the behavior of the Stochastic within a long uptrend and a downtrend. In both cases, the Stochastic entered “overbought” (above 80), “oversold” (below 20) and stayed there for quite some time, while the trends kept on going.
The belief that the Stochastic shows oversold/overbought is wrong and you will quickly run into problems when you trade this way. A high Stochastic value shows that the trend has strong momentum and NOT that it is ready to turn around.

Finally, I want to provide the most common signals and ways how traders are using the Stochastic indicator:
Breakout trading: When you see that the Stochastic is suddenly accelerating in one direction and the two Stochastic bands are widening, it can signal the start of a new trend. If you can also spot a breakout out of sideways range on your price chart, even better.
Trend following: As long as the Stochastic is above 80 it confirms a strong bullish trend. And a Stochastic below 20 points to a strong bearish trend.
Strong trends: When the Stochastic is in the "oversold/overbought area", don’t fight the trend but try to hold on to your trades and stick with the trend.
Trend reversals: When the Stochastic is changing direction and exits the overbought/oversold areas, it can foreshadow a trend reversal. Especially when the indicator signal is followed by reversal signals on your price charts.
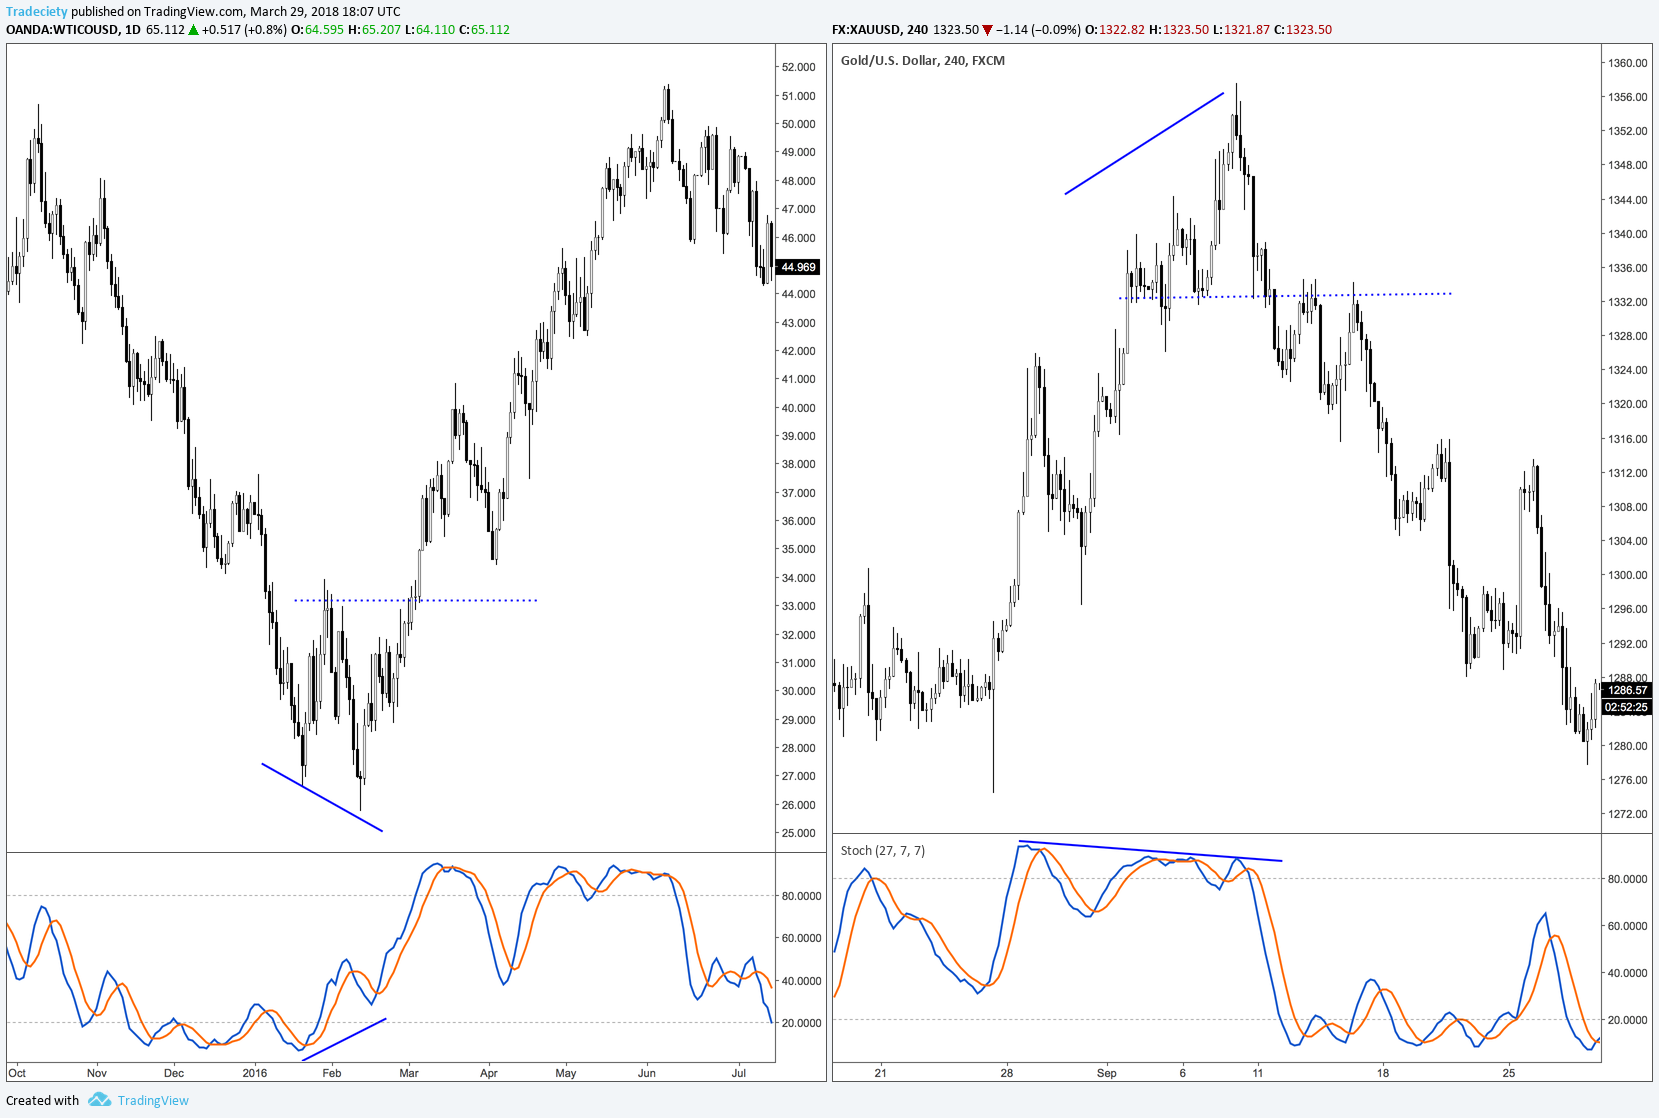
Divergences: As with every momentum indicator, divergences can also be a very important signal here to show potential trend reversals, or at least the end of a trend. A divergence is a situation where the indicator and the price action are showing opposing signals.
On the left in the screenshot below, the price is making lower lows during the downtrend, whereas the indicator is already making higher lows. The Stochastic shows that the last bearish trend wave is less strong than the previous ones.
As with any other trading concept or tool, you should not use the Stochastic indicator by itself. To receive meaningful signals and improve the quality of your trades, you can combine the Stochastic indicator with those 3 tools:
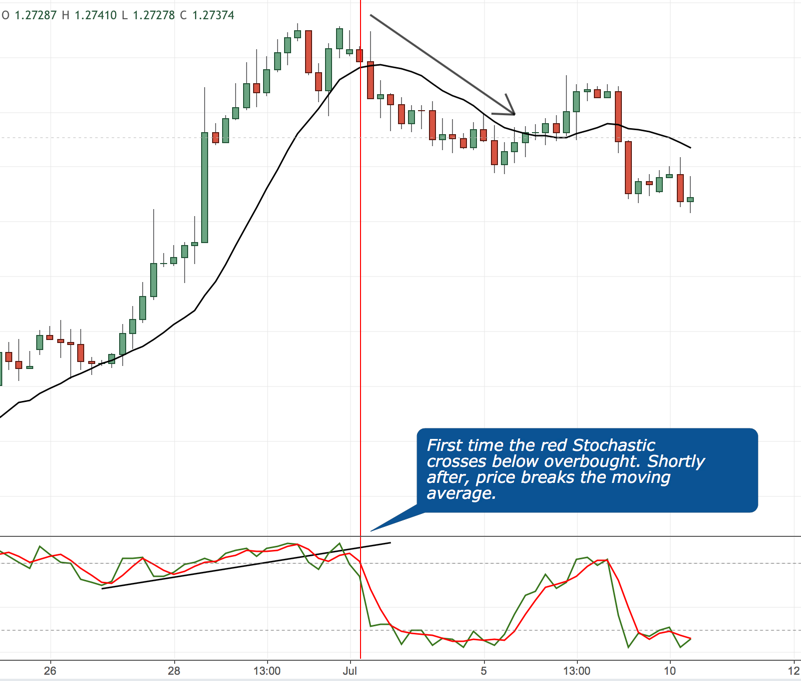
Moving averages: Moving averages can be a great addition and they act as filters for your signals. Always trade in the direction of your moving averages. As long as the price is above the moving average, only look for longs – and vice versa.
The price stayed above the moving average for an extended period of time while the Stochastic was close to the 80 level, confirming a strong bullish trend.

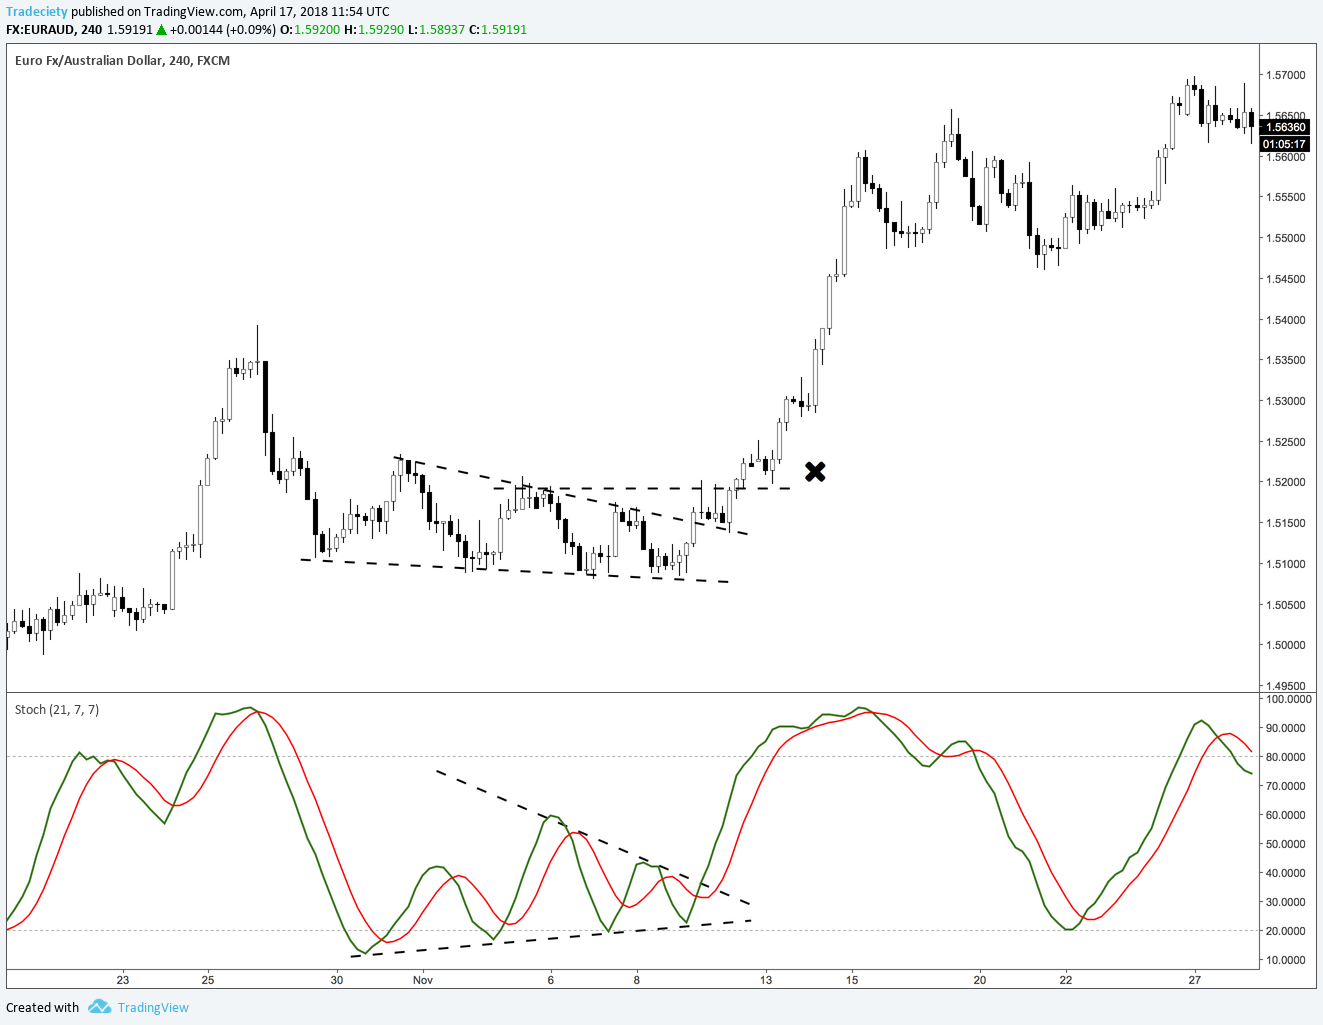
Price patterns: As a breakout or reversal trader, you should look for wedges, triangles, head and shoulders, or rectangles. When price breaks such a formation with an accelerating Stochastic, it can potentially signal a successful breakout.
Trendline: Especially Stochastic divergences or Stochastic reversals can be traded effectively with trendlines. You need to find an established trend with a valid trendline and then wait for the price to break it with the confirmation of your Stochastic.

Although the Stochastic indicator is a very simple tool and only looks at a few key data points on your charts, it can provide meaningful trend information.
The benefit of having an indicator on your chart is that it adds an objective confluence factor to your decision-making. Many traders struggle because their trading approaches are too discretionary and their decisions are often too subjective. Adding objective tools to your trading can often make a big difference.
Furthermore, I want to highlight the importance of getting to know your trading tools. As with the example of the Stochastic indicator, many traders may realize now that their understanding (especially when it comes to oversold and overbought) have been completely wrong. A wrong application of your trading tools leads to incorrect trading decisions as well. It is therefore essential that you take the time to fully understand the tools you are using. And as we have seen with the Stochastic, this is often no rocket science and many indicators follow simple yet effective principles.


external link:


3 min read
“95% of all traders fail” is the most commonly used trading related statistic around the internet. But no research paper exists that proves this...

3 min read
Trendlines can be great trading tools if used correctly and in this post, I am going to share three powerful trendline strategies with you.

3 min read
Choosing the right trading journal is essential for traders wanting to analyze performance, refine strategies, and improve consistency. In this...