Supply and Demand Trading in 2026
We have been trading supply and demand strategies for over ten years, and they have stood the test of time remarkably well. Supply and demand is...
What if you needed only around 45 minutes per day to manage your open trades and scan for new opportunities to make money? Enter: Finviz and the Stock Market.
I’m a classic technical analyst/chartist. Always have been, always will be. I also have always been a daytrader, but I am transitioning more and more to longer-term trading Stocks on the Daily charts.
Why? Because this has always been my ultimate goal, I just didn’t have enough money but that problem has solved itself over the years.
I am running around 30 open positions at the moment and I want to show you how I use Finviz to scan for setups.
Right now, I only scan for technicals. I will expand my use of Finviz to descriptive and fundamental criteria in the future after I have done some research.
My research basically looks like this: I trade every great technical setup I see. Then I track the descriptive and the fundamental data in my Edgewonk trading journal and a few months later I will be able to look through my database for profitable indicators/filters that go along with my technical setups.
When you go to Finviz, click on Screener. Then make sure you visit the “Technical” tab.
Here, we have multiple options. Firstly, notice the “Signal” filter on top which will scan for possible setups based on classic charting principles or performance indicators.
I don’t use this filter, and neither the “Pattern” filter, because I prefer to draw those myself as soon as I found my favorite Candlestick formations, but maybe you like them.
What I am mainly interested in here are the “Change from Open” and “Candlestick” filters. Let’s look at the “Candlestick” filter.
Here, we are interested in every single filter – we go through them one by one and then check whether the charts show us Pinbars or trend-continuation bars in the case of Dojis. The Marubozus help us find engulfing candles.
The other filter I am interested in is the “Change from Open” – simply choose “Up 3%” and “Down 3%” successively in order to find engulfing candles, as well.
After applying a filter, it is important that you switch your chart view for faster scanning because you will only get a list of potential trade candidates, but not a visual display of them.
Here, we filtered the 7000 stocks that Finviz has on its radar for 260 Hammer bars. Now we can quickly scroll through them and see if any of them catches our interest.
The scanner is by far not perfect and presents a lot of trash which I can visually quickly sort out. Going through these 260 charts takes me roughly 2 minutes. Then we simply move on to the next filter.
So let me quickly go through the filters until I find something that looks ok..then we move on to the next step.
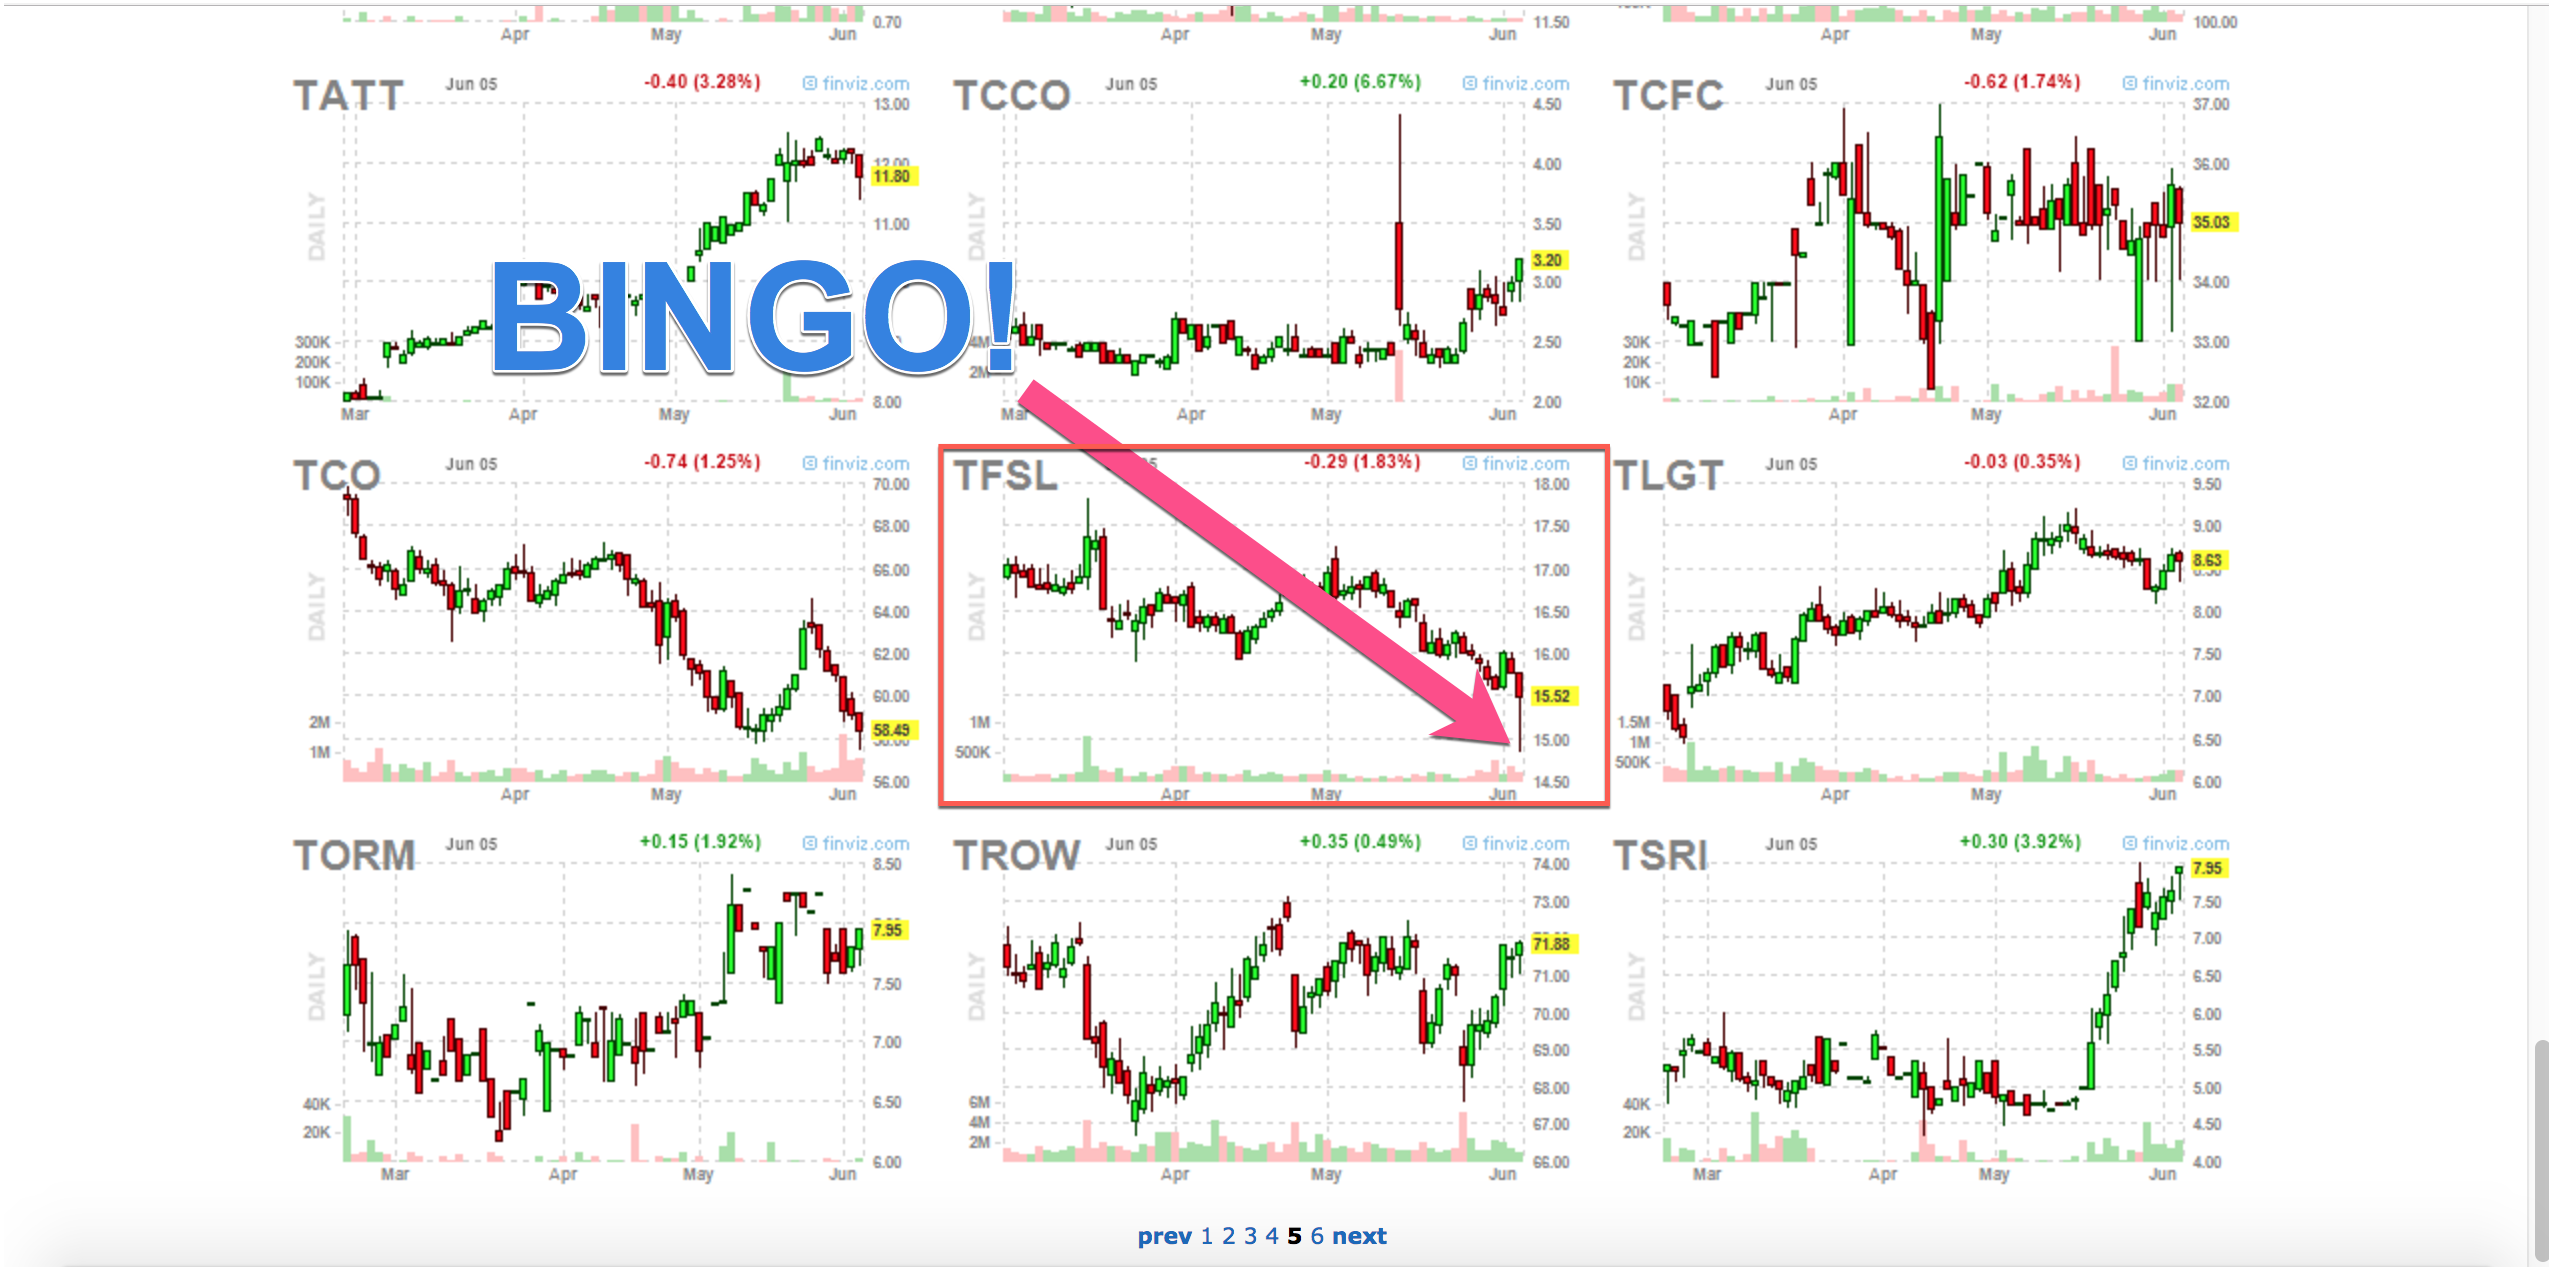
Aaannd…we got one. Take a look at the pic below – a long wick to the downside, maybe a level broke or got faked out…it is clearly a swing point.
Let’s open a bigger chart to see what we can find (simply right-click the mini-chart and open it in a new tab so you don’t have to jump back and forth all the time. I do this with all potential charts first before going through them one by one).
At first sight, I can see a downsloping channel which we just got rejected from, we are definitely going counter-trend here. Not my favorite setup, but good enough for me to take an even closer look.
This chart now comes into the selection of possible setups for the day. After scanning through all the stocks with all the filters and manually going through the Futures, Indices and Forex markets that Finviz does not cover, I will analyze all these candidates much closer on TradingView.
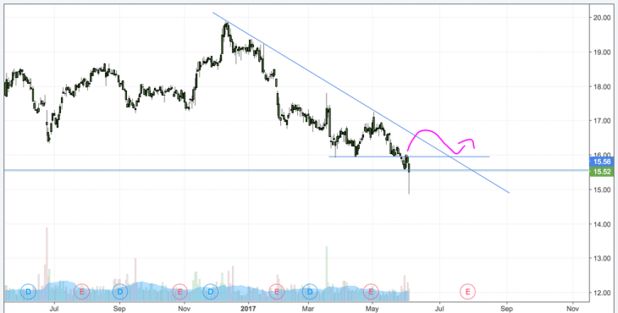
This is our setup from above. We faked out one of the most beautiful levels I have seen in a long time, but I see a few problems with this one.
This is the beauty when you have plenty of choices. Out of 7000 Stocks and around 100 Forex and Futures instruments each day, I can easily pick the 2-3 best setups and only trade those without feeling bad. Passing on setups has never been this easy for me.
However, I still see potential in this trade if it makes a local structure and trendline break, as for example a Head&Shoulders.

So this will be put on my watchlist and I will observe it over the coming weeks to see what happens to this. Also, out of curiosity, I want to see how this setup plays out. Trades not taken have to be analyzed as well regarding their performance.
After I went through said process with all potential candidates, I check how much margin I have left in my risk-management plan and then allocate funds to the various scenarios, depending on the strength of the setups.
All this takes me roughly 1 hour each day, sometimes more, often less, and then I enter my orders and don’t look at my trading station again until the next morning.
I wish, Finviz would cover more markets but for now, I am absolutely happy with it. Also, if you pay for the Elite account, filtering will be much more convenient and you will save even more time.
This approach to the markets can easily be trained and tested while still daytrading or fulfilling other duties, which makes it so appealing.
Due to the sheer mass of trade setups, we can trade with a minimal risk and still reap the same rewards as with daytrading.
That’s it for now with the second article about my Stock trading, more to follow.

We have been trading supply and demand strategies for over ten years, and they have stood the test of time remarkably well. Supply and demand is...

3 min read
Choosing the right trading journal is essential for traders wanting to analyze performance, refine strategies, and improve consistency. In this...

3 min read
“95% of all traders fail” is the most commonly used trading related statistic around the internet. But no research paper exists that proves this...
