
Supply and Demand Trading in 2026
We have been trading supply and demand strategies for over ten years, and they have stood the test of time remarkably well. Supply and demand is...

It comes across as a general consensus among technical traders that former swing points matter tremendously when it comes to locating potential future trouble areas for price. However, little light is shed on the actual dynamics of these swing points.
In this article I will elaborate on the importance of a particular rhythm followed by some swing points that make them extremely high probability locations to take trades off of. You are free to use whatever trading triggers you love using (candlestick formations, a combination of technical indicators etc), but after having gone through this article I hope you will bag a great tool for your trading arsenal that you can use as part of your existing trading methodology.
Let’s begin by simply stating what swing points are and why they are important:
A swing point on your chart is simply a turning point for price in the past, either to create a considerable pullback into an established trend, or to reverse it altogether. When a turning point creates a mere pullback it can be classified as a minor swing point. When it creates the base to reverse a trend, it is classified as a major swing point.
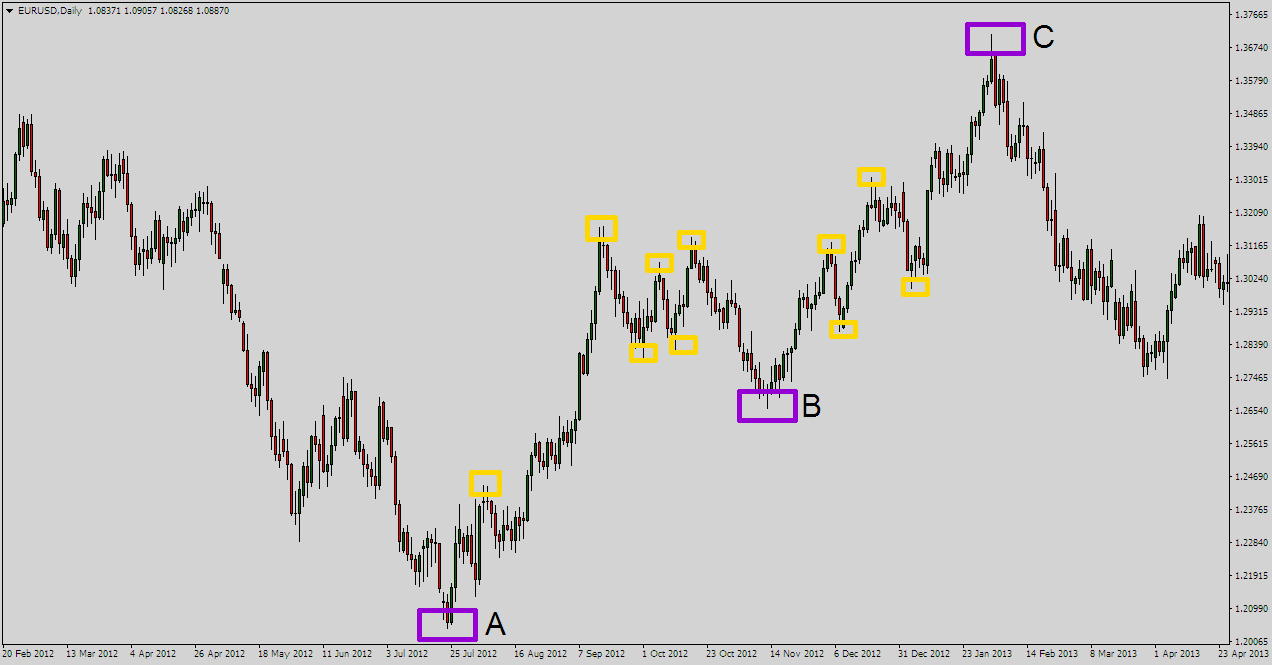
In the picture above drive your attention to the uptrend stretching from point A to point C. The major swing points are marked in violet colored boxes, and the minor ones are marked with yellow boxes.
Obviously, swing point A is a major one because it not only initiates the uptrend it actually also reverse the downtrend just prior. Point B marks a major retracement and the clear resumption of the uptrend, again classifying that turning point as a major swing point. Point C again marks a major (more than 61.8%) retracement of the uptrend itself, giving it the stature of a major swing point.
You will notice that the minor swing points marked in yellow have no major impact on the trend itself and denote mostly a period of sideways consolidation or a minor pullback into the dominant uptrend.
Swing points matter because they denote an important piece of history, and with the realistic assumption that history often repeats itself (quite often in the financial markets), they mark key zones that a lot of technical and even fundamental traders follow closely. The word is: If price bounced off a certain price level aggressively in the recent past it will likely do it again.
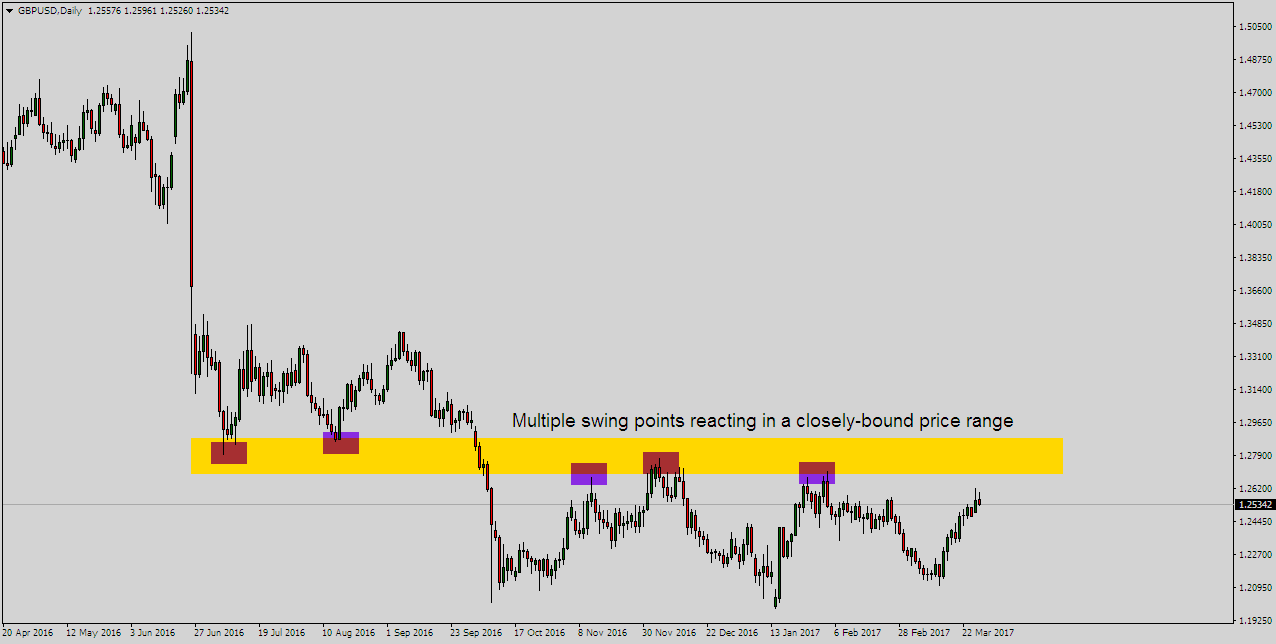
It is a general understanding among technical traders that the more times that price bounces off a certain area on the chart the stronger the area is. That is exactly where the idea of horizontal support and resistance areas comes from.
Of course these are very valid teachings, and yes an area is generally considered a strong one if price rebounds off of it many times, creating multiple swing points.
However, in the urge to locate larger support and resistance areas with several neatly lined up swing points, traders often ignore the importance of a single outstanding swing point – which I call the lone wolf.
The lone wolf is simply a MAJOR swing point that just like a big long pin bar – stands out from the chart – and imposes importance on its own.
Just like closely bound swing points yield a solid support and resistance level that you can trigger trades off of, you should not ignore the importance of a major swing point sticking out like a sore thumb. Unlike a normal swing point, these can be extremely high-probability trading locations.
And thinking about it, it makes sense. What kind of order flow do you think is needed to hurl price away for good, with no retests needed? One that is pretty strong for sure. And well, if price has rebounded hard from a particular price level in the past, it is fair to assume it can well do it again.
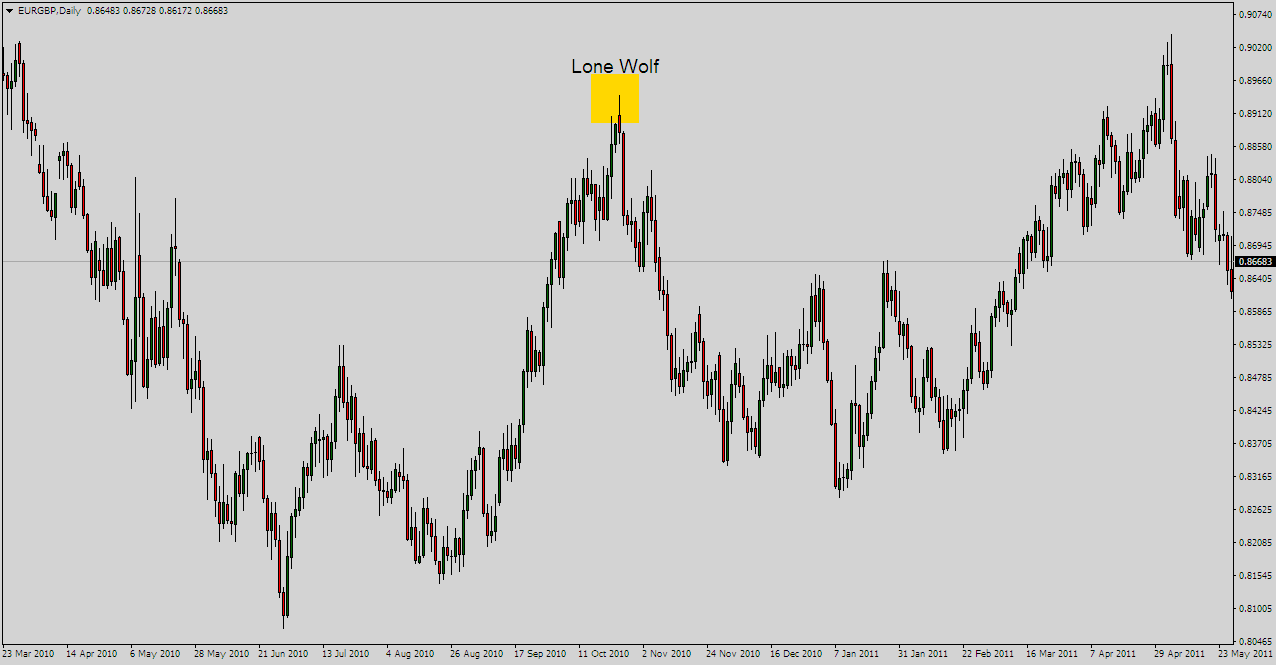
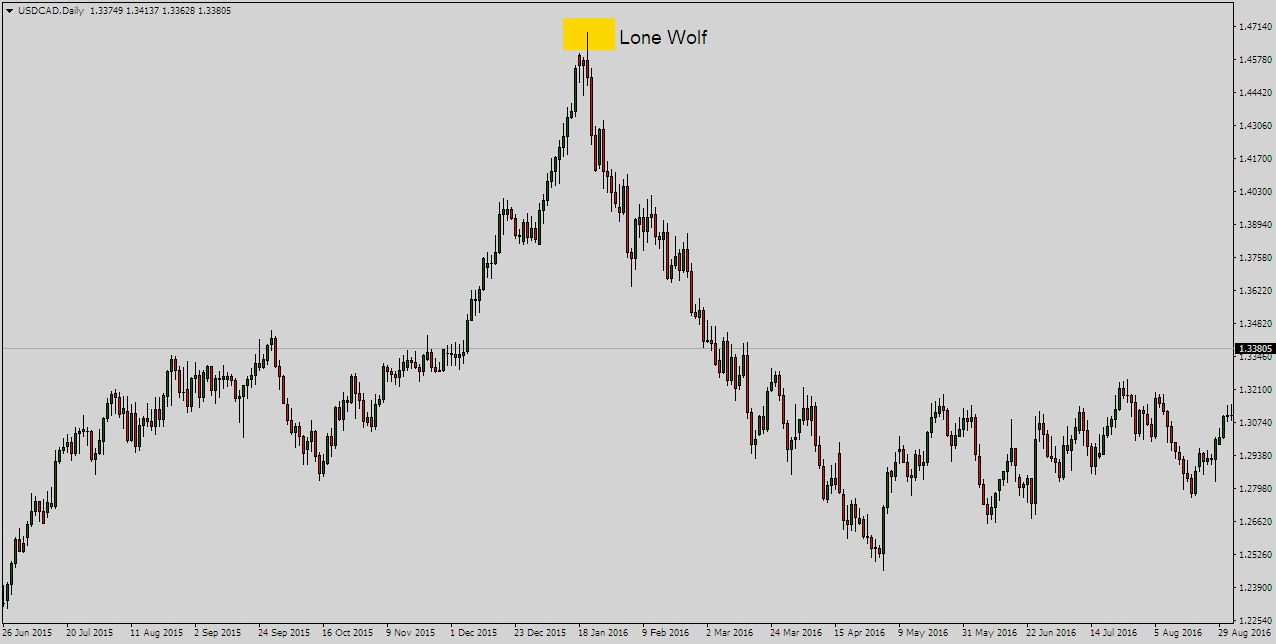
As you can see these are major swing points located in isolation with few to none minor swing points in the vicinity. Of course these will imply major aggressive turnarounds.
As price creeps back towards a lone wolf, the location presents for a trade to be taken with any trigger at all, but I for one like to look for a fake breakout of the lone wolf which I find to be a very common phenomenon.
Very often, a defining characteristic of price as it approaches a lone wolf is that it accelerates into the swing point causing the fake impression of a breakout, but in essence is caused majorly due to lack of order flow.
Let’s take one of the above charts as an example:
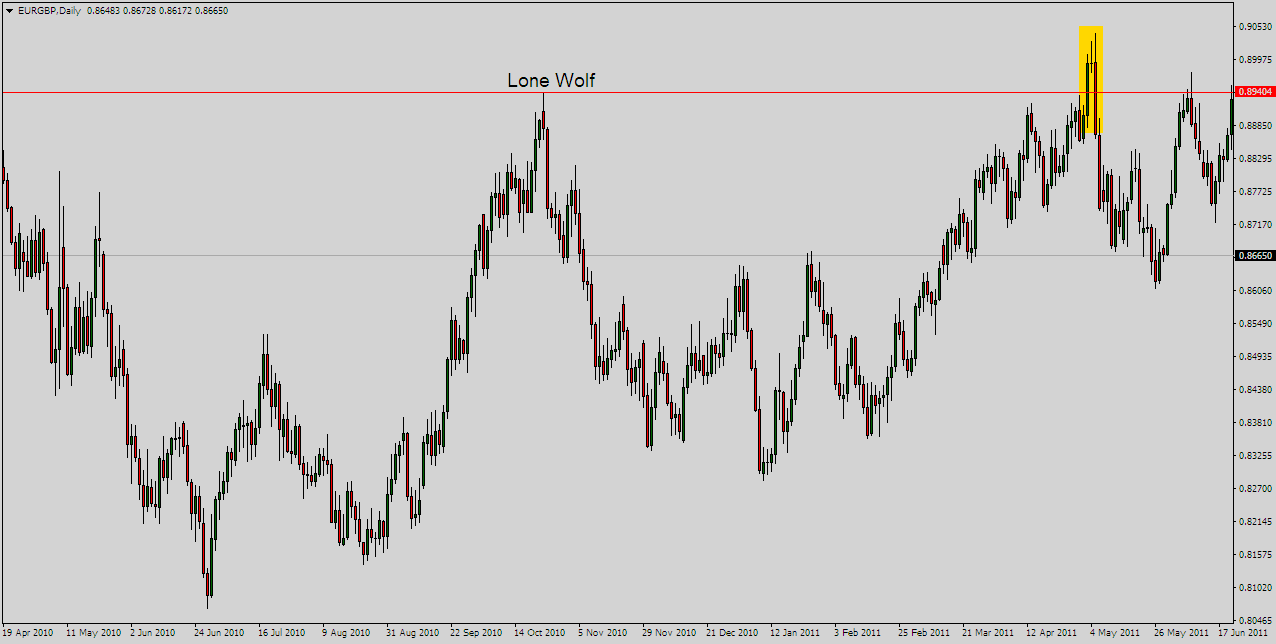
Notice the price action marked in yellow. Price slows down as it approaches the swing high marked in red stemming from the lone wolf. For institutional traders looking to short at logical area, sell orders will thin out in the market (they are clustered at and above the red line, instead of taking part in the live action!) allowing for buyers to push prices higher easily creating the spike up. Alas! This is where a lot of retail buyers will get sucked in thinking it’s a breakout of the former major resistance!
In essence, price just hits the barricade of short orders leading to violent turnaround and a fake break of the lone wolf.
In the end we still have what should have happened: history repeating itself and price reacting at a point in the same manner as it did in the past.
For me personally, I like to see a bar close strongly back down under the red line (or above the red line if it is drawn at a swing low for a long fake out trade) which I will then use as my trigger bar (entry on the break, and stop loss beyond the opposite end of the bar). Alternatively, you could look for a candlestick pattern like pin bar or a bearish engulfing bar to serve as the trigger. As long as you understand the phenomenon and are waiting in ambush for the lone wolf to pounce on retail traders pushing hard, you have the logic side off your trade covered.
Here are few more neat setups stemming from the lone wolf location:
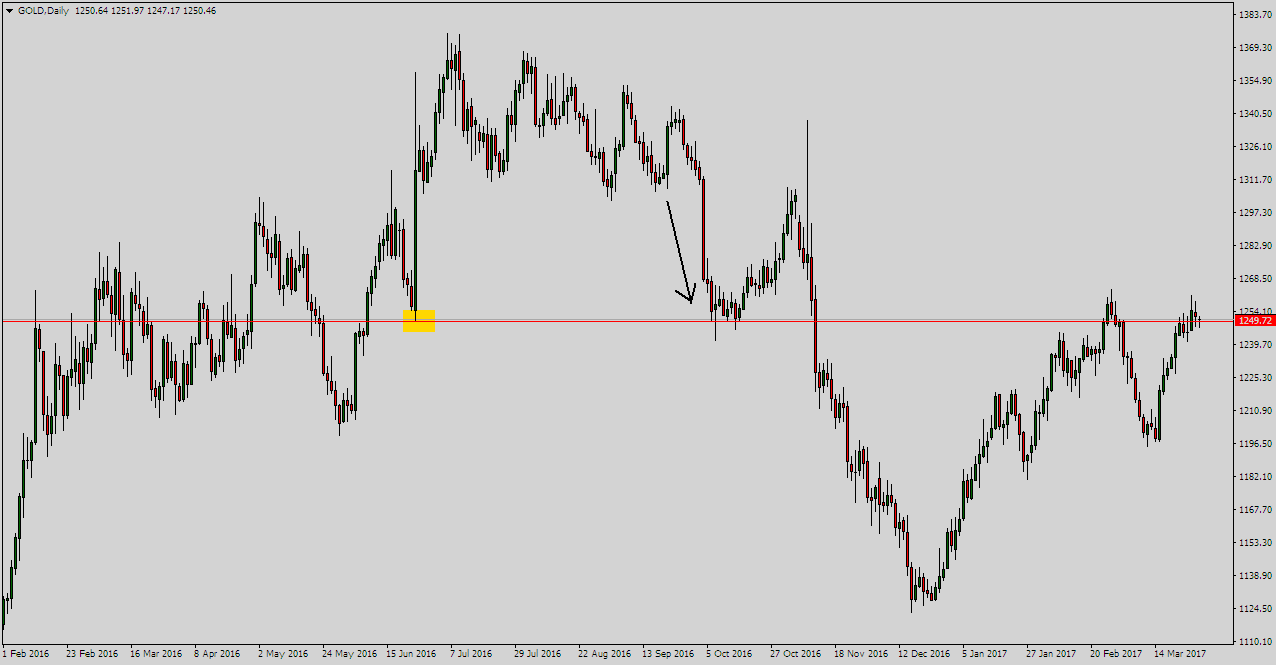
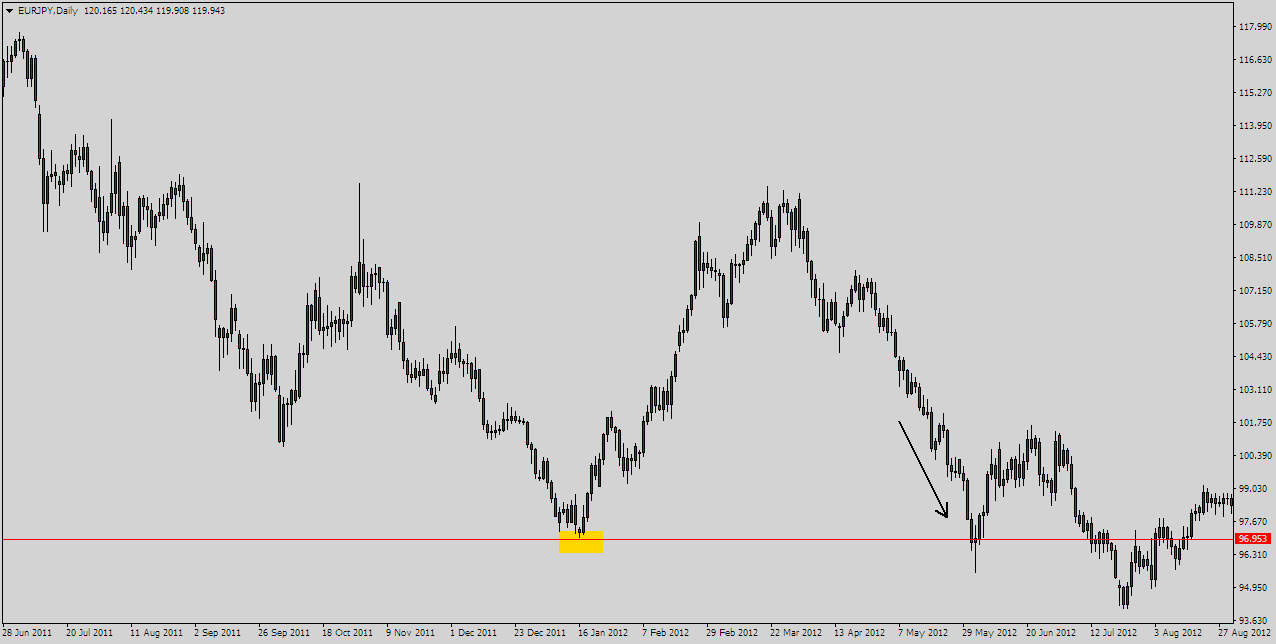
Notice how each time price accelerates into the swing high / low penetrates slightly and rebounds neatly off the high / low.
Next time when you scan your charts to identify horizontal support and resistance levels, watch out for the lone wolf too, for some killer trading opportunities.
external link:


We have been trading supply and demand strategies for over ten years, and they have stood the test of time remarkably well. Supply and demand is...

3 min read
Choosing the right trading journal is essential for traders wanting to analyze performance, refine strategies, and improve consistency. In this...

3 min read
“95% of all traders fail” is the most commonly used trading related statistic around the internet. But no research paper exists that proves this...