Supply and Demand Trading in 2026
We have been trading supply and demand strategies for over ten years, and they have stood the test of time remarkably well. Supply and demand is...
Reversal trading has a very bad connotation to it and as soon as you hear about a reversal trading method, you probably think about a very risky and gambling-like method, right?
The truth is, reversal trading – as we follow it here – can even be used as a trend-following entry method. First, you identify the overall the overall trend direction, second you want for pullbacks during that trend and then you wait for reversal signals that indicate the short-lived pullback is over and that the trend is ready to resume.
Reversal trading doesn’t have to be that trading style where you fish for absolute tops and bottoms and then brag about calling the lowest low of the reversal – calling tops and bottoms usually always ends in a disaster.
Reversal trading can be a very different thing. Reversals happen every day and especially during defined trends, you will always see pullbacks. The great thing about those pullbacks is that the amateur traders are always trying to catch such pullbacks and hope for a long-term reversal. The professionals know that and then trap the amateurs.
So while the amateurs are hoping for a long-term reversal (because they missed all the trend action), the professionals make it look like the trend is over to get the amateurs excited. But, after all, the pullback is just a pullback and the trend continues. Don’t worry, it will become clearer with the following example.
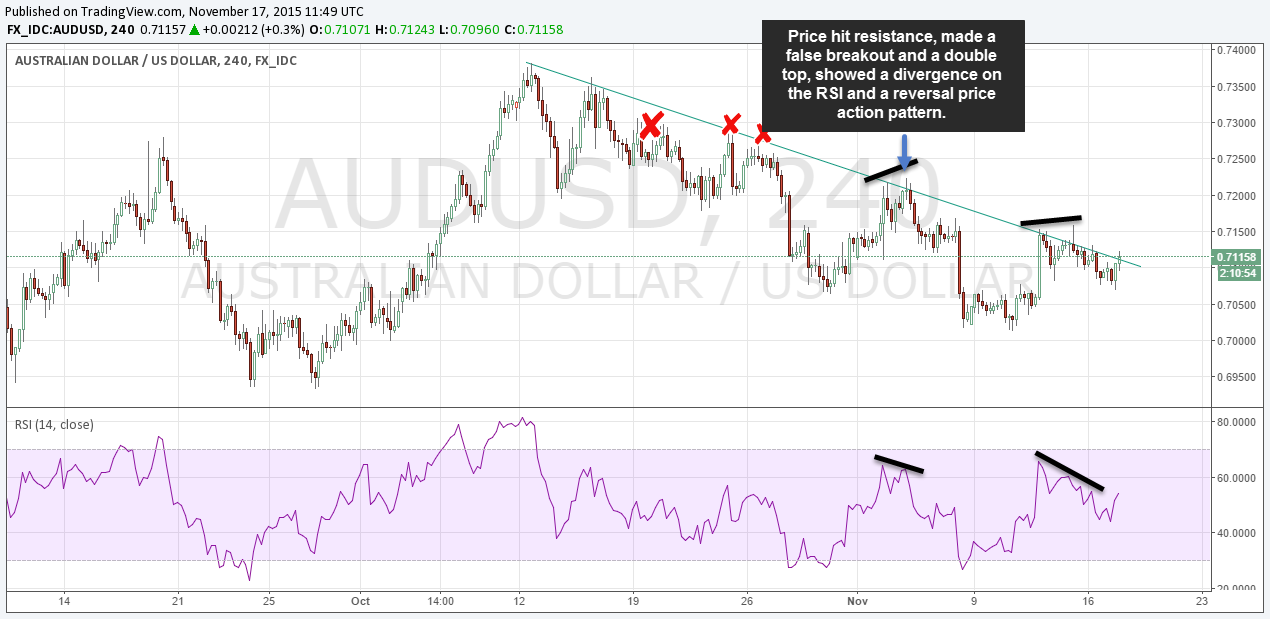
There were 2 great examples on the AUD/USD; one made for a great winner, while the other one lacked a clear follow through, but never the less, it made for a decent trade. Let’s go through the first one step by step as the other one was very similar.
First, you see that the trend is obviously down. There is also a downward sloping trendline – don’t worry about drawing it 100% correctly, its only purpose is to identify areas other traders will watch.
Now we wait for a pullback into that resistance line. As you can see, there were a few pullbacks marked with a red X that did not generate a signal because they were missing the actual criteria we will see soon.
Then, we saw a pullback into the resistance line and shortly after another one; that’s what we had been waiting for. The area with the blue arrow marks the trade entry and it has all the things going for it:
The entry happened after the first longer red bar when the formation and the divergence had been confirmed
Amateurs struggle with this kind of setup because they prefer to jump in as soon as price reaches the resistance line if they are trying to catch a trend-following entry. However, the waiting usually always pays off and if you see all the things align, you find a very good setup.

click to enlarge
The guide to trading divergences
The 3 things to look for in a reversal trade
Image credit: tradingview.com

external link:


We have been trading supply and demand strategies for over ten years, and they have stood the test of time remarkably well. Supply and demand is...

3 min read
Choosing the right trading journal is essential for traders wanting to analyze performance, refine strategies, and improve consistency. In this...

3 min read
“95% of all traders fail” is the most commonly used trading related statistic around the internet. But no research paper exists that proves this...