3 min read
Scientist Discovered Why Most Traders Lose Money – 24 Surprising Statistics
“95% of all traders fail” is the most commonly used trading related statistic around the internet. But no research paper exists that proves this...
Double tops and double bottoms are one of our favorite trading patterns. They offer reliable trade signals and they can be combined with other trading tools and charting concepts to form a very powerful trading methodology. At the same time, professionals know that amateurs have a particularly hard time trading double tops and double bottoms and it’s usually very easy for them to squeeze the consistently losing amateurs around those levels.
The amateur squeeze around double tops and double bottoms is a very profitable trading pattern and we will show you step by step how you can become better at trading double tops and double bottoms while avoiding the common amateur mistakes.
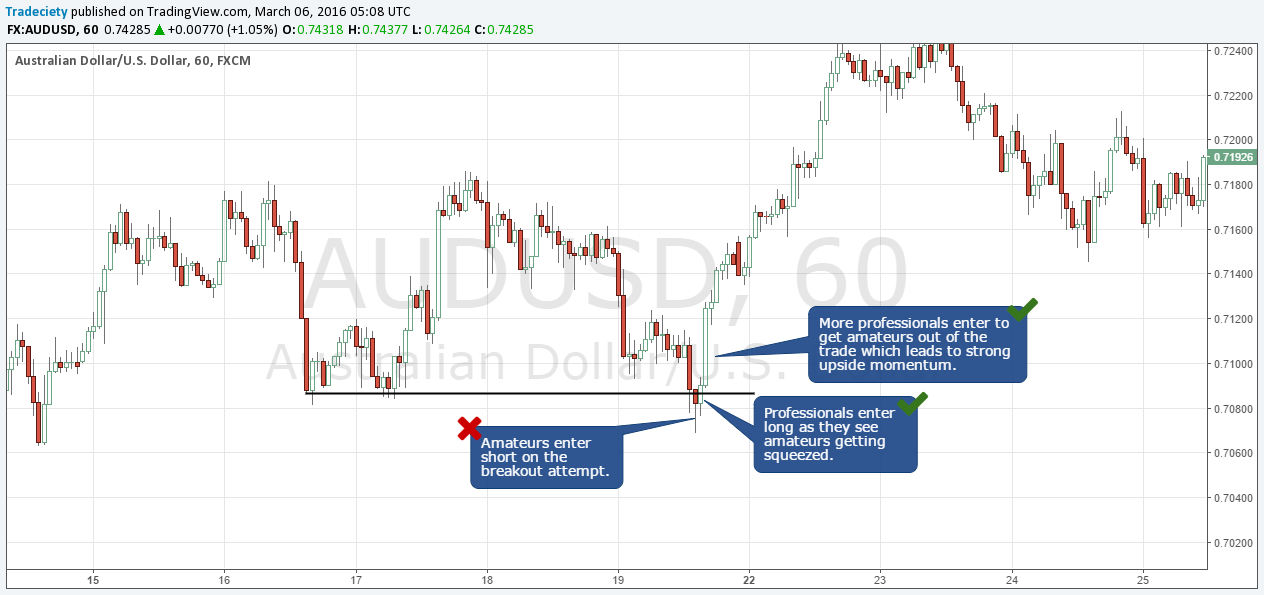
Basically, the amateur squeeze looks like a regular failed breakout at a previous swing high or low. Although it may sound harsh, but it’s the truth: you have to be able to spot price moves where a lot of amateurs are tricked into taking wrong positions and then lose money to capitalize on their failure.
It’s well known that most traders have a hard time being patient and disciplined. That’s why they will typically enter way too early around a double top/bottom without waiting for the real, confirmed break. Amateurs like to “predict” what might happen next because they fear that they are going to miss a trade and so they enter on a potential breakout that hasn’t yet been confirmed.
Being undisciplined, predicting, FOMO, over-trading and revenge-trading are all common amateur traits and the professional who understands where amateurs enter too early can profit from it.
While it may be possible to trade off blank price charts, I highly recommend using additional tools to support your decision-making process. Trading concepts and indicators provide a framework for your price analysis and they can help you stay more objective. Here are my favorite trading concepts I use in my daily trading to trade double tops/bottoms and reversals.
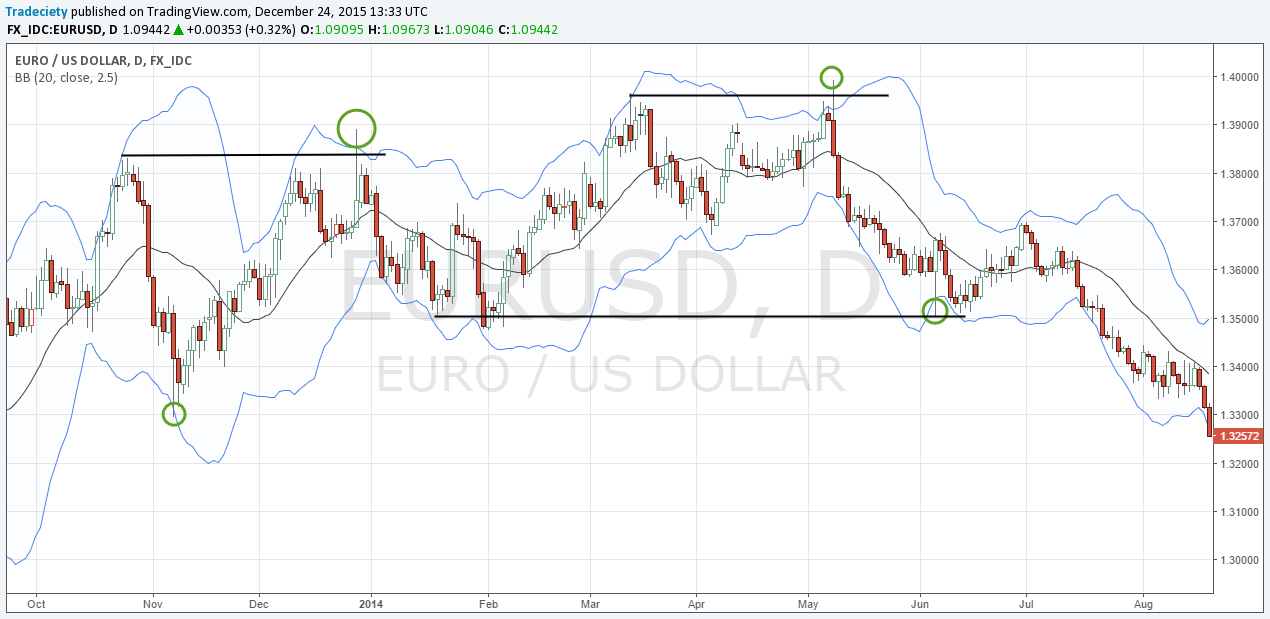
All good market analysis starts with a look at price and chart analysis first. The picture below has two double bottoms marked, but only one would have led to a potentially profitable trade. It quickly becomes obvious why the second level showed a much better time to enter a buy trade.
Just by comparing how price moved into the two marked levels could have told you a lot about the underlying buyer-seller balance. Whereas prices showed a huge red candle when it hit the first level (also note how it stopped right at the level which would have tricked many amateurs into buying too early), when price moved into the second lower level candles have become smaller and smaller. Price often moves like a car or train – it’s very hard to reverse direction on the spot and you’ll first see a slowdown and then an acceleration into the opposite direction. That’s what happened here.
Further reading: Supply and demand trading secrets
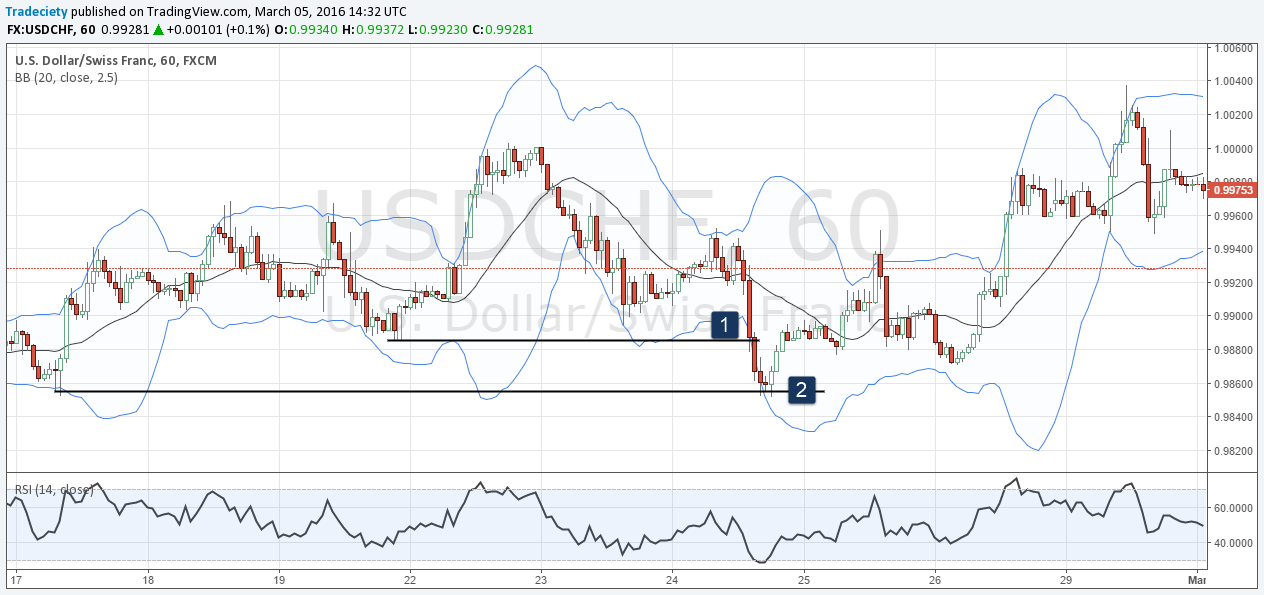
I have talked about the Bollinger Band spike before and I am happy to repeat myself here because it’s such a great tool to add confluence to your analysis. A spike through the 2.5 Standard Deviation Bollinger Band does not happen very often, but when it does, it often leads to high probability trades.
Combining the Bollinger Band spike with the concept of trading double tops and bottoms can be a very lucrative way of trading. While a Bollinger Band spike may be a potentially powerful signal by itself, when it happens at a previous swing high or low it becomes an even better signal.
The screenshot below shows 3 Bollinger Band spikes around previous highs and lows and each time a reversal happened afterwards.
Further reading: How to trade Bollinger Band spikes

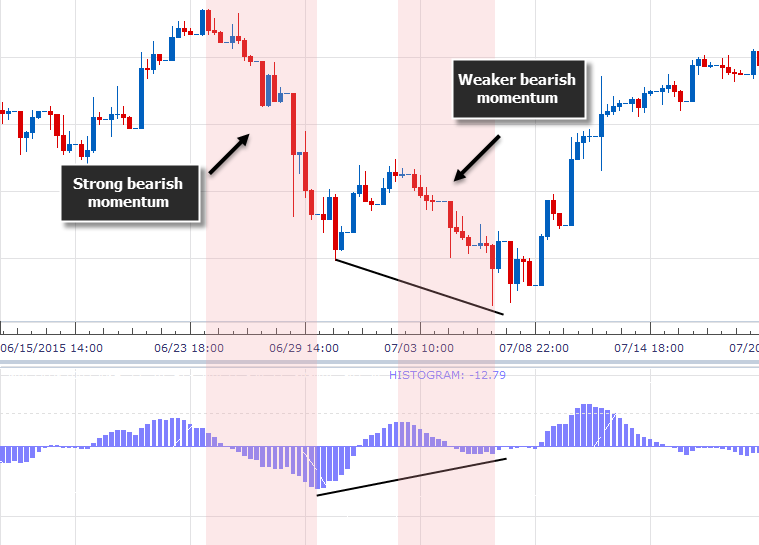
A momentum divergence on the RSI exists when the second trend wave is weaker (candle size and candle count) than the first trend wave; there is nothing more to how and why divergences form. Thus, you probably wouldn’t need to plot a RSI indicator on your chart if you’d understand how to read and compare trend waves, but indicators offer an objective way to analyze price.
The screenshot below shows a failed breakout attempt at a double bottom with a momentum divergence. Price made 2 attempts to breaking lower but failed each time and it finally lead to a complete bullish trend reversal. This setup is especially interesting because it also comes with a Bollinger Band spike and the amateur squeeze during the second failed breakout attempt.
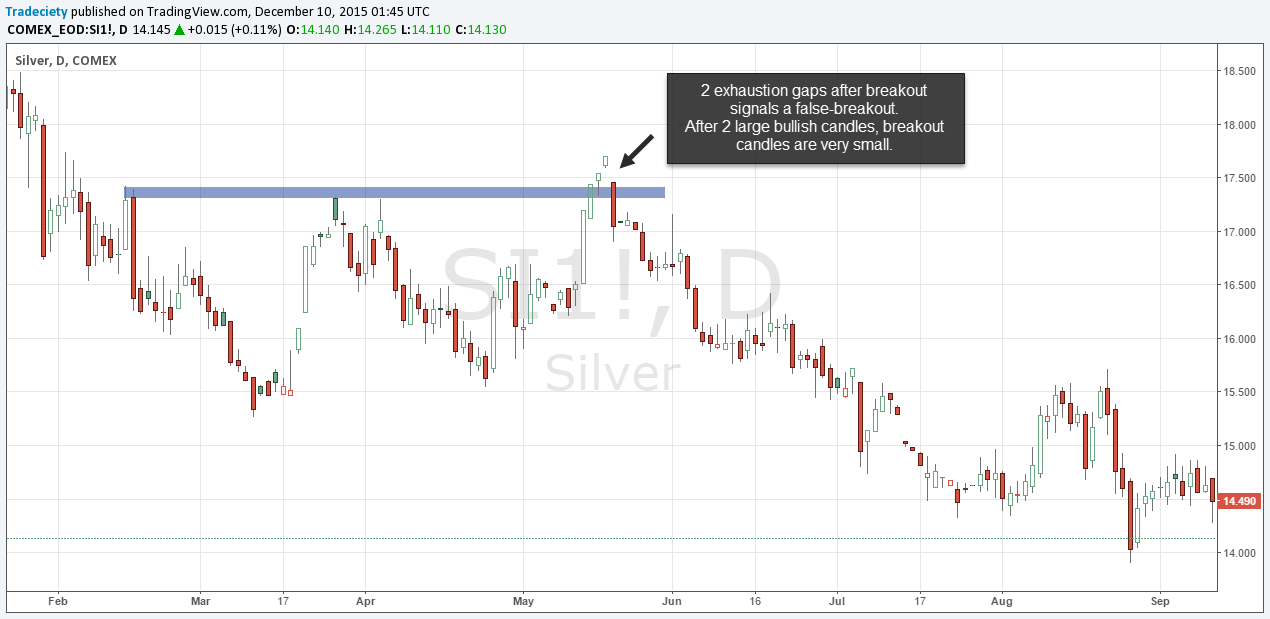
Especially in stock trading where markets close overnight, gaps can tell you a lot about the underlying dynamics and the balance between buyers and sellers.
The triple top below would have probably tricked many amateurs into believing that price is gapping over the resistance and breaking away. However, the trader who understands to read the nuances of price movements would have seen that candles have become successively smaller on the actual breakout. This is a classic reversal and exhaustion gap behavior – the last convulsions before the final capitulation.
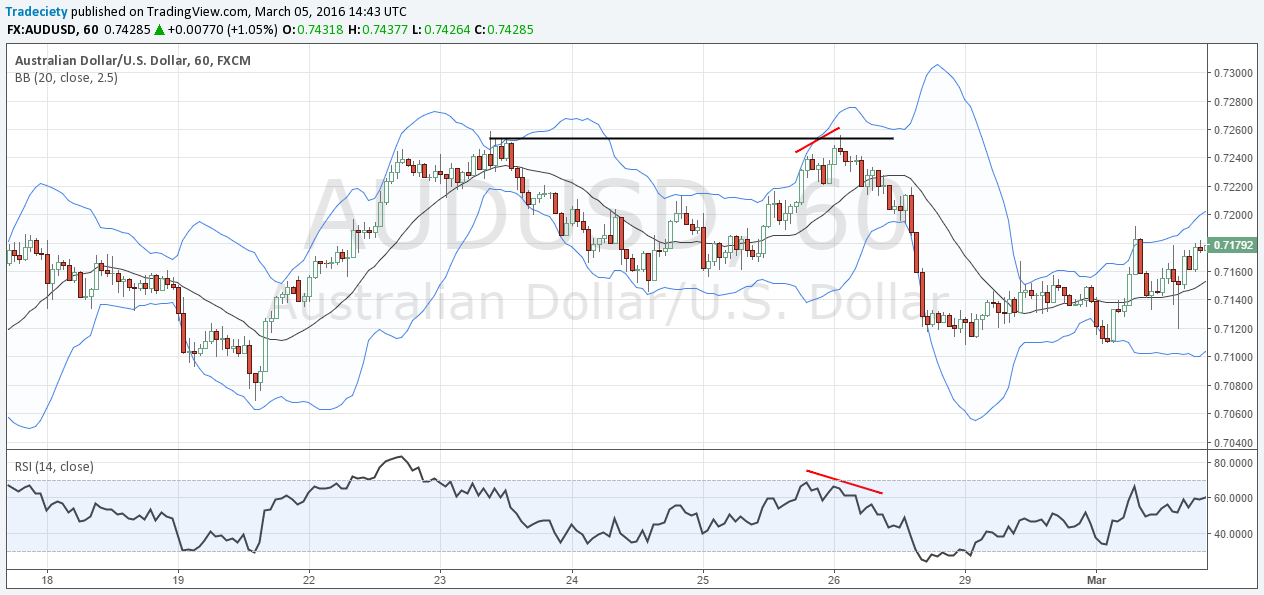
The screenshot below shows two clear swing highs. Price just barely broke it the second time but price left a wick showing some rejection. However, what happened around the level was way more telling. Note how price made an early reversal ahead of the level first. This would have tricked many amateur traders into selling too early because they didn’t want to miss out. Then, on the actual failed break, we saw a trend exhaustion and a momentum divergence which are two very powerful reversal signals.
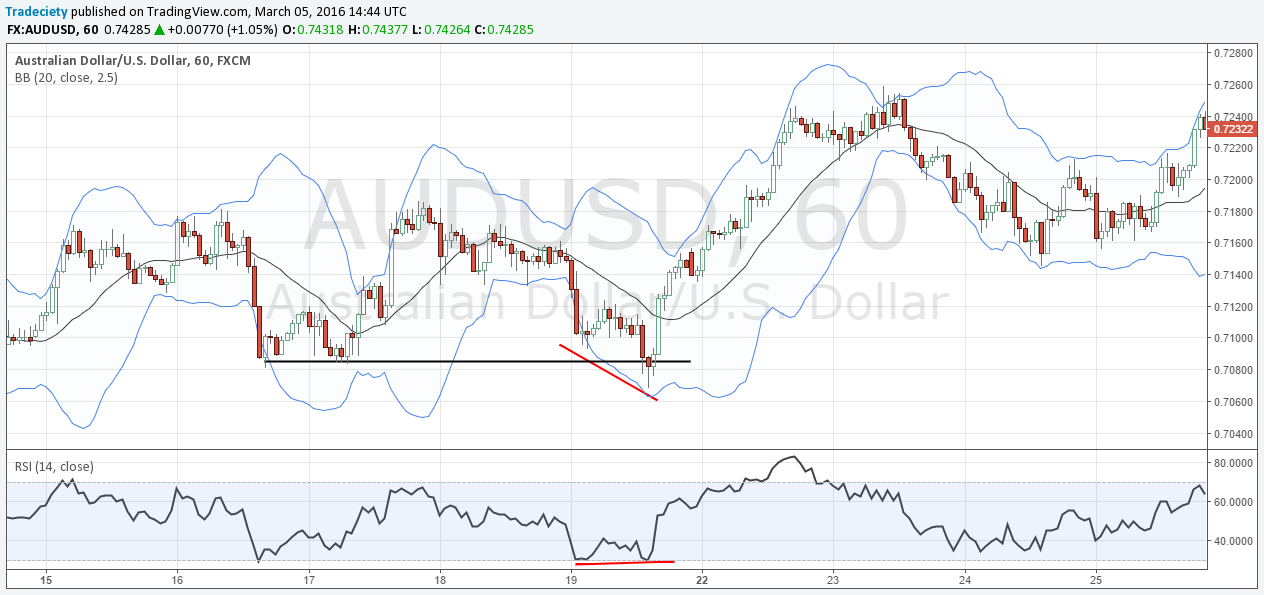
The next screenshot shows a similar behavior. We first saw a short-lived, premature reversal ahead of the actual previous swing low, followed by a full amateur squeeze. A clear price rejection pattern with a long wick and another momentum divergence with an exhaustion pattern foreshadowed the bullish trend reversal.
Double tops and double bottoms are highly profitable trading patterns and although they are not easy to trade, a trader who can read the subtle clues around those levels understands how amateurs are easily tricked into false trades and how professionals capitalize on such failure.
To sum it up, here are the things to look for when trading double tops and bottoms:


external link:


3 min read
“95% of all traders fail” is the most commonly used trading related statistic around the internet. But no research paper exists that proves this...

3 min read
Trendlines can be great trading tools if used correctly and in this post, I am going to share three powerful trendline strategies with you.

3 min read
Choosing the right trading journal is essential for traders wanting to analyze performance, refine strategies, and improve consistency. In this...