3 min read
Scientist Discovered Why Most Traders Lose Money – 24 Surprising Statistics
“95% of all traders fail” is the most commonly used trading related statistic around the internet. But no research paper exists that proves this...
Candlestick wicks are among the most commonly misunderstood and misused concepts of technical analysis there is. Whereas conventional pinbars are straight-forward and easy to spot, when candlestick wicks occur within trending moves or at breakout points, traders usually make the wrong assumptions and then make bad trading decisions.
The goal of this article is it to provide a different viewpoint on how to use and look at candlestick wicks.
Let’s start with the first and most important idea: a candlestick wick is not just a signal of rejection and it can actually foreshadow a breakout. How come?
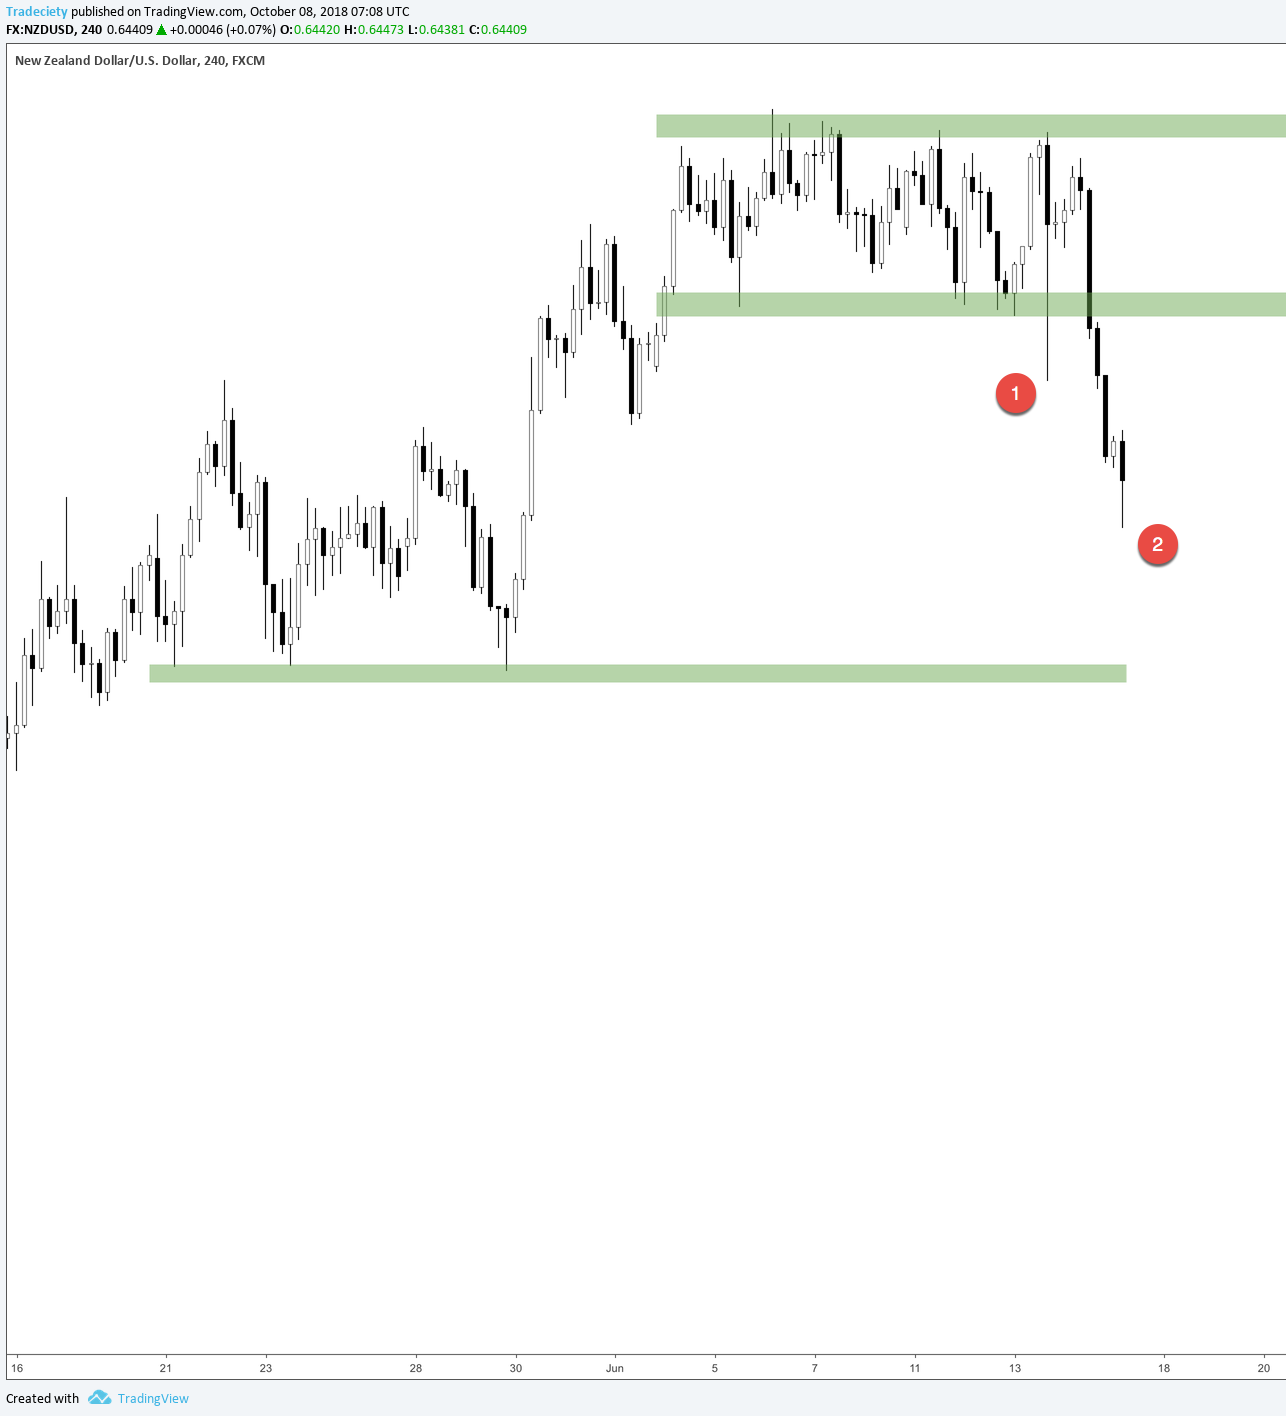
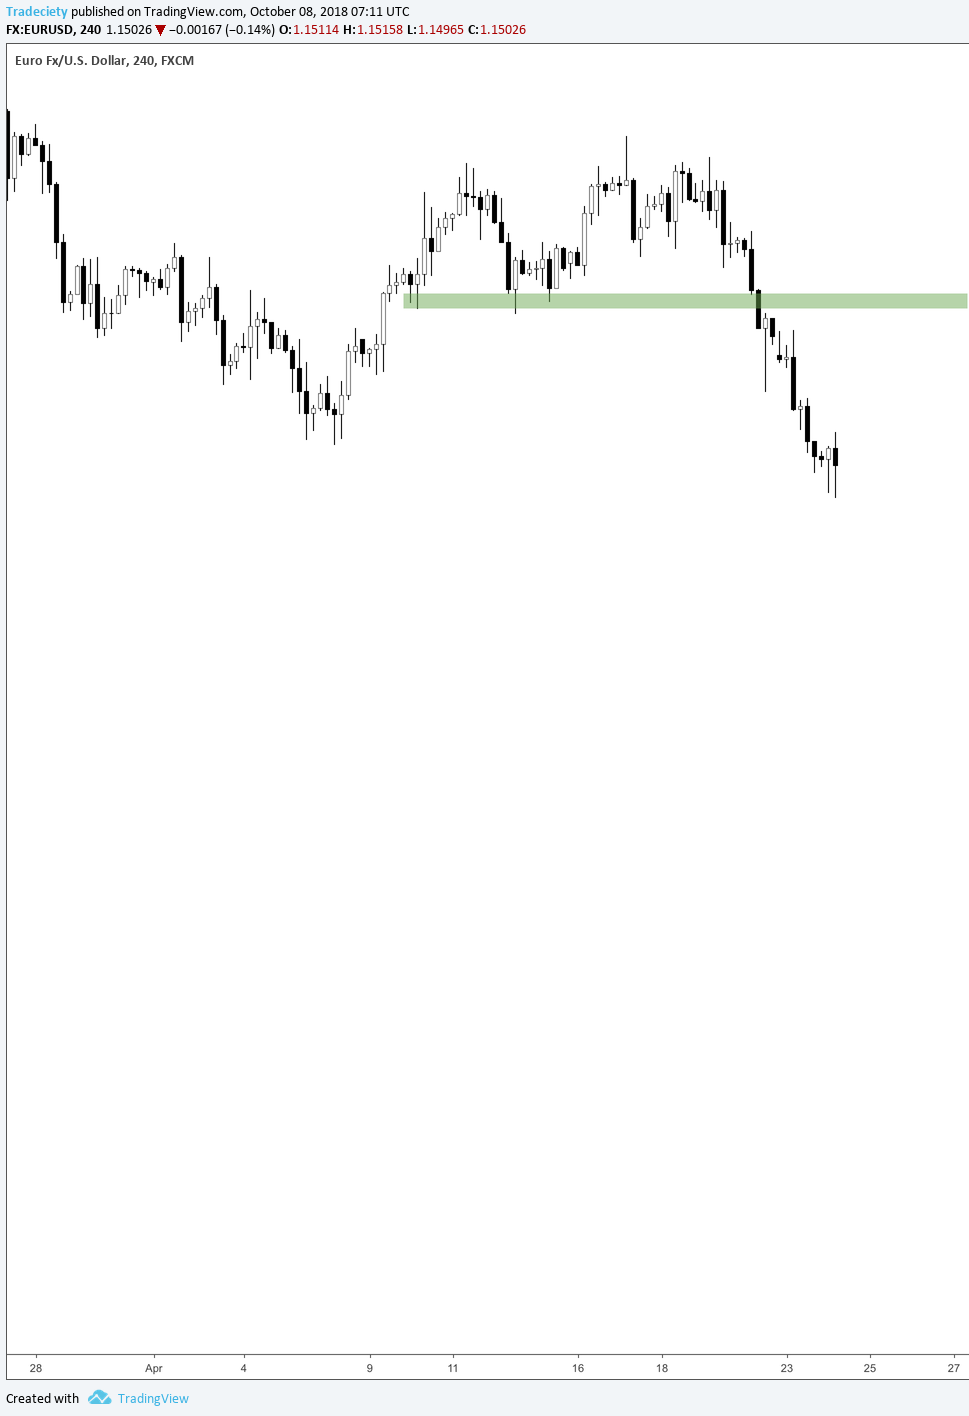
Look at point (1) in the screenshot below. There was a huge wick trying to break the support at the previous lows. This wick could have indicated that the sellers are not strong enough because price could not close below the level. Another viewpoint might be, that there were so many sellers in the market that they were able to push price as far as never before during the ranging period. This could foreshadow a slowly shifting power balance between buyers and sellers.
Of course, with the benefit of hindsight, we can see that the price broke the support shortly afterward, but you will be able to spot such a pattern time and time again. Furthermore, the idea of strength into the direction of the wick will also help us when staying in trades with confidence.
A trader who entered on the breakout will now have to make a tough decision at point (2): will he remain in the trade or will he exit it because the candlestick is showing a wick? A trader who does not know better will assume that the wick shows a rejection. A trader who understands that a wick can also foreshadow a continuation into the direction of the wick will evaluate the situation very differently. The downward wick could have also indicated that there is a lot of selling pressure in the market, that wasn’t quite ready yet to tilt the balance.
Traders who misinterpret candlestick wicks usually exit such trades way too early because they get easily scared by every little wick. It can really pay off to investigate the continuation signal of wicks.

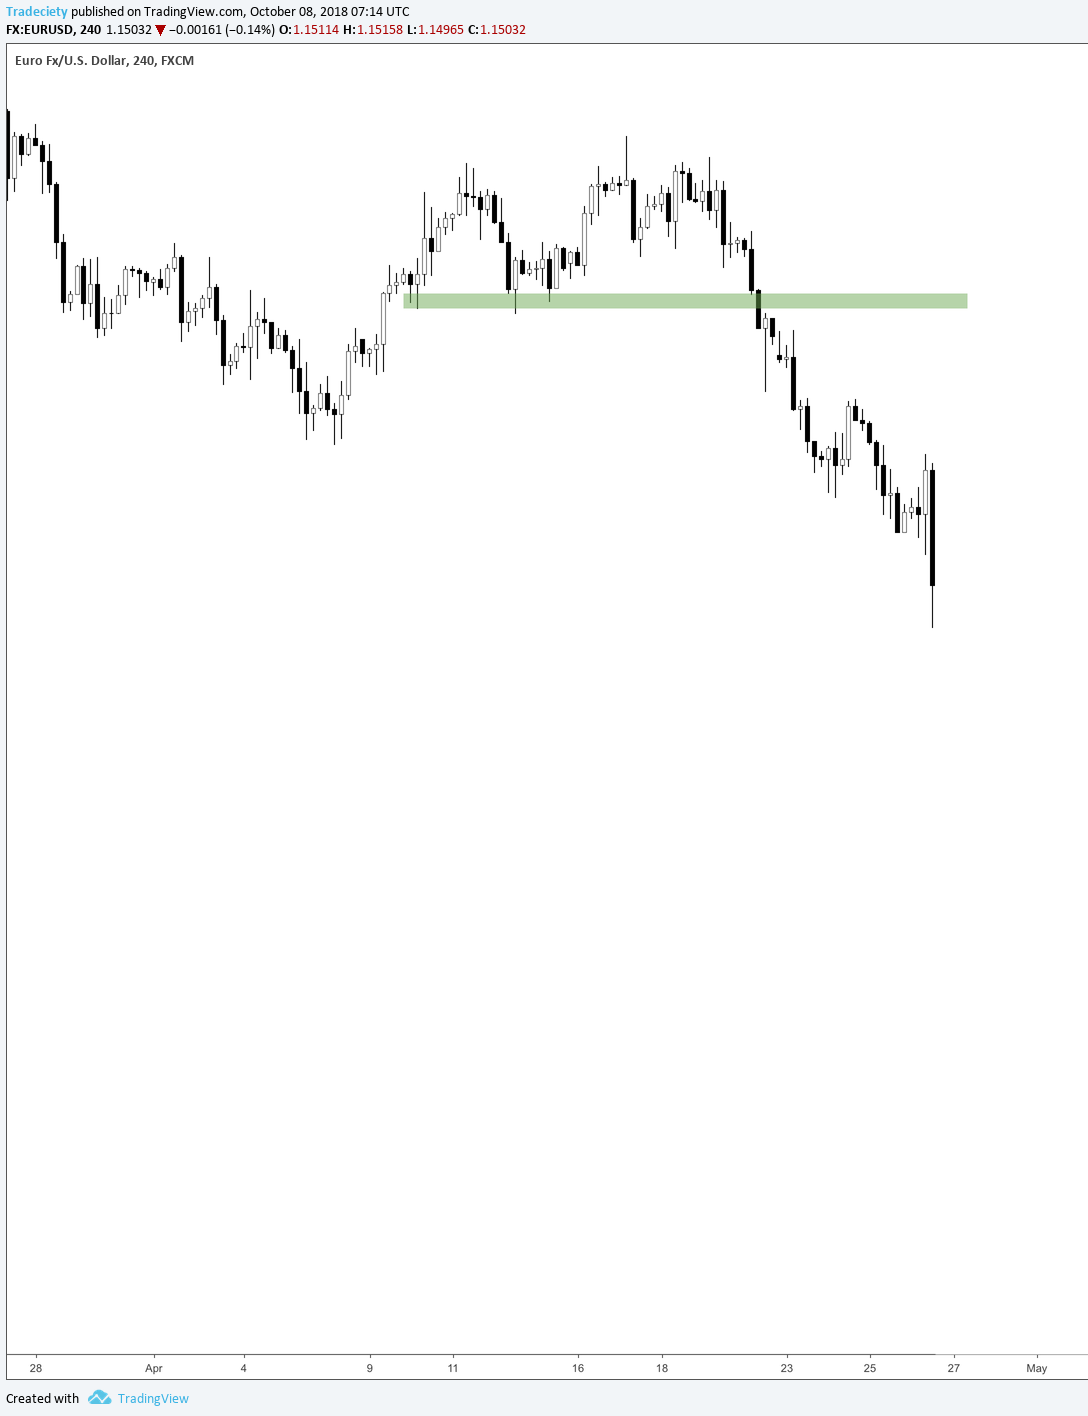
Now let’s look at what happened afterward. The price continued the way down and the wick that looked so “scary” at the moment was just a small hiccup during a trending market.
Price never just shots up and down in a straight line but the ebb and flow of the market lead to a constant back and forth and a trader who understands to interpret price action the right way will be able to approach his trading wich more confidence.
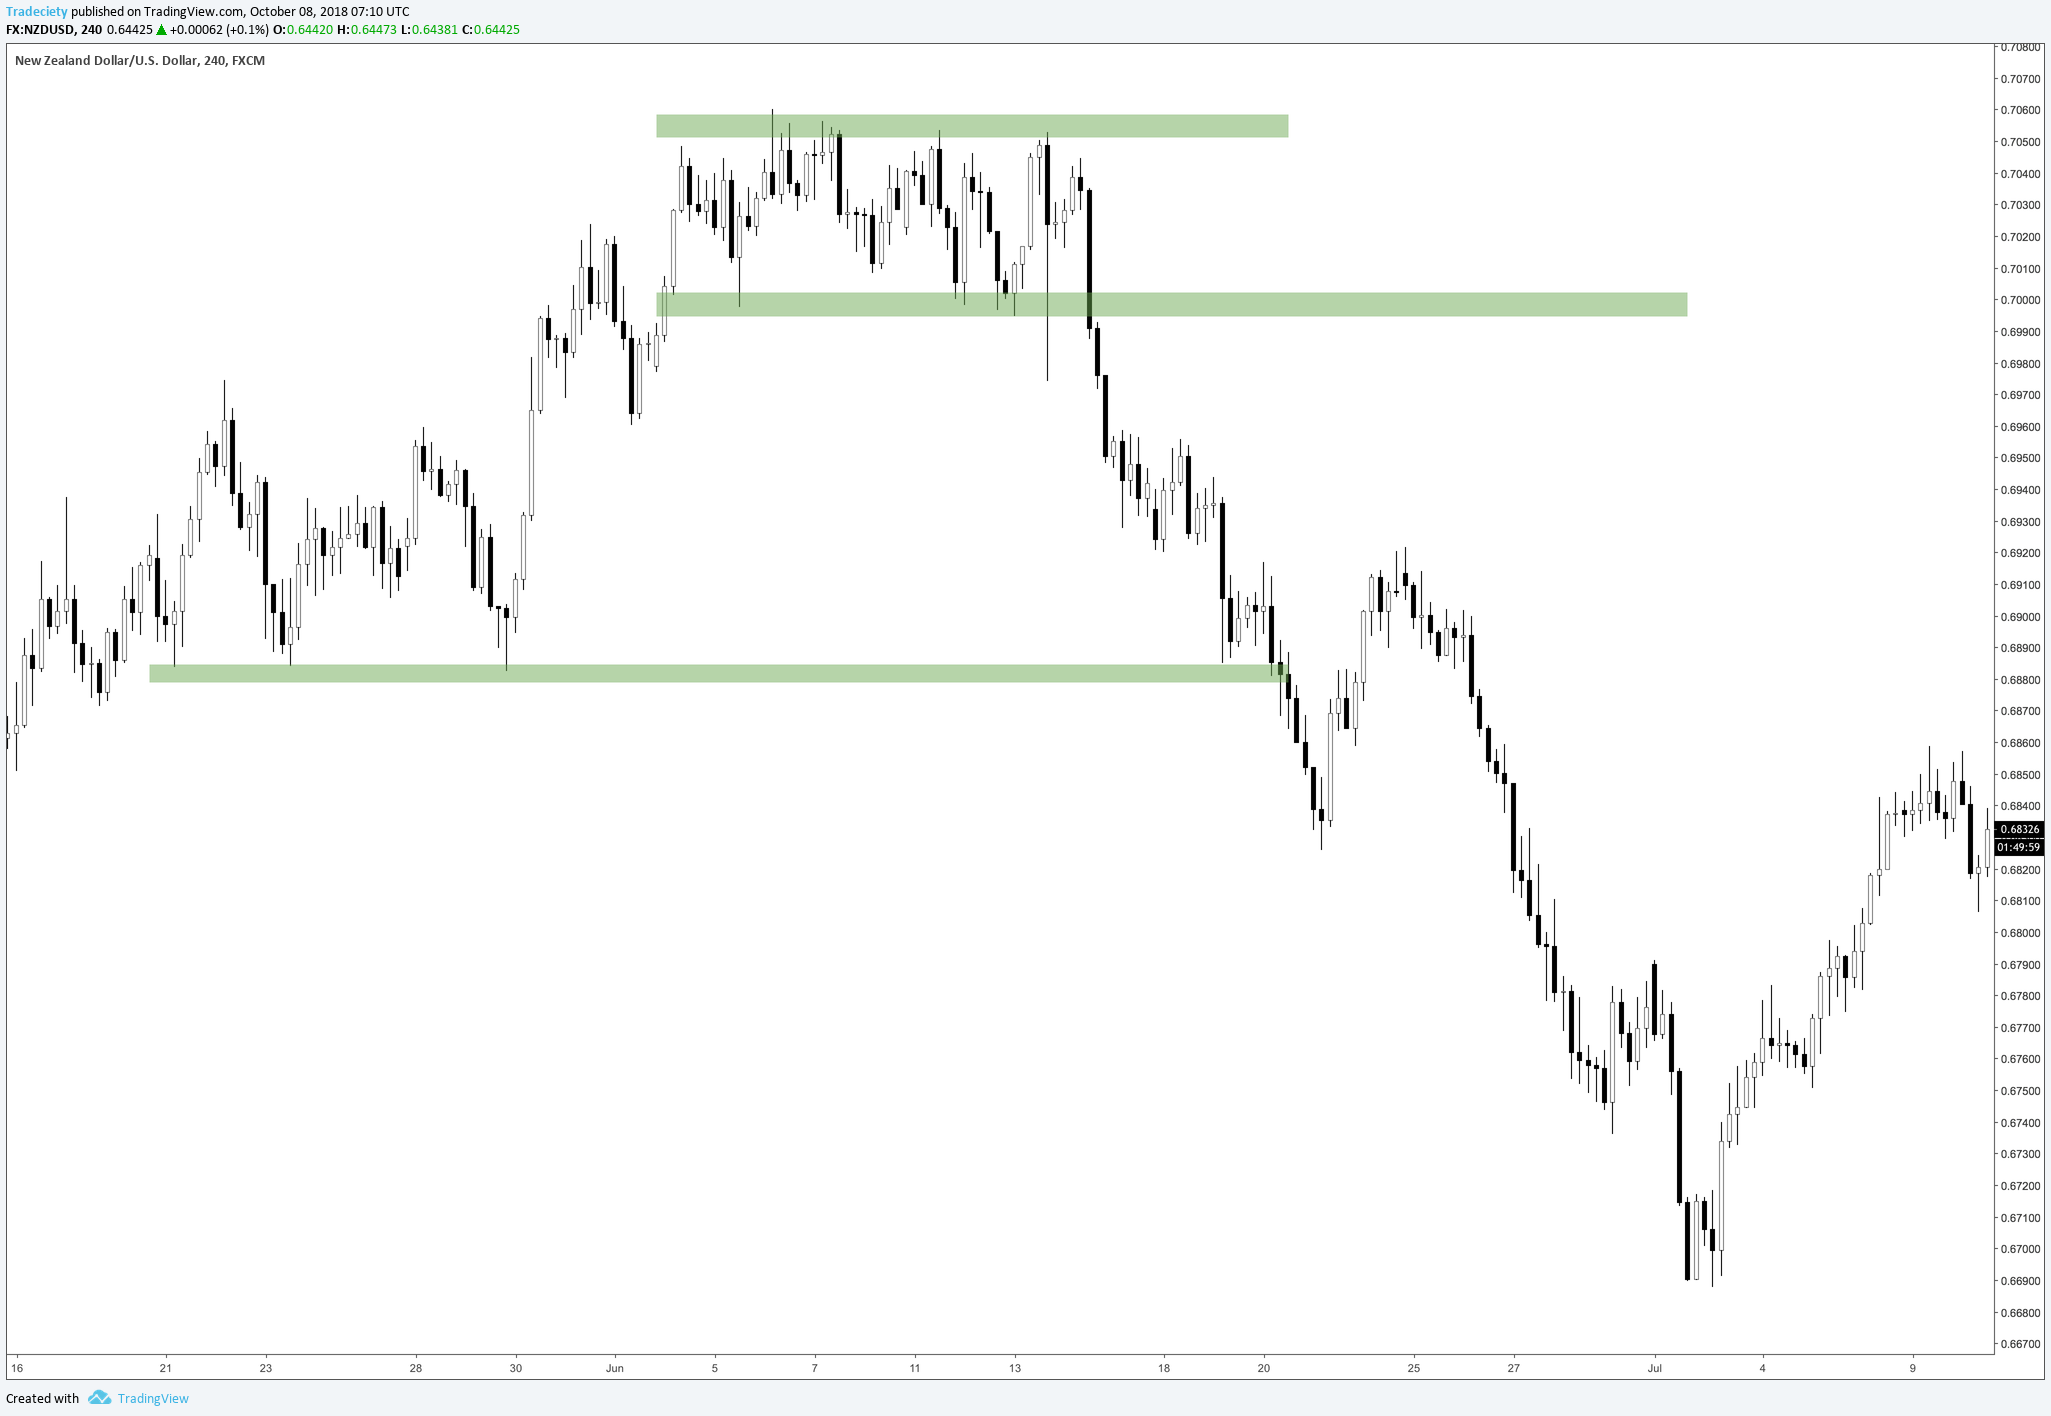
The screenshot shows 2 scenarios where a candlestick wick could have been used as a rejection signal that then lead to a wrong interpretation of the scenario. In both cases was price not able to break the level immediately, but the wick pushing into the level indicated a strong interest in the level.
Of course, trading such wicks blindly without confirmation is not a smart move either, but they can be used as an important building block for a trading strategy. If you are interested in more in-depth technical analysis, take a look at our premium online courses.
To further investigate the importance of reading candlestick wicks in the right context, let’s go through one more example.
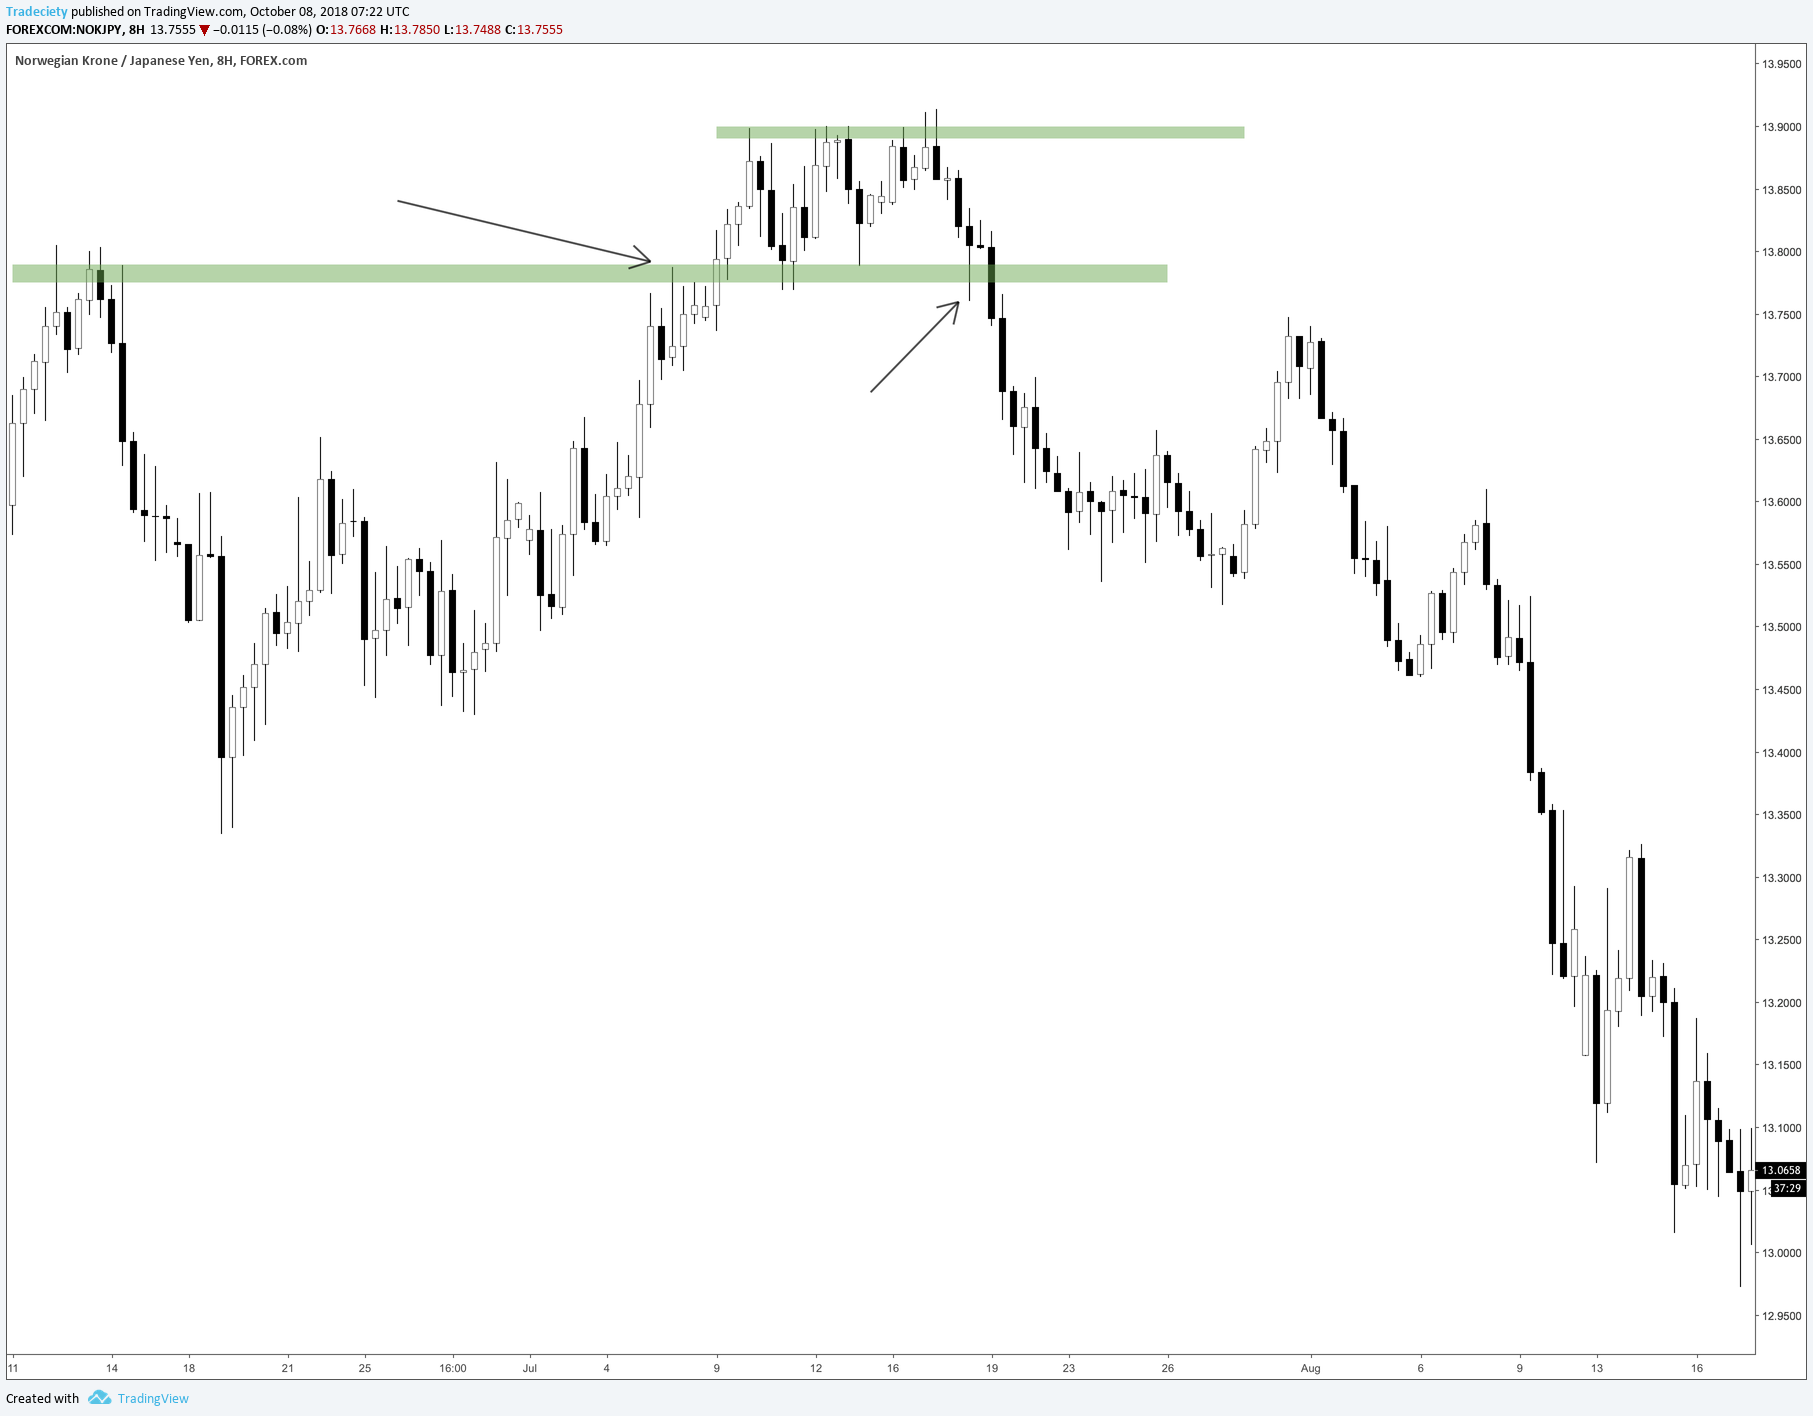
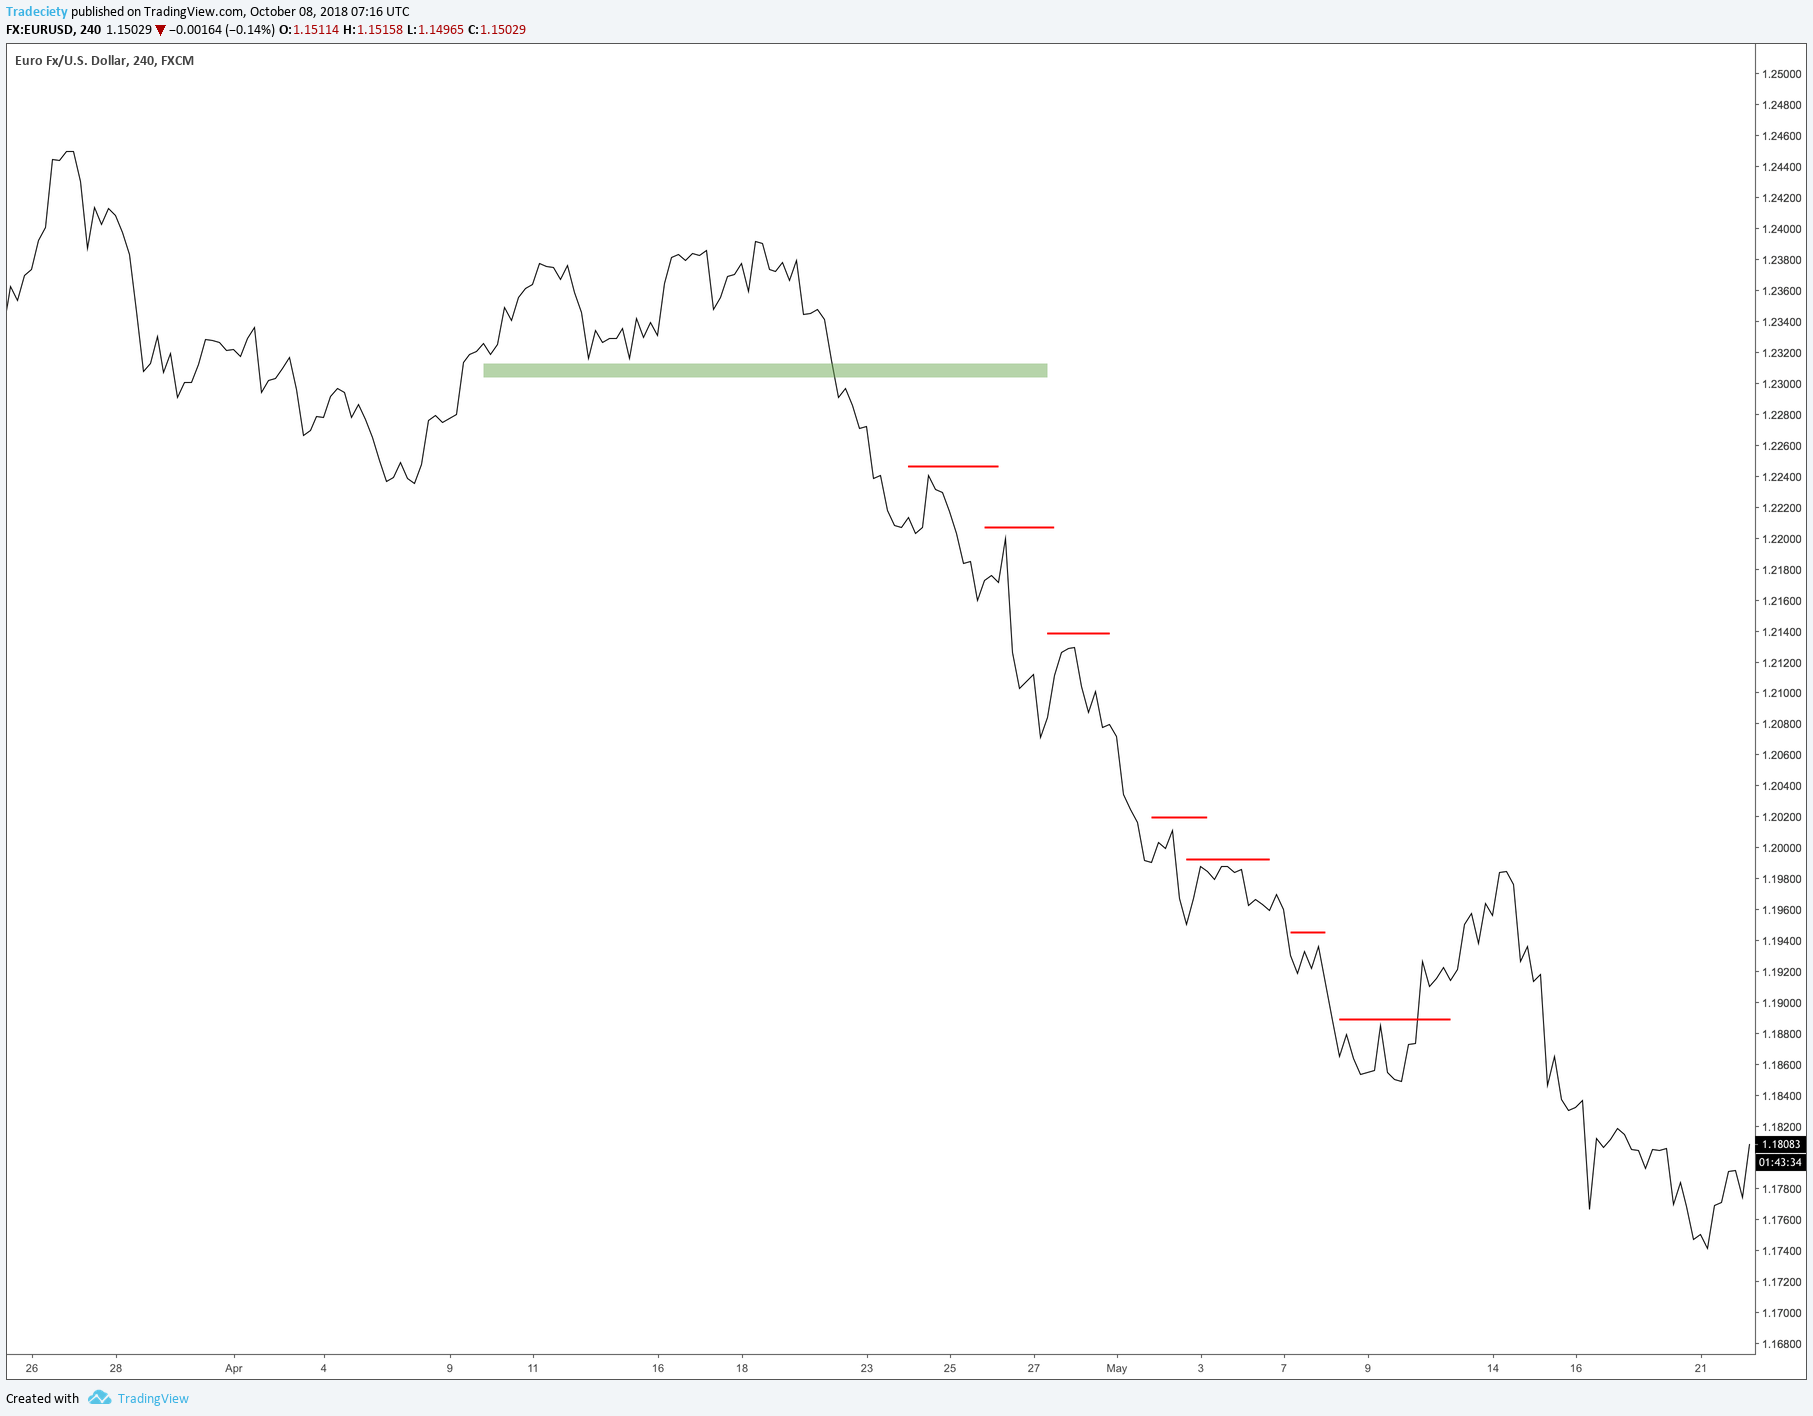
Below we see a classic breakout scenario which is followed be a candlestick with a long wick. How many traders will exit their breakout trades because they fear a rejection? Most!
However, wouldn’t it also make sense to view it as a normal bullish pushback after the breakout? Support and resistance levels are areas where buyers and sellers heavily interact with each other and clean breakouts usually only exist within textbook 😉 a pullback into a breakout area is a common phenomenon – also because price fishes for break even stop loss orders which is a whole different problem in the retail trading world.
The breakout was then continued after the wick and the trend progressed until it reached the next area of previous lows where buying and selling interests collided once again. The candles formed 2 wicks and most traders will most likely get easily scared out of their trades. However, by now you should understand that as long as we do not see a major move away from the wicks, the trend has a good chance to continue.
And that’s exactly what happened. The last candle in the screenshot below shows another scenario many retail traders get wrong. We see a large bearish candle with a wick. The amateur will only see the wick and get pushed out of their trade because they fail to interpret the size in the right context. The body shows strong selling pressure and the wick is compared relatively small. Size and the relation of wicks and bodies can also be a very important building block for your understanding of technical analysis and I wrote about it here: understand any candlestick pattern
As a final tip, I always recommend switching to the line graph from time to time in order to get a sense of what is going on without all the noise of the candlesticks. The purpose of candlestick graphs is to provide more information, but more is not always better.
The line graph provides a noise-free way of looking at price and at no point did the line graph provide a scenario that would have lead to a premature exit.
Going forward I recommend you start paying attention to candlestick wicks when they occur so that you can make the right assumptions in the future. Of course, this will take some time but the more situations you experience and observe, the better your knowledge will be.


external link:


3 min read
“95% of all traders fail” is the most commonly used trading related statistic around the internet. But no research paper exists that proves this...

3 min read
Trendlines can be great trading tools if used correctly and in this post, I am going to share three powerful trendline strategies with you.

3 min read
Choosing the right trading journal is essential for traders wanting to analyze performance, refine strategies, and improve consistency. In this...