3 min read
Scientist Discovered Why Most Traders Lose Money – 24 Surprising Statistics
“95% of all traders fail” is the most commonly used trading related statistic around the internet. But no research paper exists that proves this...

Support and resistance trading is very powerful and knowing how to draw support and resistance levels on your price charts is a key skill for any trader.
However, we often see that traders make many mistakes when it comes to finding the best levels. Drawing support and resistance wrong will lead to wrong trading decisions and bad trades.
In this article, we help you understand how to find the best support and resistance levels easily.
Support and resistance levels are key price areas on your charts where the price has previously shown a reaction.
Support and resistance areas are confluence zones and they can be major swing points where the price has turned away from and started a completely new trend.
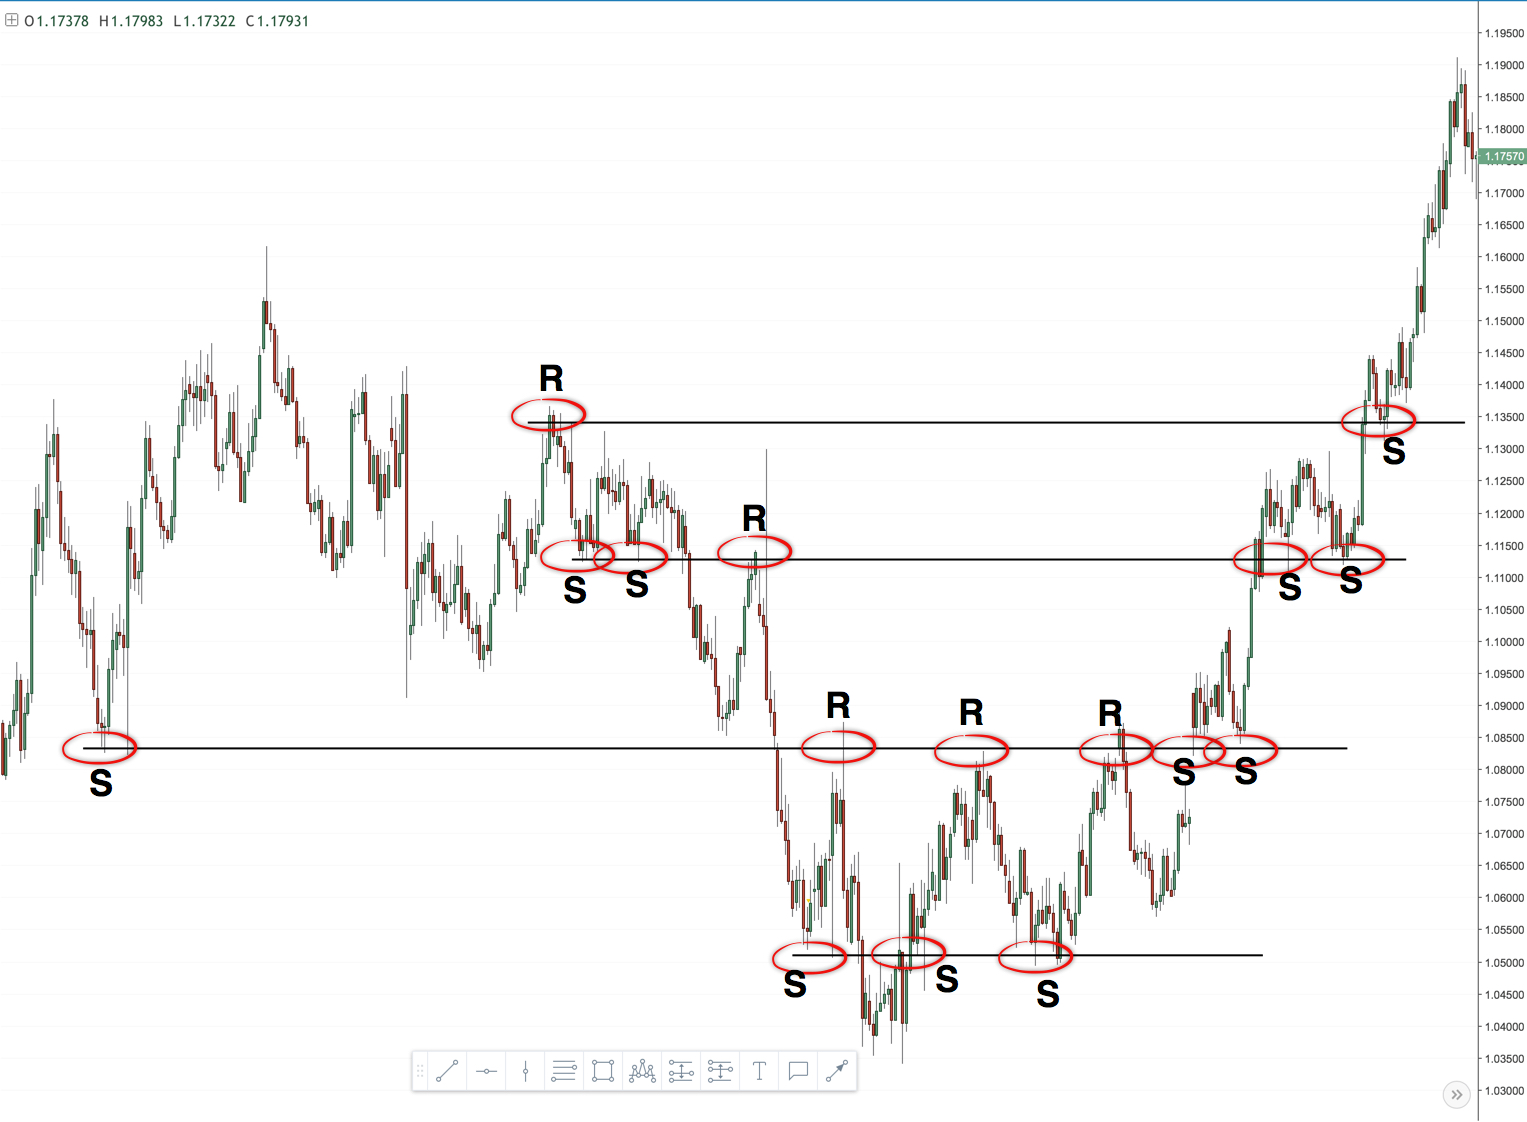
Below you see a classic support and resistance chart. Resistance (R) points are the ones where price could not break above and turned lower and support (S) levels are reaction points where price shot up from.
It is so important to know how to find the right support and resistance levels because:
Now comes the problem with conventional levels and why so many traders lose money using support and resistance.
Traders who just draw thin horizontal lines on their charts usually find themselves in one of the following two scenarios:
Let’s take another look at the first chart and when we look closer, we can see that more often than not, the price actually spiked through the level or missed it. At first glance, the chart from above looked like the levels could help us describe the price action nicely, but when we look closer we see that the technique often fails.
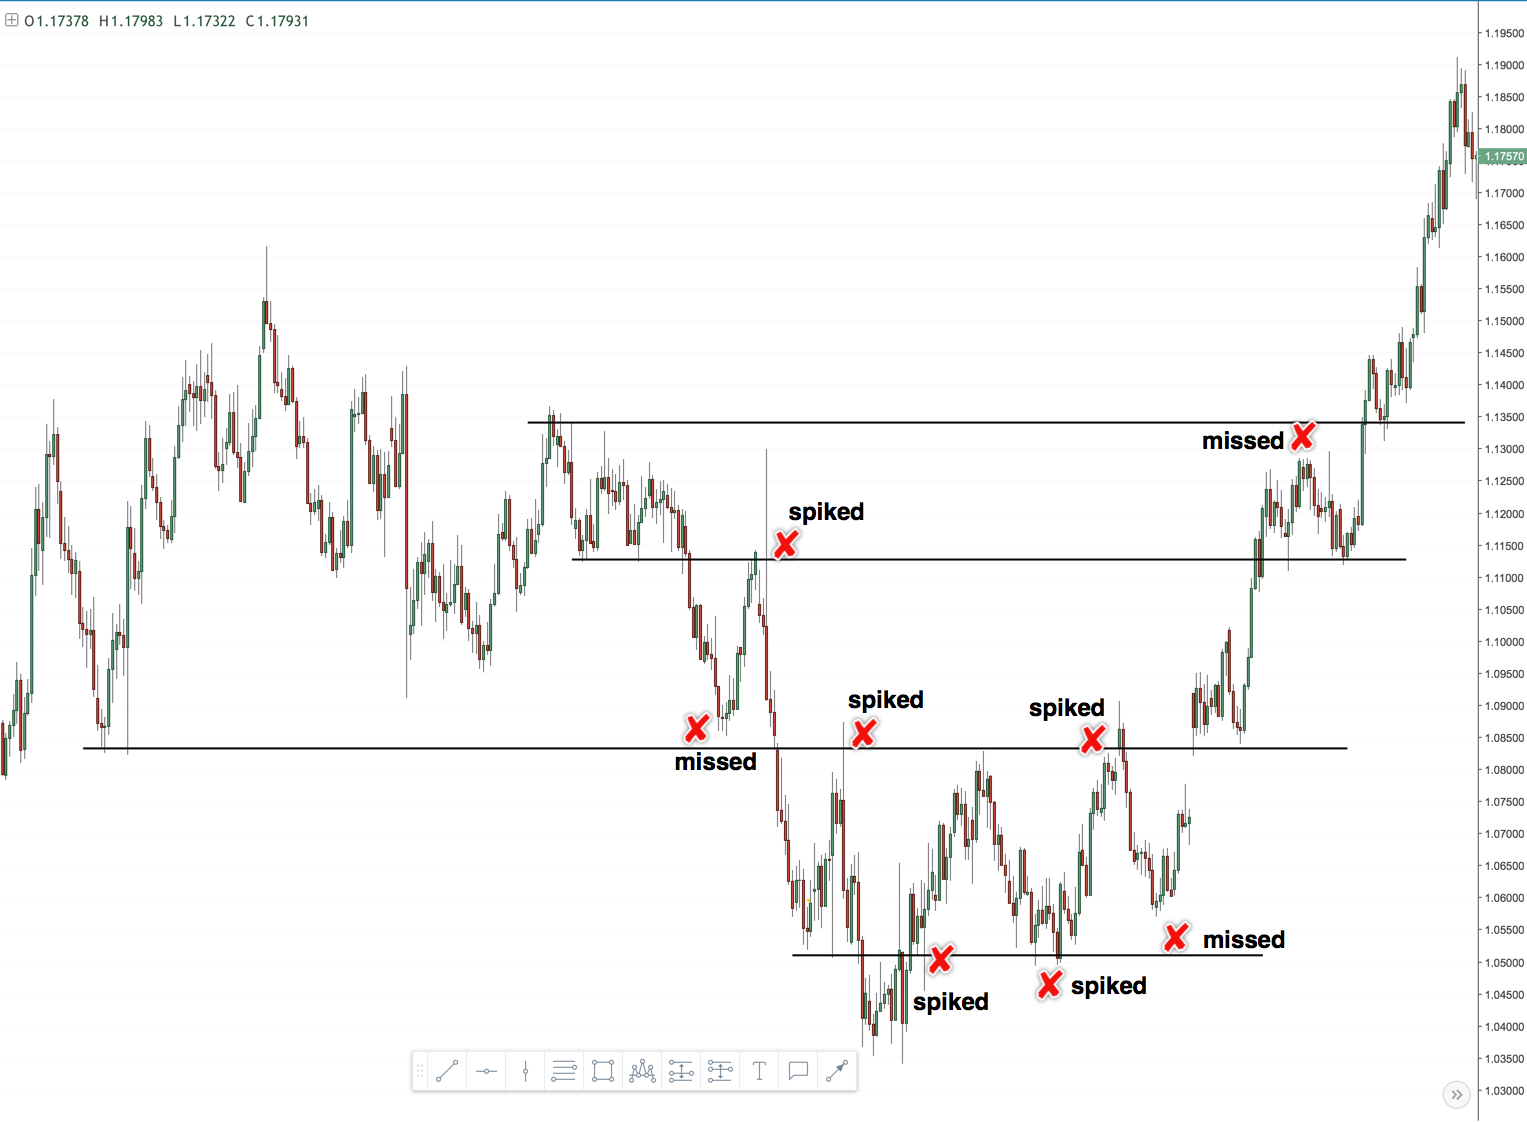
Price is a very dynamic concept and volatility and momentum can affect price moves in significant ways. This is especially true when we look at the most important support and resistance areas.
When the majority of traders is trying to place a trade at a very obvious price level, the professional traders know this and they will then do their best to kick out the amateurs by letting price spike through levels or make it turn before the actual level.
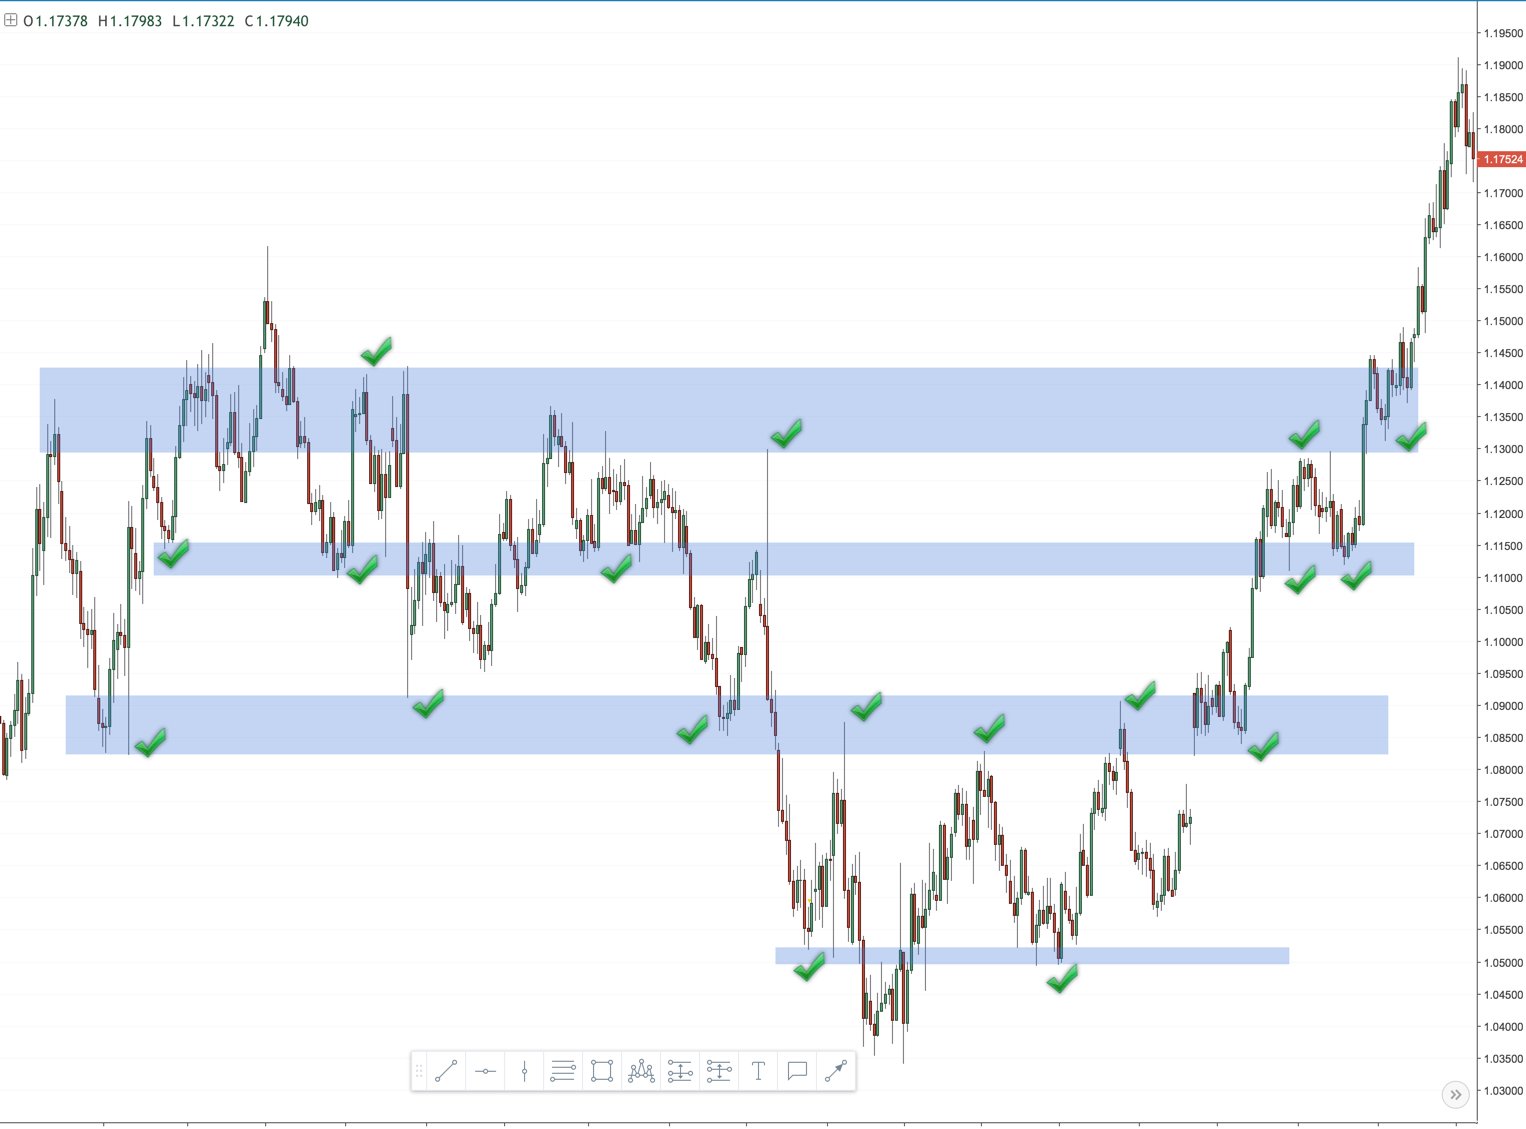
To overcome this shortcoming and to improve our trading skills, we need to start using ZONES instead of just single lines.
The screenshot below shows the same chart again, but this time I used zones instead of just one line. As you can see, the zones now include all major turning points and we can describe much more effectively.
Of course, it’s far from being perfect – but nothing in trading is! By using zones, you can create so-called “noise zones” and filter out a lot of noise and stay out of troubles.
If this is new to you, just pull up price charts and start drawing zones instead of small lines when looking for levels. Also, try to keep the zones as narrow as reasonably possible. Over time, you will see how this will improve your chart reading.
Bonus Video:


external link:


3 min read
“95% of all traders fail” is the most commonly used trading related statistic around the internet. But no research paper exists that proves this...

3 min read
Trendlines can be great trading tools if used correctly and in this post, I am going to share three powerful trendline strategies with you.

3 min read
Choosing the right trading journal is essential for traders wanting to analyze performance, refine strategies, and improve consistency. In this...