Supply and Demand Trading in 2026
We have been trading supply and demand strategies for over ten years, and they have stood the test of time remarkably well. Supply and demand is...
There are plenty of markets out there to choose from. Most people randomly choose a market because they heard from a friend that it trades nicely, or they saw the SPX500 on TV. While it is true that, for example, futures move differently than Forex, and that it pays off to get to know a market intimately, it makes even more sense to get to know a bunch of markets and then be able to choose from the ones that move the best at that moment. For example, I trade every pair I can find in Forex. If it moves, and the moves are big enough in relation to the costs of trading, you can be sure that I am looking for a trade. But that is not all I keep an eye out for when deciding what to trade and which charts to toss.
As a trend trader, we obviously want trending markets, and as a counter-trend trader, we want some swings in there to give us opportunities to enter. Range bound strategies look for ranging instruments. While this is obvious when I say it, it is also very obvious that all the traders out there try to apply their trend trading strategies to a ranging market, and their breakout strategies to a market in fake-out mood. There is no single strategy that works great in all market conditions, so identifying market conditions and then filtering charts for it is imperative. There are plenty of tools to help a trader decide which markets to trade, for example ATR/ADR, Bollinger Bands®, Moving Averages, correlations, or looking at range bars (the more print in a given time period, the more volatile a market is).
What I always preferred, however, was simply visually differentiating between charts that I like and charts that I don’t want to trade, be it for my daytrading or my longer term trading.
Let me give you an example of an ugly chart, by my definition, for a trend trading strategy.
You can also call this chart “waiting to be whipsawed” if you want to. While other strategies might work perfectly fine given this condition, our trend trading strategy will be of no use here and cost us a lot of money. Now let’s look at a pretty chart.
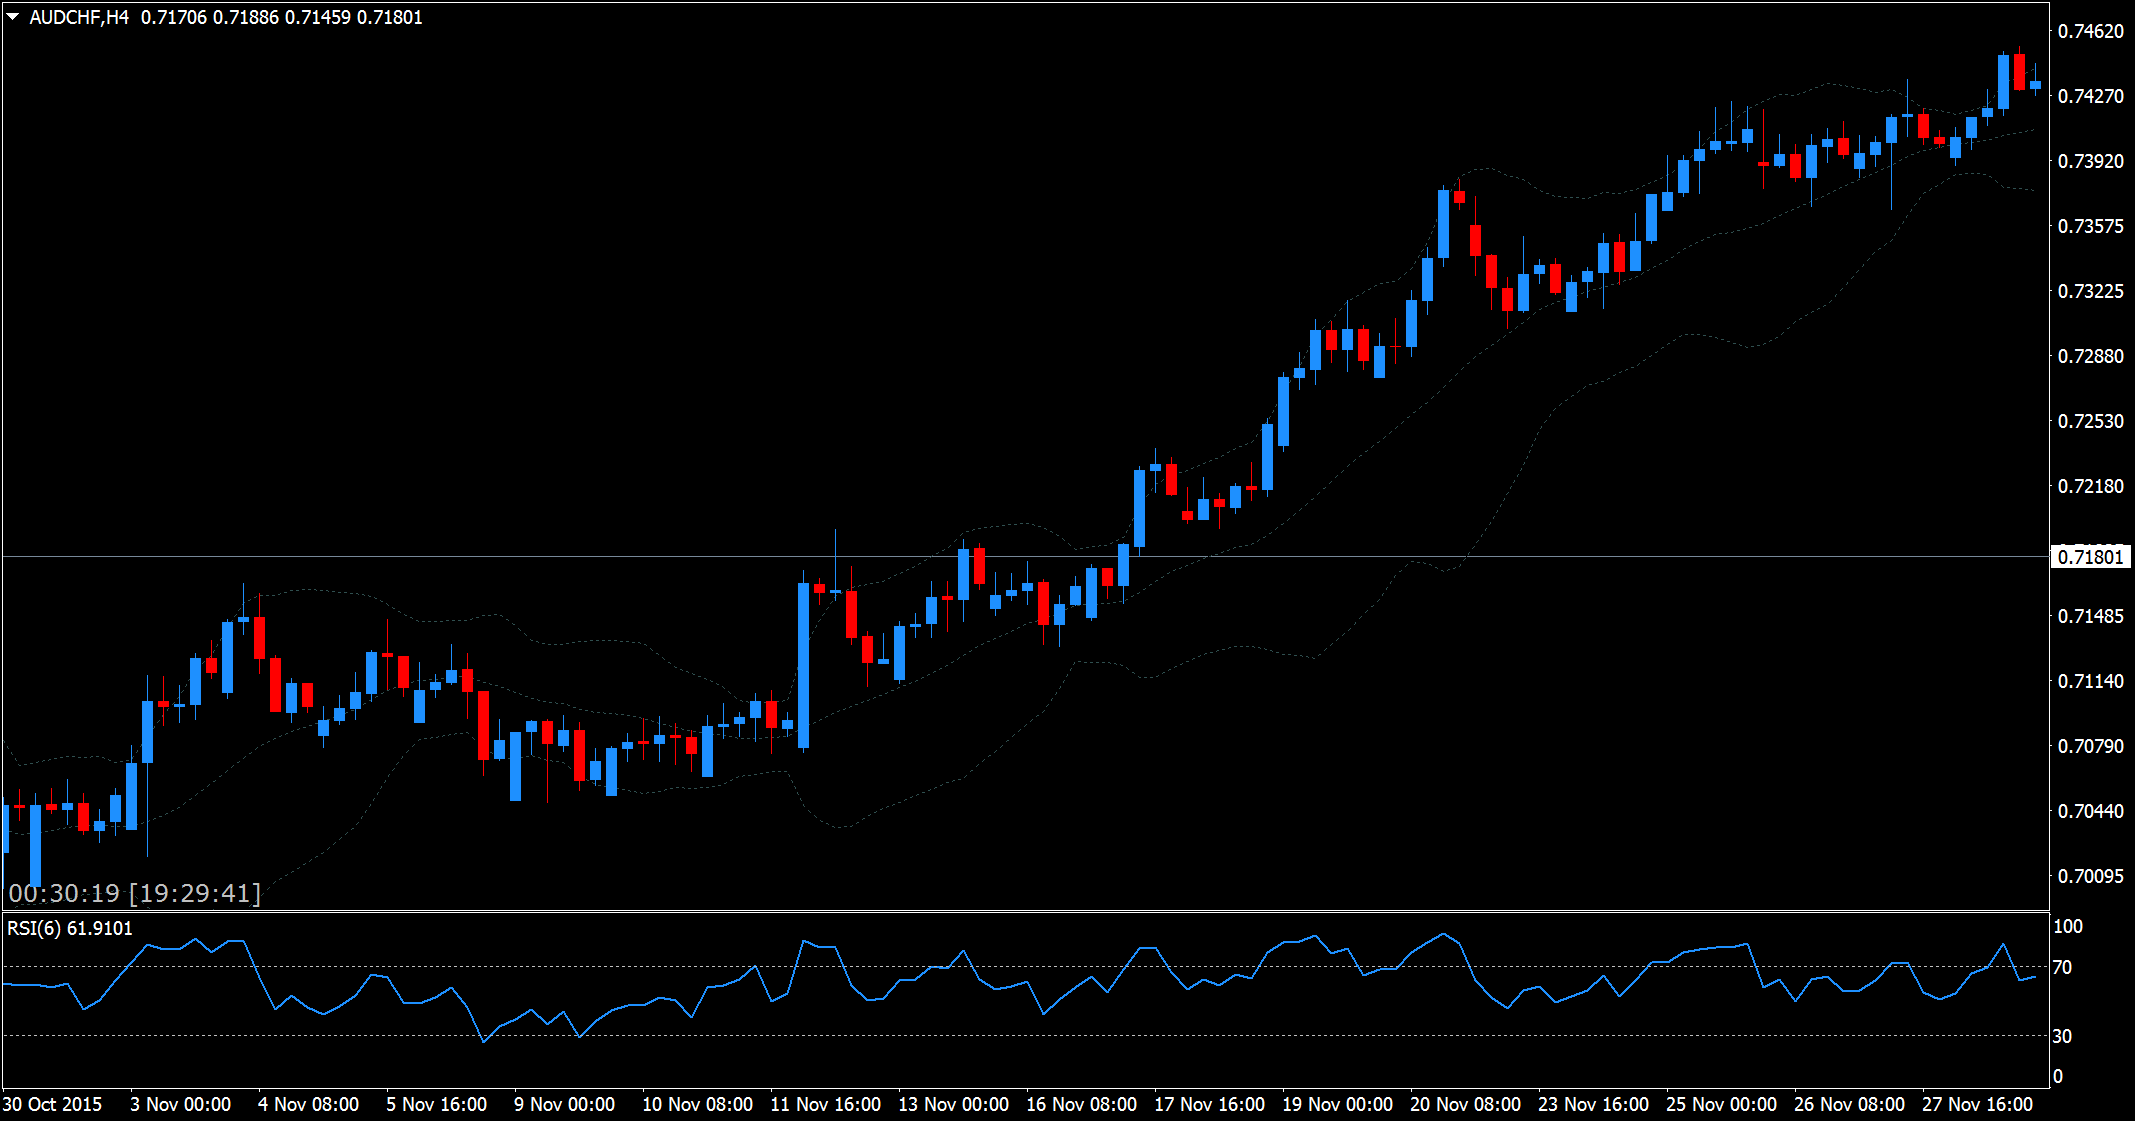
The differences are of course, obvious. The problem that plagues us as trend traders (and all the other traders as well, really) is that we do not want to hop onto a trend too early, as it might be a fake-out, but we also don’t want to join the party too late so we can still make some money before trend exhaustion. The market is always transitioning between ranging and trending periods, and the earlier and the more accurate we can identify a transition from on state to another, the easier it will be for us to capitalize on it. Let’s look at a transition period.
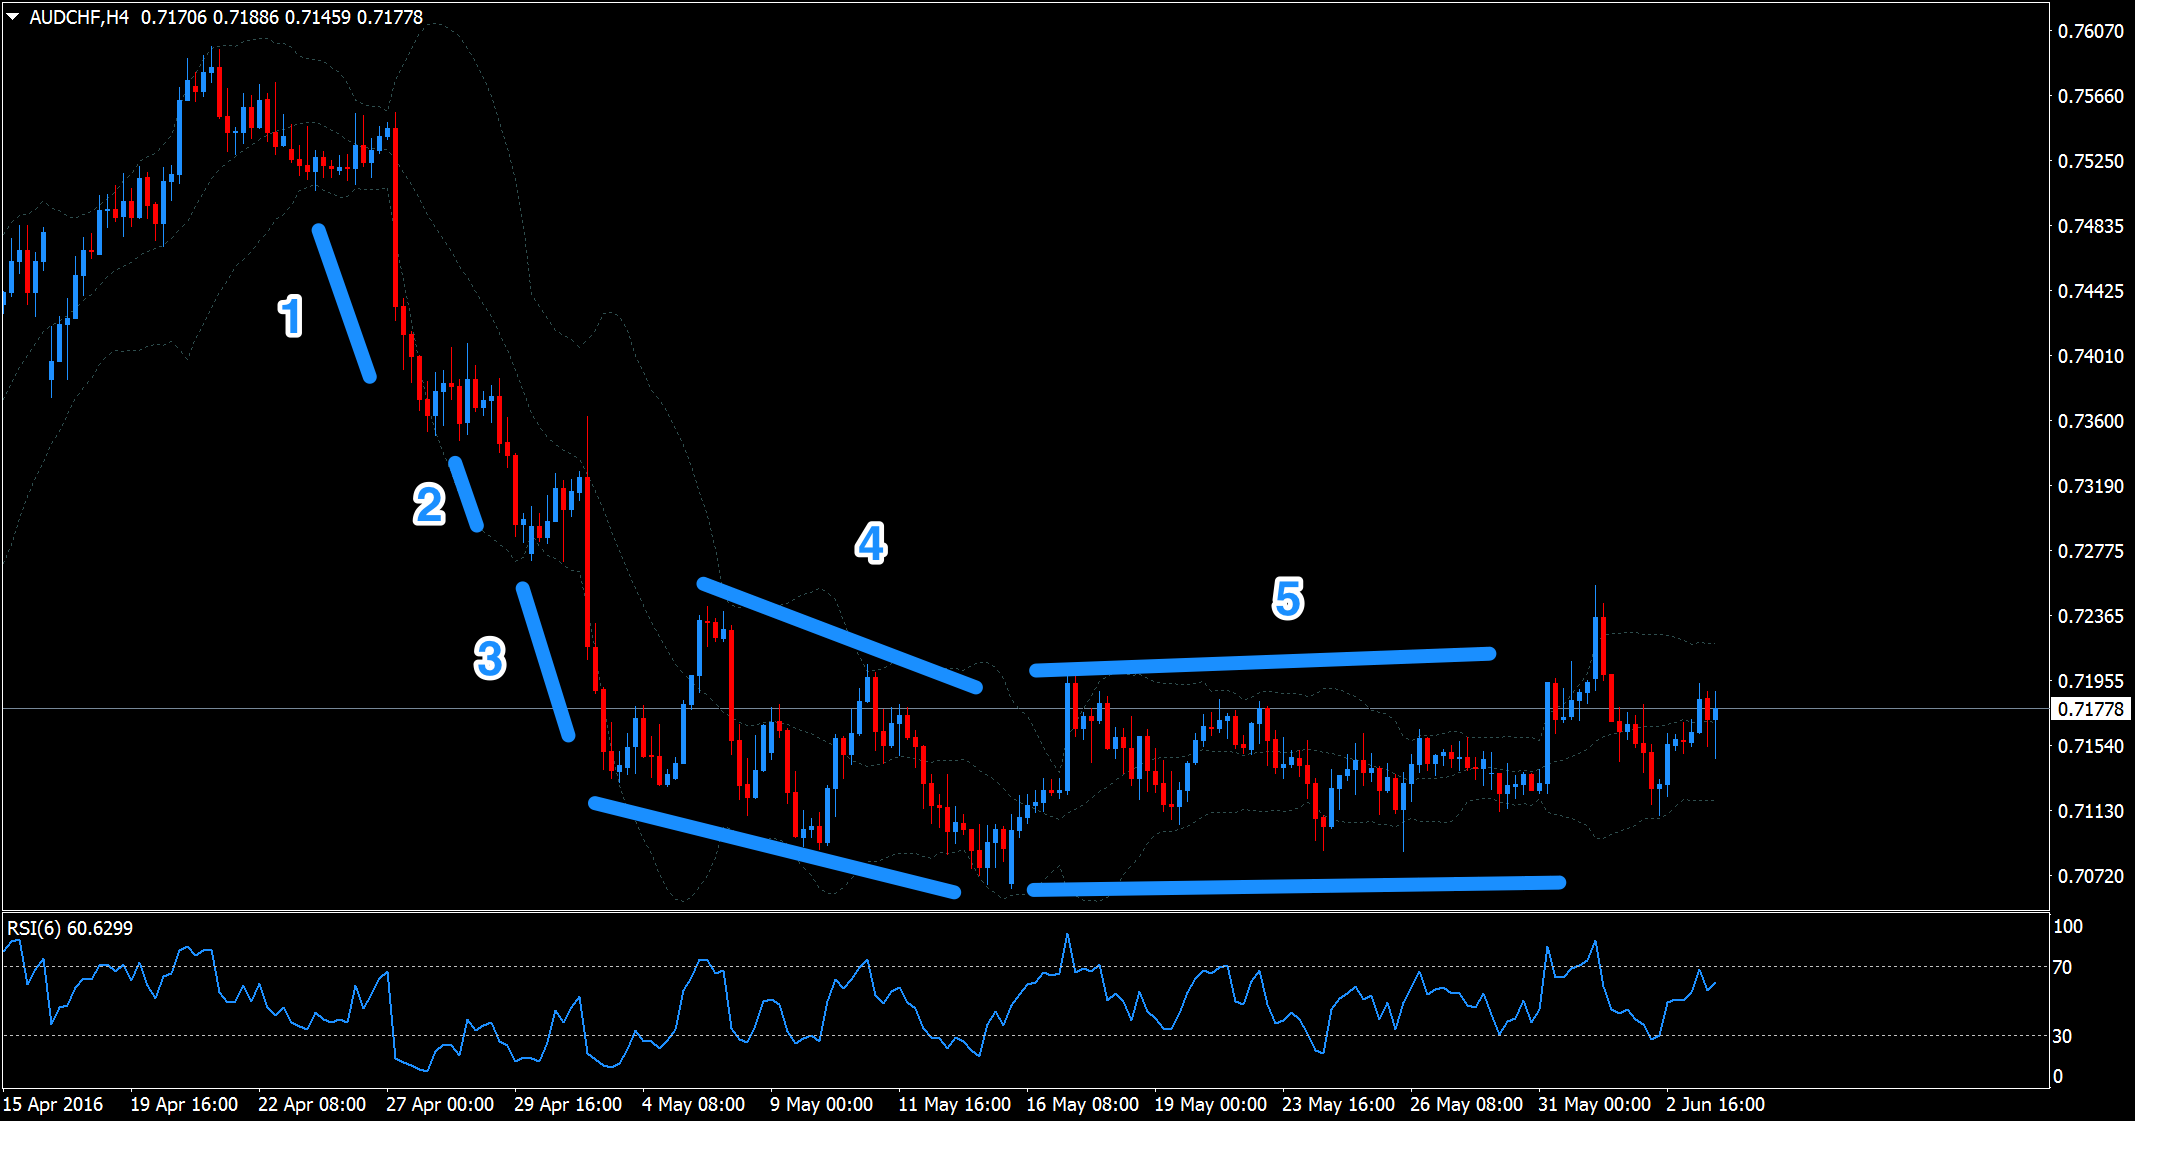
Above, we have a typical trend structure with 3 shoves to the downside (1,2,3), after which we transition into a down-sloping channel, and finally slide into a horizontal range. Latest after 4, a trend trader, a range trader and every other trader has to recognize that the trend for now is over and we are going back into consolidation before continuing downwards or reversing to the upside. While in (4) a great deal of confusion will be had for trend traders as well as for range traders, (5) will leave no questions open which strategy should be applied – a range bound strategy.
Markets do two things: consolidate or trend. It is absolutely imperative for a trader to recognize in which phase the market is at the moment, and how long it has been in that phase already. Every range will eventually break out (I start looking for breakouts after 2 hits on each side of a range), and every trend will eventually break down (I use simple Elliot Wave Theory – 3 waves, look for signs of exhaustion e.g. divergences), so we must apply the right tools at the right time.
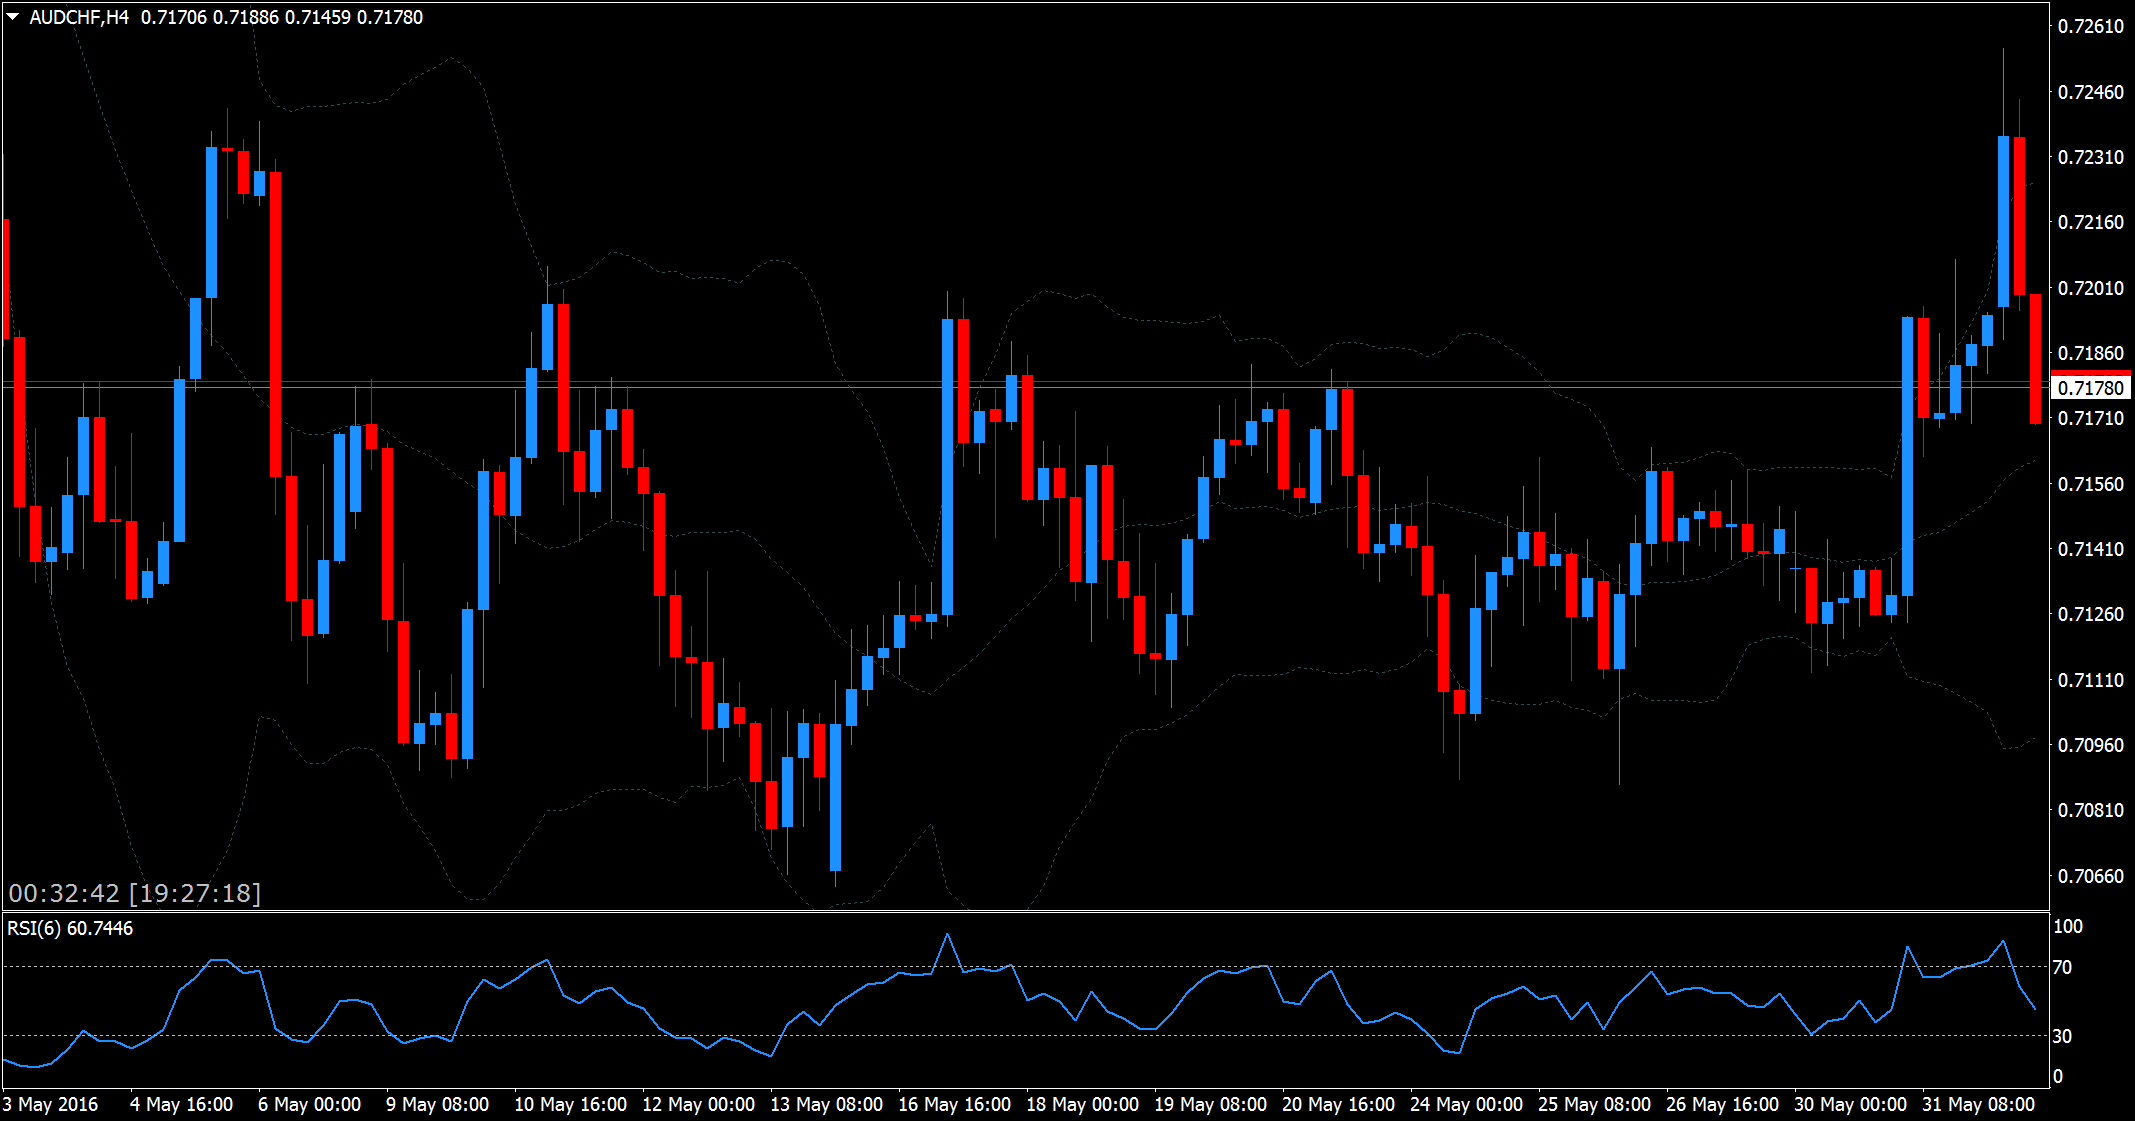
Then we also have charts where we absolutely do not know what the hell the market is doing because the market itself is confused as well. We stay away from these charts when we cannot clearly define which phase of a market we are in, as we should not trade when we don’t have a clue. Here is an example.
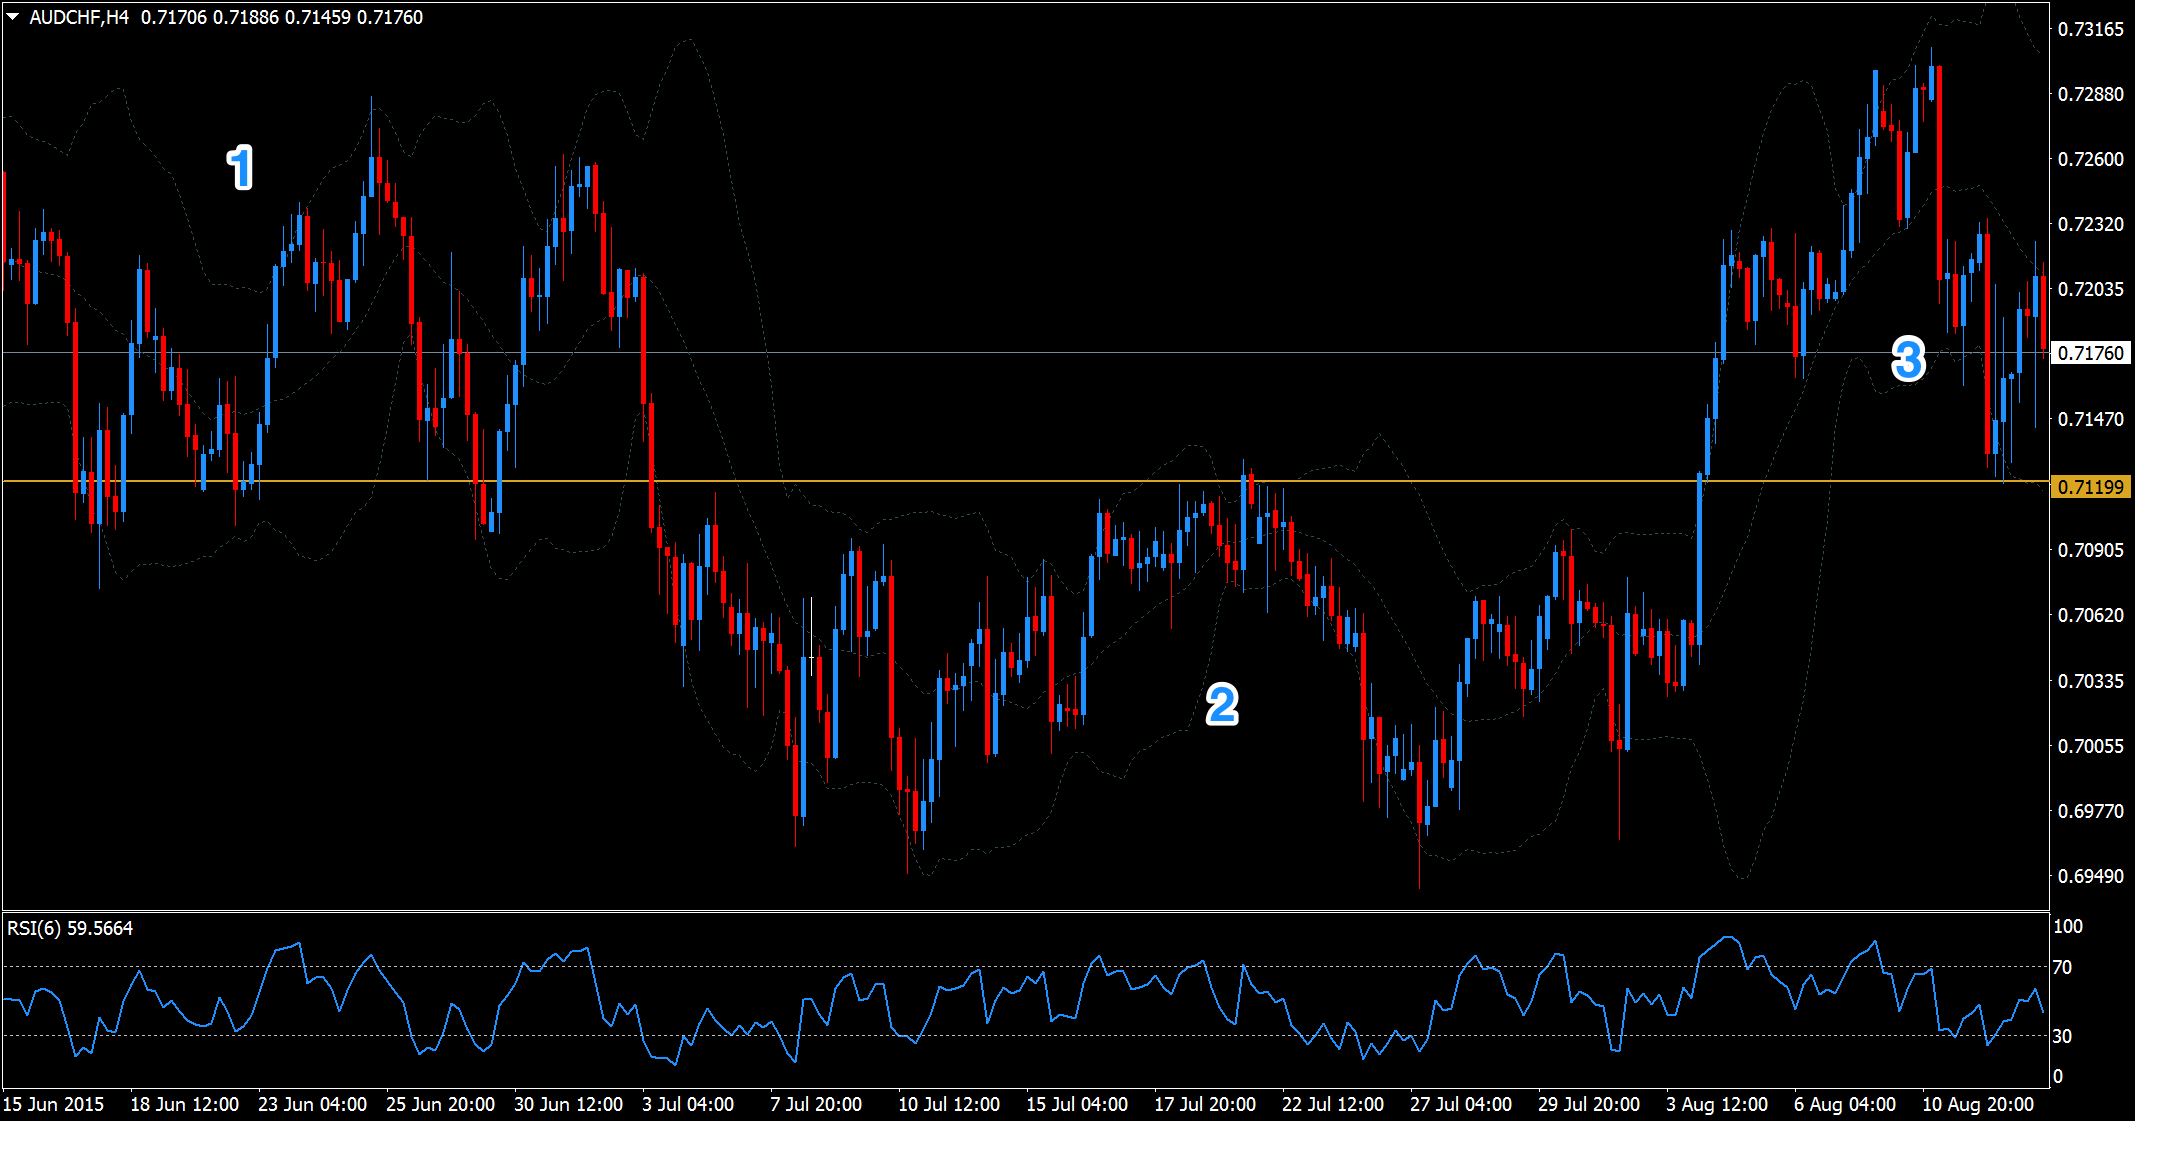
Here, we transition from one range (1) immediately into the next range (2) and then flip back into our first range zone (3). While there are viable strategies to trade this, of course, in my book the market does not reveal his hand here. When I see a chart like this I toss it out of my cycle immediately and don’t look at it again until next week. I will then check whether there was a breakout and a clear statement of direction, after which I can start looking for trades again.
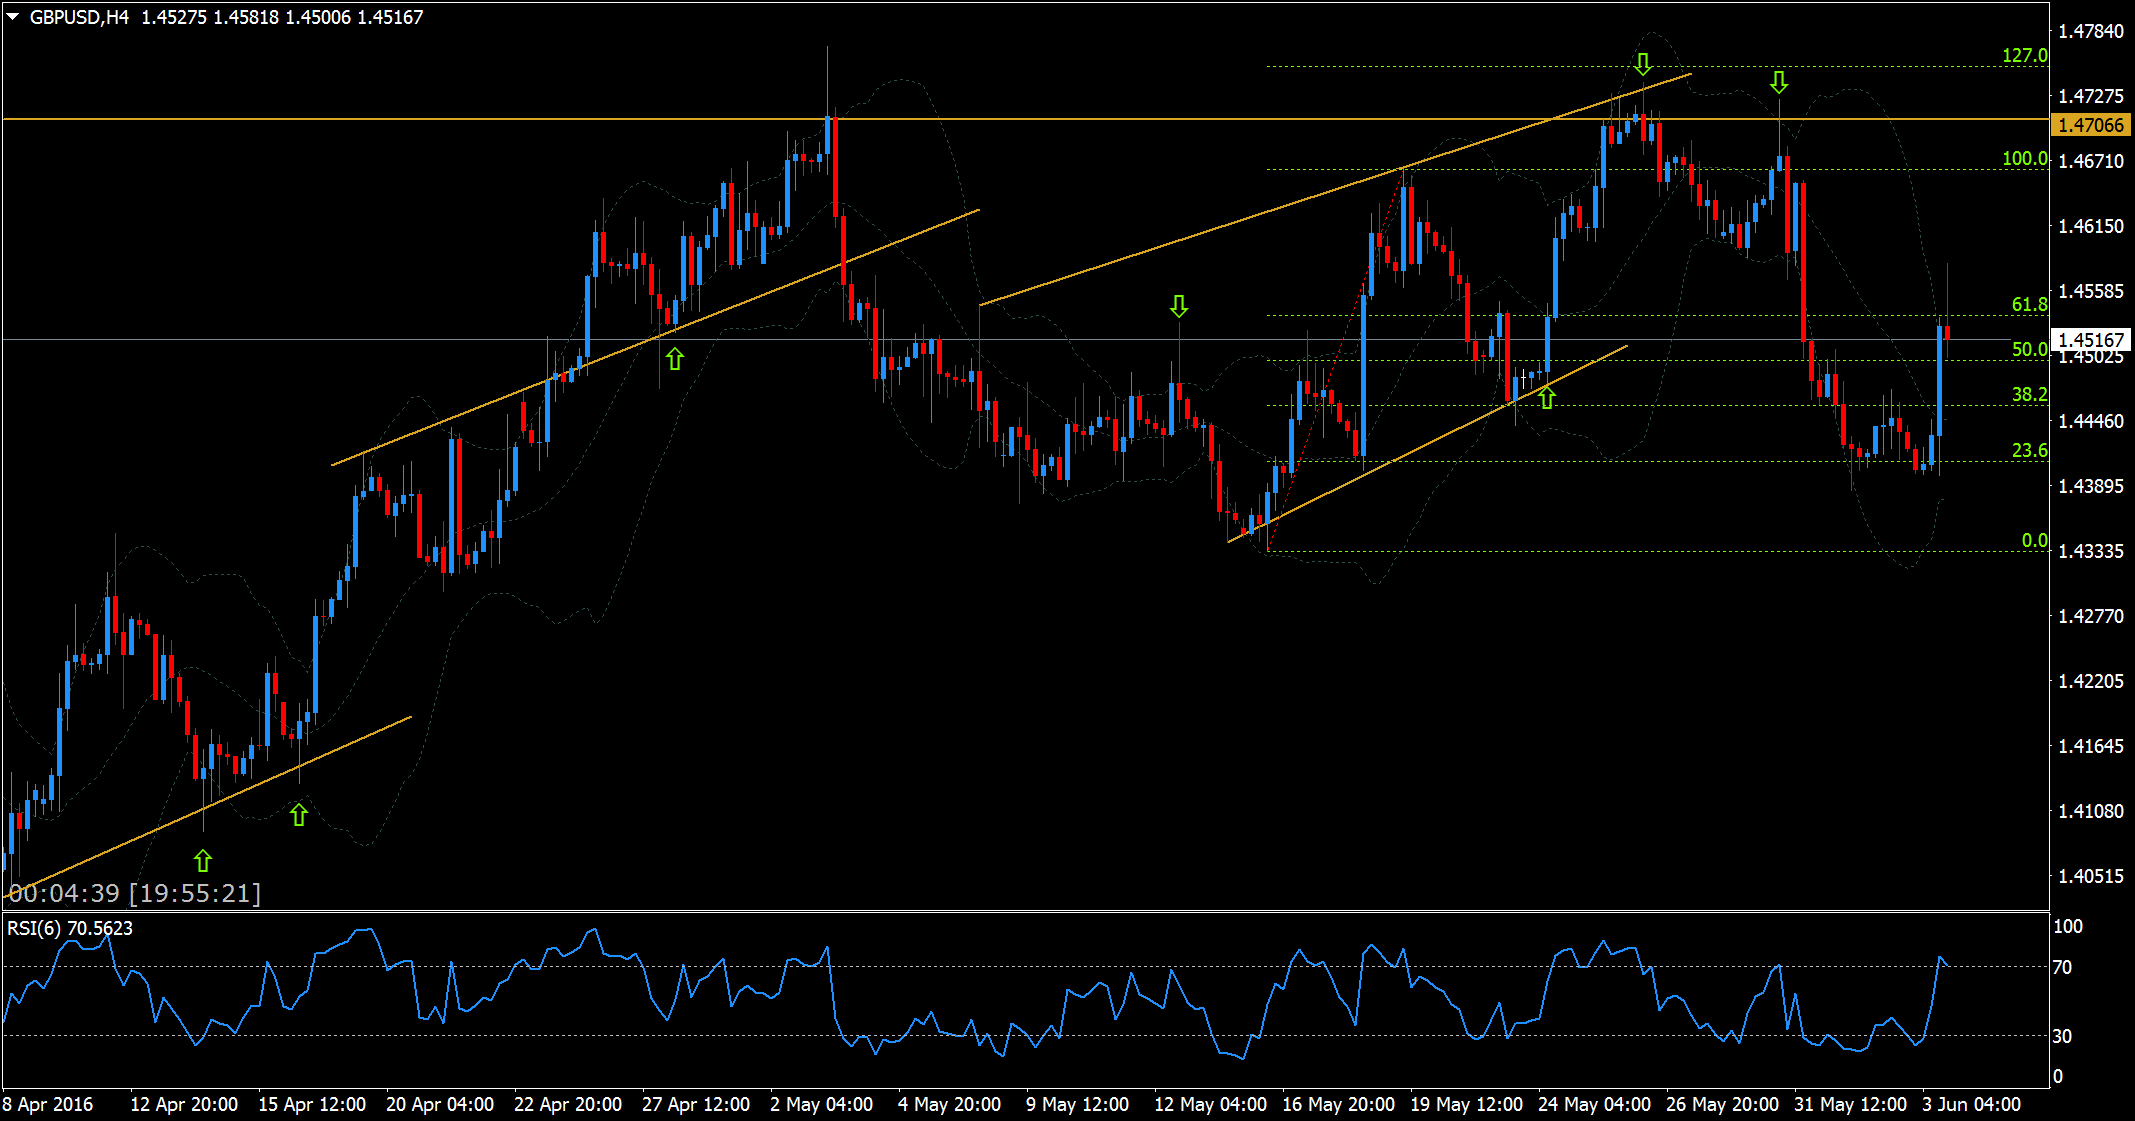
I want clearly defined swings, a market that is clearly moving into a direction and/or reacting to the technicals I draw properly (trendlines, levels, and Fibonacci retracements). Also, it has to allow me to draw technical levels in the first place. If I cannot find levels and/or trendlines that make sense to me, I am not trading it. Below is another example of a chart that has been very good to me lately which I love to trade. The green arrows are trades I took.

When I see a chart like this, I get $-signs in my eyes. The market is moving in a huge range, after coming up from a nice trend, showing very nice reactions to levels and trendlines, and giving me clear swings without much whipsawing. This is exactly what I am looking for – these conditions are easy to trade, as entries are easier to identify, and your trades will make it faster to their designations, allowing for less room for mistakes.
To summarize, I urge you to think clearly about in which market environment your strategy likely works best, and then work on identifying that exact market environment. Your trading will become a lot easier. As a daytrader, simply look at what price did in the session before you start trading, or what it did for the last 2 days. As a longer term trader, simply scan your charts each Sunday for the beautiful movers and trade only these. There will still be plenty of setups and the likelihood of them working out will be much higher.
external link:


We have been trading supply and demand strategies for over ten years, and they have stood the test of time remarkably well. Supply and demand is...

3 min read
Choosing the right trading journal is essential for traders wanting to analyze performance, refine strategies, and improve consistency. In this...

3 min read
“95% of all traders fail” is the most commonly used trading related statistic around the internet. But no research paper exists that proves this...