3 min read
Scientist Discovered Why Most Traders Lose Money – 24 Surprising Statistics
“95% of all traders fail” is the most commonly used trading related statistic around the internet. But no research paper exists that proves this...
I want to show you how to build confluence in your trading approach to get more robust trade signals. Confluence means that you are using multiple entry signals and criteria for your trade entries. Although you need to “keep it simple” when it comes to trading systems, a robust trading system is always based on the concept of confluence.
The more factors you can find that supports your trade idea, the more confidence a trader can have in his trade idea. In this trade review, I show you how to use up to 7 layers of confluence.
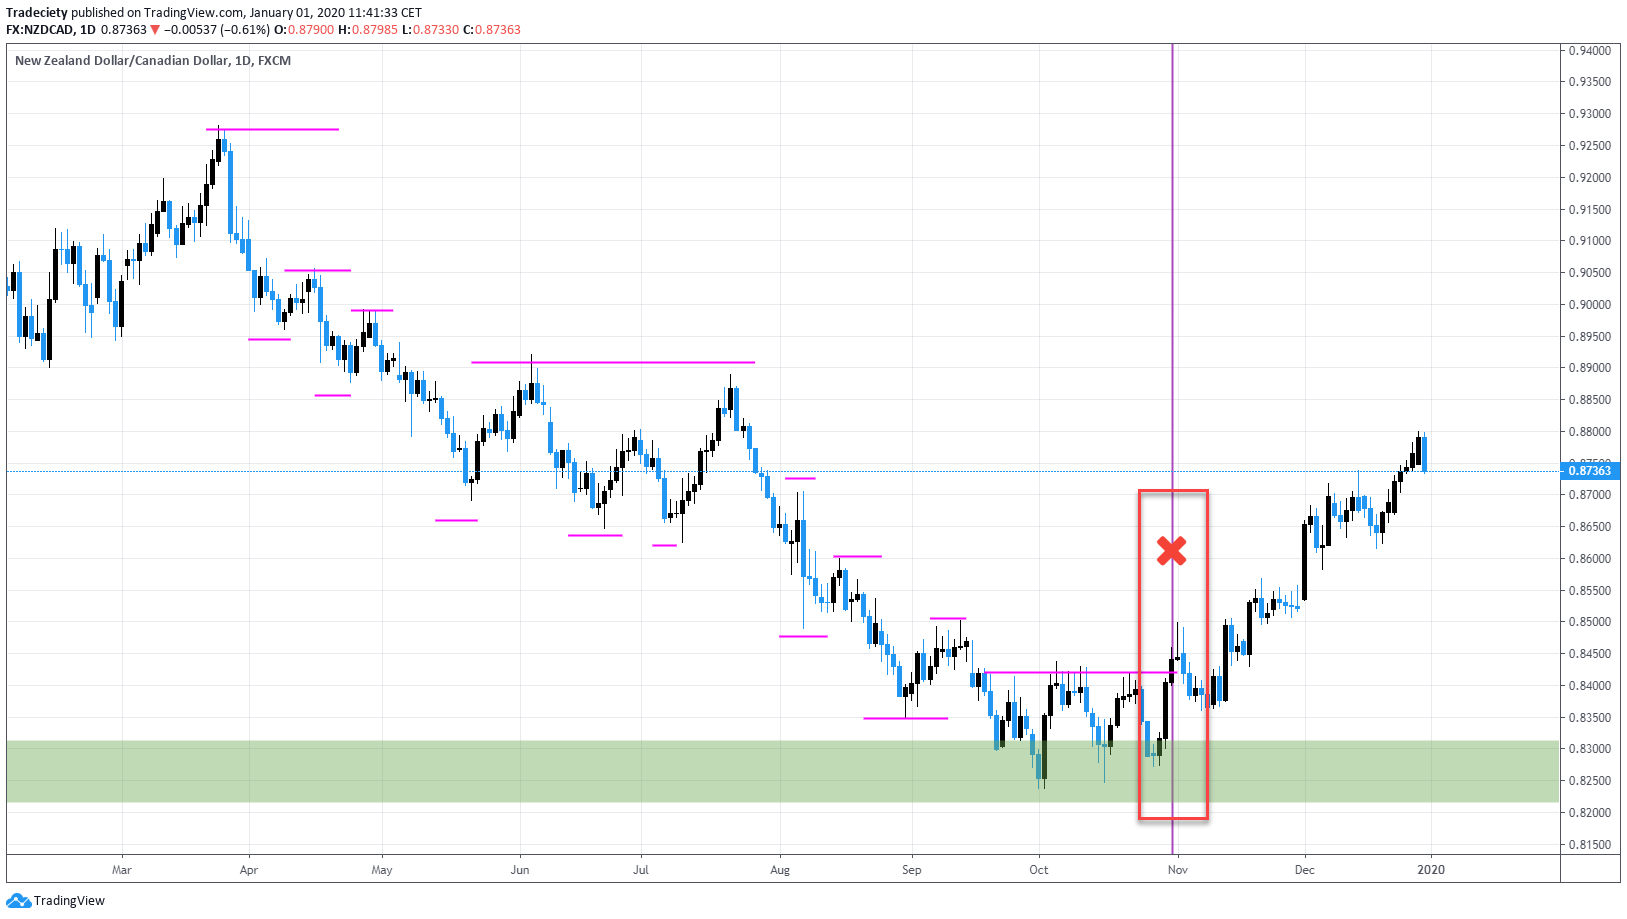
One of the most important confluence factors is key levels. Instead of taking trading signals all over the place, waiting for the price to get to important key levels can improve your chances significantly.
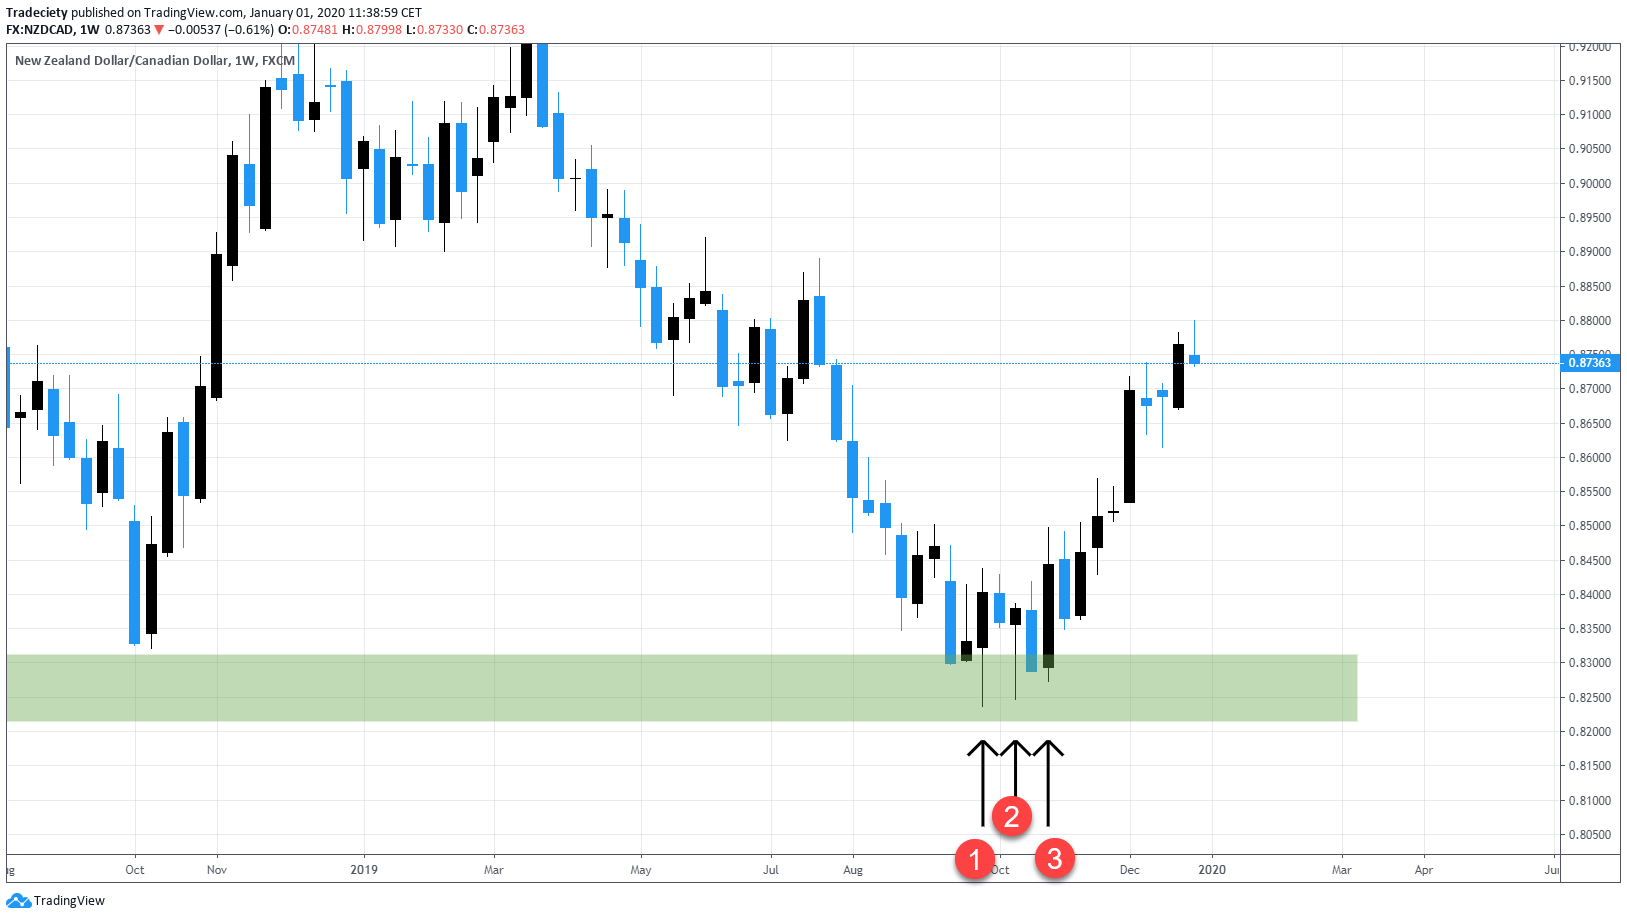
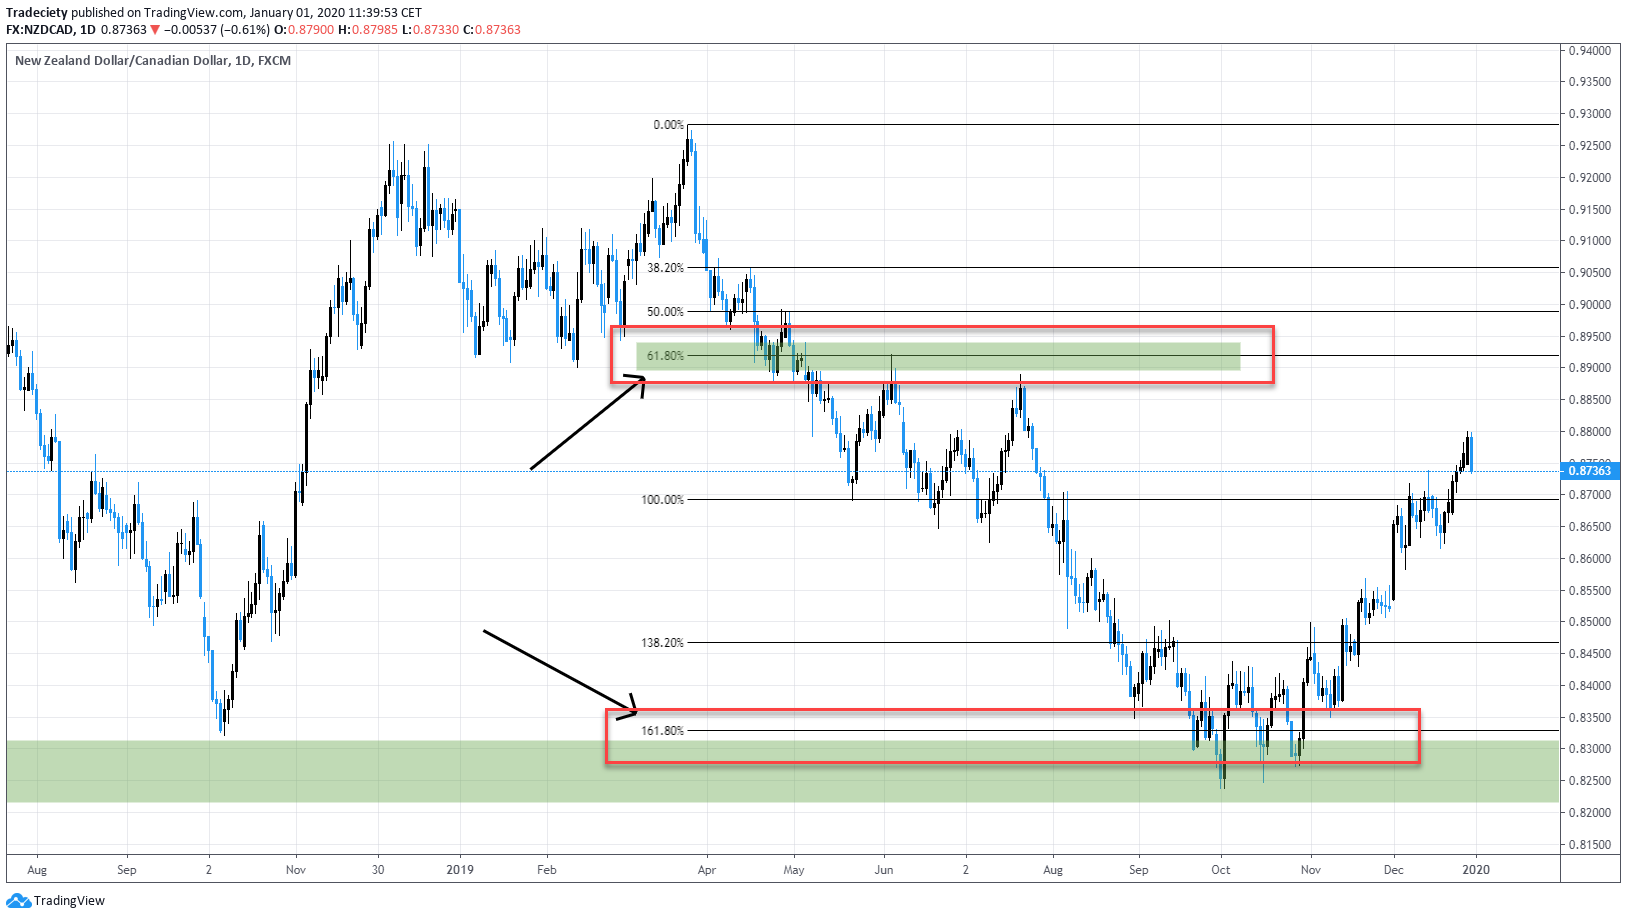
When you take a birds-eye view on the weekly chart, we can identify points 1 and 2 which have been major turning points in the past. All I did then was to wait for the price to come back to this price zone and wait for more confluence factors. Many traders make this mistake of trading such levels blindly without any additional confluence factors but just because a price level was strong support in the past does not mean that it will also act as support again. This is just the start of building confluence.

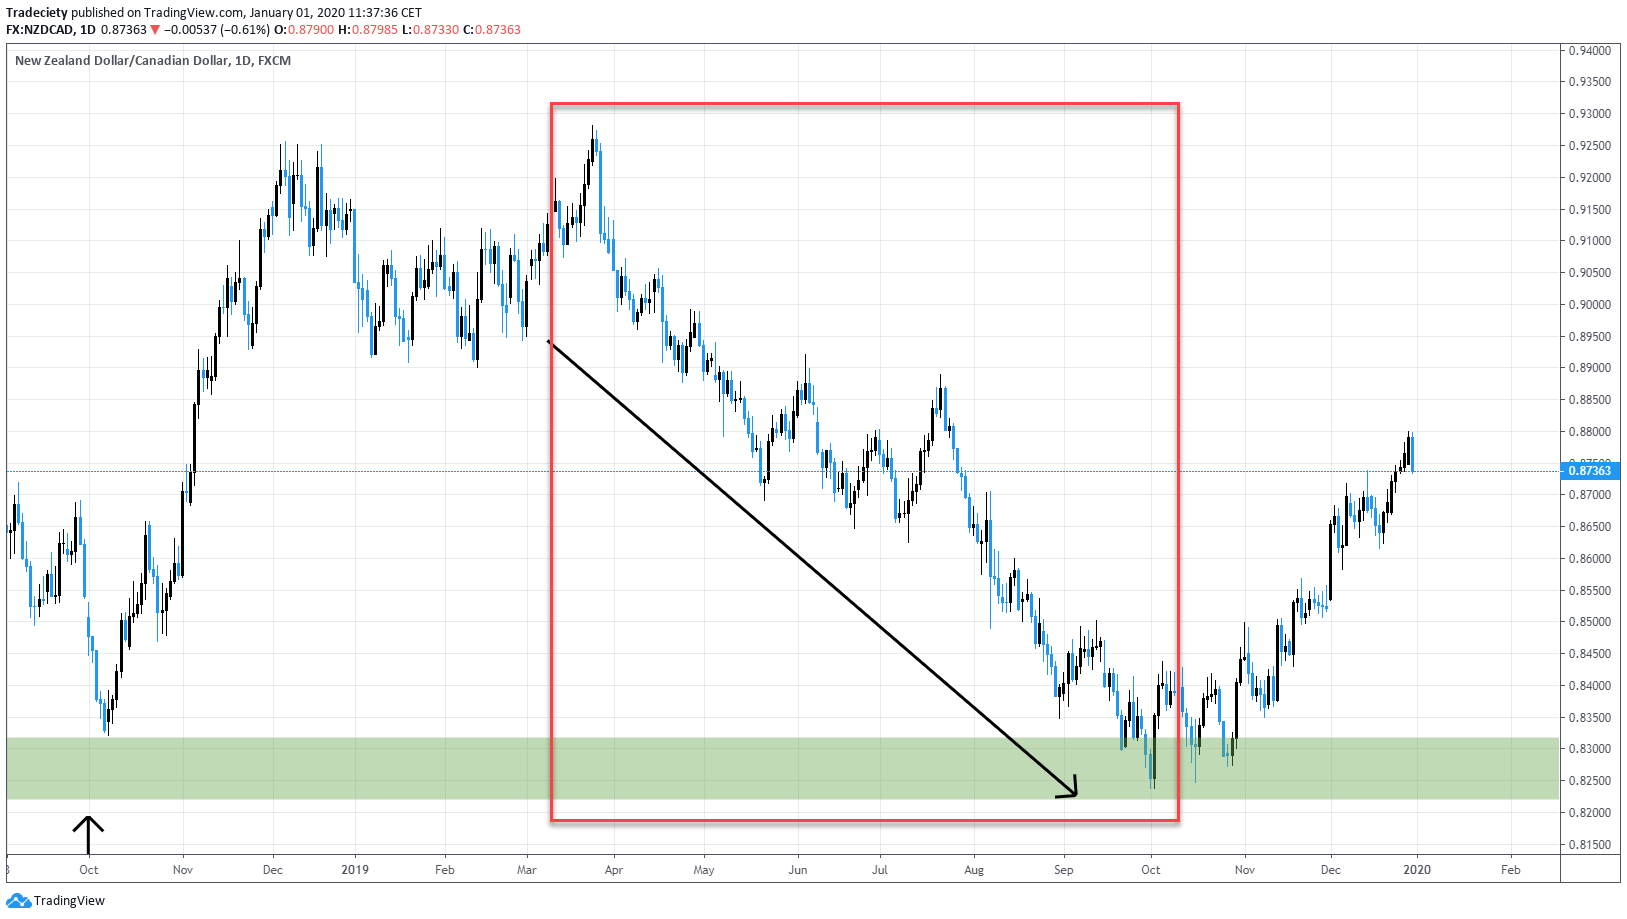
I trade mostly new trends and one confluence factor requires a previous strong trend. I found that the best chances for finding a new trend exist once there was an ongoing trend in the opposite direction. This effect often works like a rubber band – the stronger it is stretched, the stronger the reaction once it has been released. Before the price moved into the support level we identified at step 1, the price showed an extended downtrend.
I avoid range markets and noisy markets and this is a very important confluence factor for this specific trading approach.
On the higher timeframe, the candlesticks also showed new buying pressure. Candle 1 and 2 have long candlestick wicks which shoe reception at the support level. Suddenly, the sellers are not as strong anymore and they can’t push the price into new lows.
Candle 3 is strong engulfing candlestick which shows heavy buying pressure.
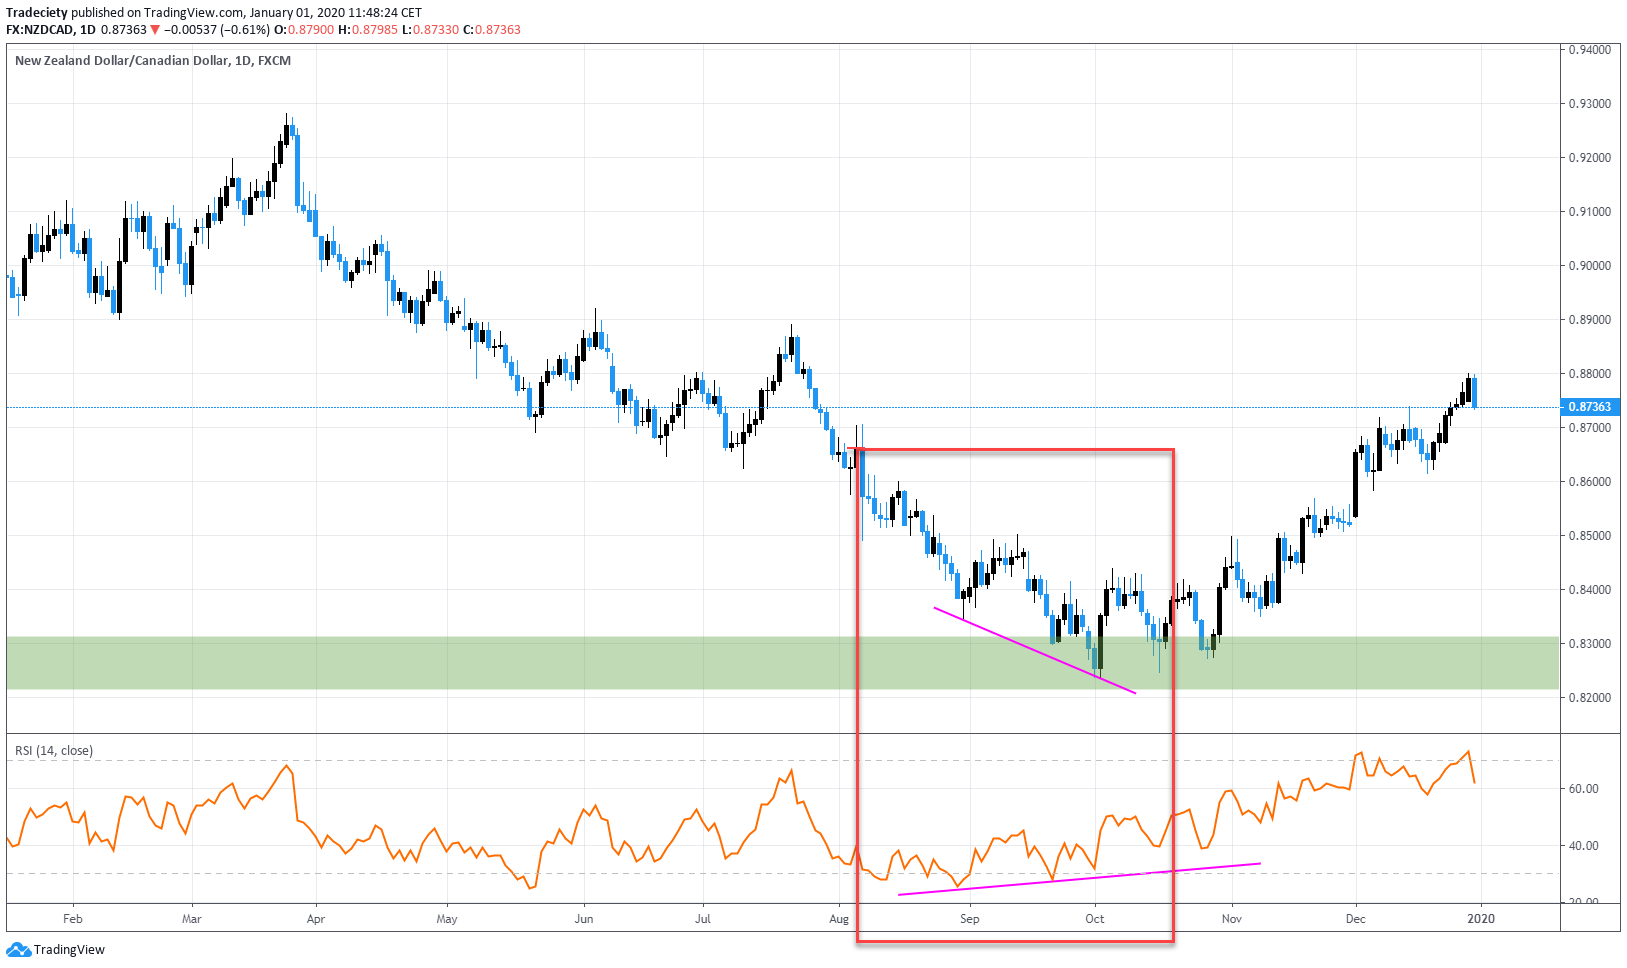
The RSI indicator analyzes momentum and when the price moved into the support level from step 1, the bearish trend waves became shorter and the bullish corrective waves became stronger. Therefore, the RSI indicator showed a divergence, indicating the loss of bearish pressure.
When we apply a Fibonacci sequence to the previous downtrend, we can find a completed 61.8 >> 161.8 sequence. This is a common pattern and once the price has completed such a sequence, the likelihood that the trend will end increases.
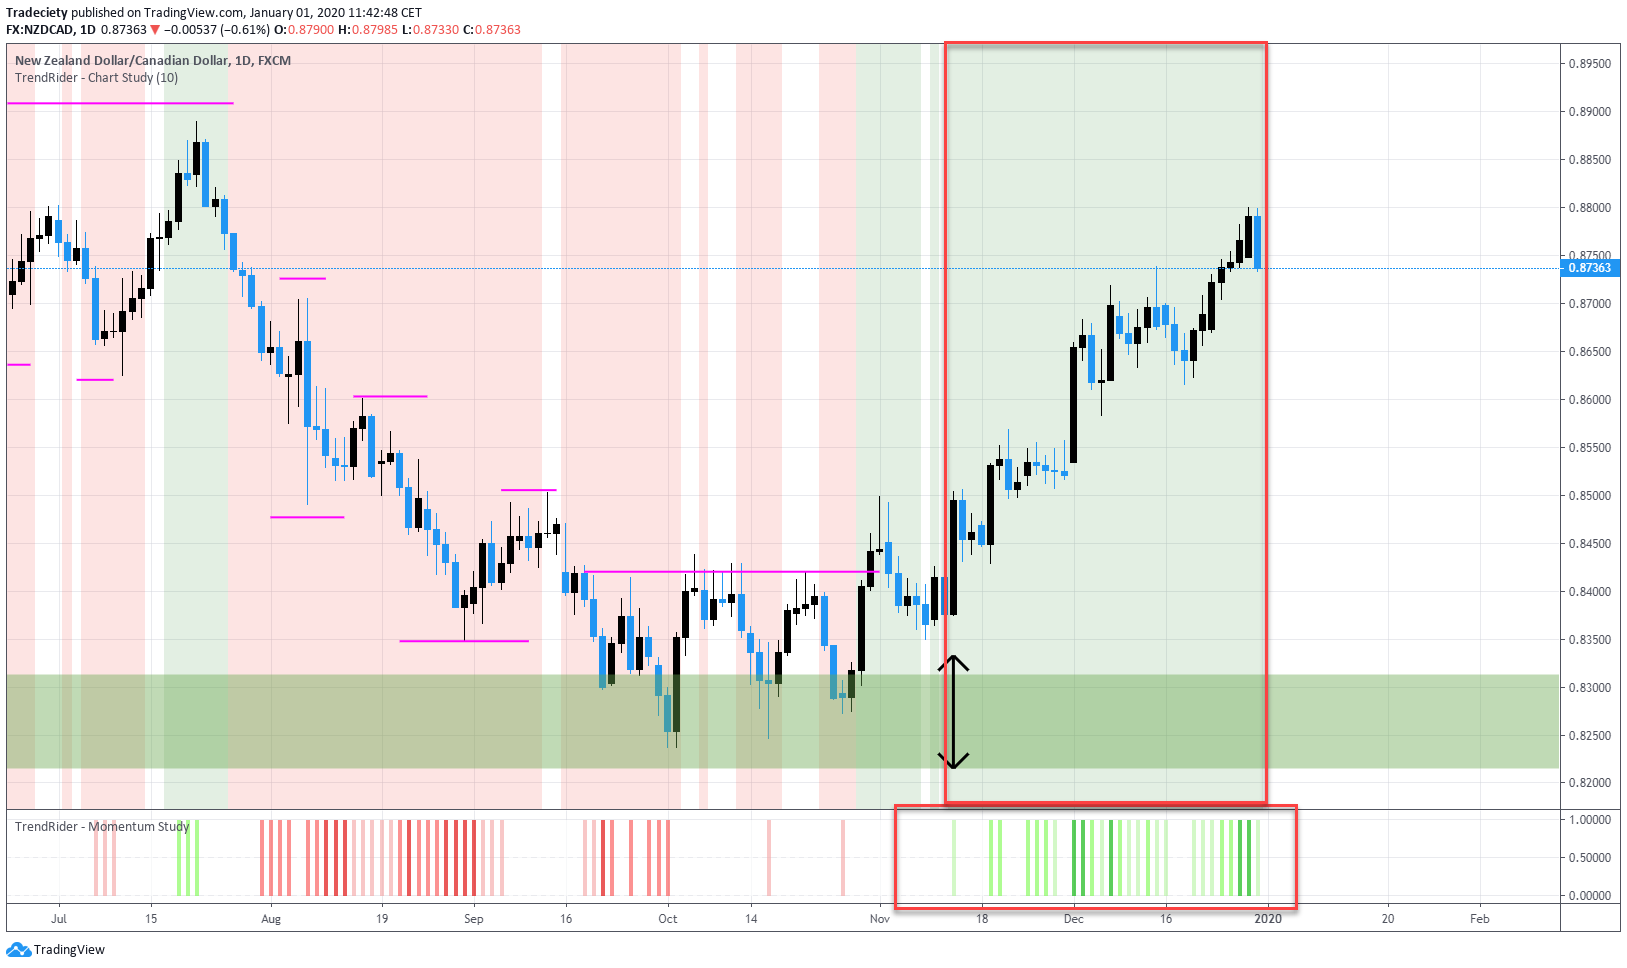
When we look at the downtrend, we can clearly observe the trend structure with lower highs and lower lows. This trend structure was never broken until the price had reached the major support level.
Once the price made a higher high while failing to make lower lows, a change in trend direction becomes even more likely.

And even the Trend Rider provided a bullish signal at the turning point.
When the histogram at the bottom printed the first green bar, everything came together and the new trend was able to take off.
I hope this article will help you create more ideas for your own trading and how to use the concept of confluence to build a more robust trading approach.


external link:


3 min read
“95% of all traders fail” is the most commonly used trading related statistic around the internet. But no research paper exists that proves this...

3 min read
Trendlines can be great trading tools if used correctly and in this post, I am going to share three powerful trendline strategies with you.

3 min read
Choosing the right trading journal is essential for traders wanting to analyze performance, refine strategies, and improve consistency. In this...