3 min read
Scientist Discovered Why Most Traders Lose Money – 24 Surprising Statistics
“95% of all traders fail” is the most commonly used trading related statistic around the internet. But no research paper exists that proves this...

Bill M. Williams, Ph.D. is considered as one of the forefathers of modern trading psychology. Back in the 1980’s, he came up with chaos theory that offered a methodological understanding of market structures. He combined trading psychology with applied technical analysis and offered a vastly advance trading system that was ahead of his time. Even today, both retail and institutional traders consider his Chaos theory, Wiseman Indicators, and the Alligator Trading System to be one of the most sophisticated technical analysis systems.
In line with his chaos theory, Dr. Williams developed a range of technical indicators. His approach to technical analysis and proper use of the Wiseman Indicators combined with the rules he outlined makes up the bulk of the Alligator Trading System.
Fractals are labeled by Dr. Williams as the first dimension of his technical analysis system. Fractals are essentially short-term support and resistance levels in the price chart, and these are the fundamental building blocks of the Alligator Trading System.
The Alligator Trading System is a rather complicated system as it uses several different Wiseman Indicators in combination with some sophisticated rules to enter the market, scale positions, and has clearly defined rules about when to get out of the market.
The beauty of the system is that once you have learned to use the Wiseman Indicators in combination with the Chaos Theory, scanning markets and getting a proper understanding about the ongoing trend, or lack of it, will become a child’s play.
The first indicator you should look for in the Alligator Trading System is the Alligator itself.
The Alligator indicator is made up of three moving averages:
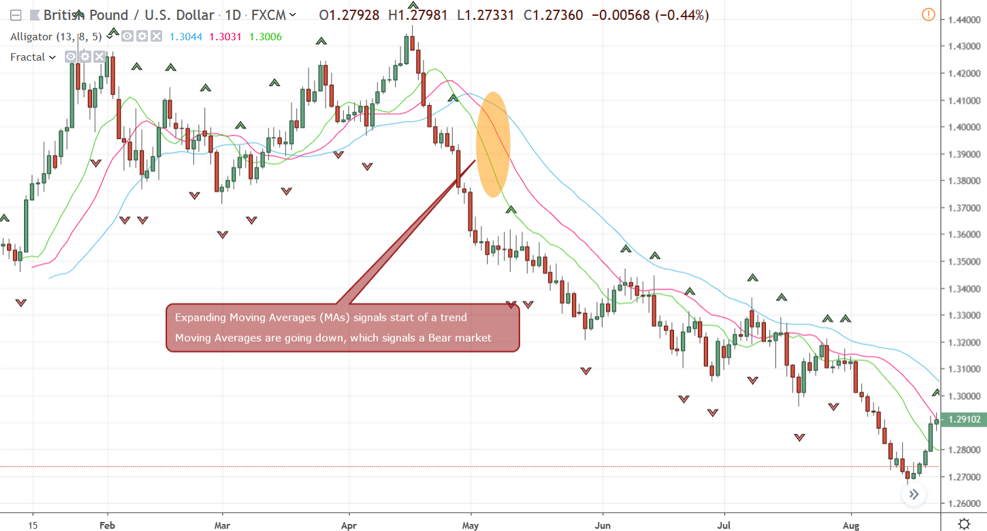
Figure 1: Expanding Moving Averages of Alligator Indicate Start of a Trending Market
When the three moving averages are expanding while going up, it signals a bull market. On the other hand, when the moving averages are expanding while going down, it signals a bear market. Very simple!
Statistically, most markets remain range bound for around 70 percent of the time and trends only around 30 percent of the time. Since the Alligator Trading System is mainly a trend following system, the great thing about the Alligator indicator that it can easily identify if a market is trending or it is trading sideways within well-defined support and resistance levels.
When the Alligator’s moving averages are contracting, it signals a sideways market and according to the system rules, you should stay on the sidelines and wait for the next trend to develop.
There are several other indicators in the Alligator Trading System, such as Awesome Oscillator (AO) and Accelerator Oscillator (AC) that are used to scale in positions after the system generates its first signal. However, to get the first signal, you need to have a thorough understanding of how the Fractal indicator works.
Hence, once you have identified a trending market based on the Alligator signal, you need to look for Fractals first to get into the trade.
Visually, Fractals are just tiny upwards and downwards pointing arrows. In a nutshell, an Up-fractal is formulated when a series of five successive time periods conclude and the highest HIGH forms in the middle with two lower HIGHs on both sides of the middle bar. Similarly, a Down Fractal is formulated when a series of five successive time periods conclude and the lowest LOW forms in the middle with two higher LOWs on both sides of the middle bar.
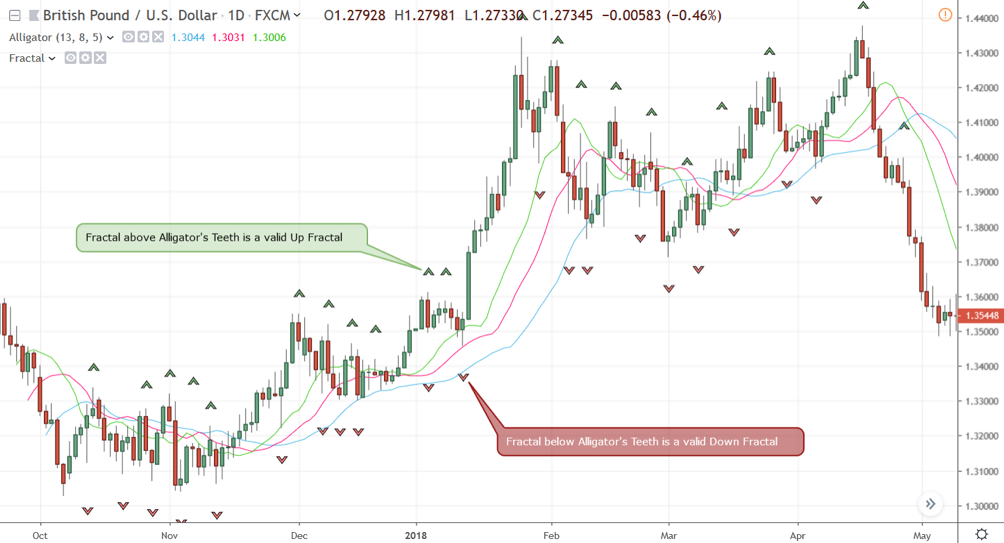
Figure 2: Fractals Forming Above or Below the Alligator’s Teeth in the Direction of the Trend Are Valid
According to the Alligator Trading System, just because an up or a down Fractal is formed, it does not mean that these are valid signals! You have to interpret the Fractal in relation to the Alligator indicator and pay attention to the Alligator’s Teeth, which is the red line in the middle.
If an Up Fractal form above the Alligator’s Teeth, only then it should be considered valid. By contrast, if the Down Fractal forms below the Alligator’s Teeth, then you can consider it to be valid. However, keep in mind that any Up Fractal that formed below the Alligator’s Teeth is not valid and vice-versa.
While the Chaos theory and the Alligator Trading System is rather a complex endeavor to undertake, trading Fractals in conjunction with the Alligator indicator is a rather simple process.
Once you find a Fractal that is either above or below the Alligator’s Teeth, wait for the Alligator to start opening its Jaw, which happens when the three moving averages start to expand. If the Alligator indicator is signaling an uptrend, simply place a Stop Buy order one tick above the Up Fractal in the direction of the trend. Similarly, if the Alligator indicator is signaling a downturn, put a Stop Sell order one tick below the Down Fractal with your broker.
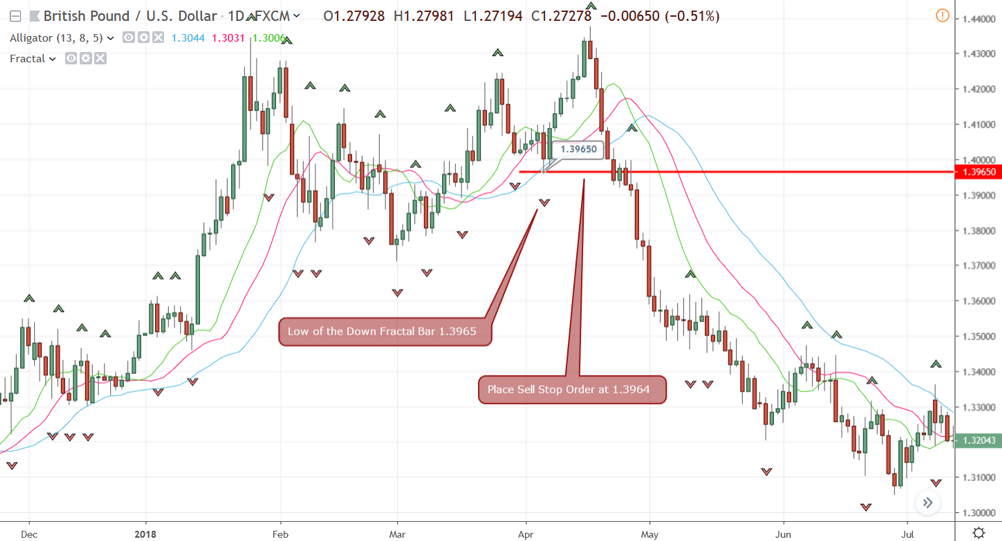
Figure 3: During a Downtrend, Simply Place a Sell Stop Order One Tick Below the Fractal Bar’s Low
In Figure 3, we have identified a Down Fractal with the bar’s low at 1.3965. Once the Alligator indicator would confirm the downturn by starting to open its Jaw, in this scenario, you can simply place a Sell Stop order at 1.6934 and wait for the price to trigger your entry order.
While this example only deals with a downtrend, as you can imagine, if you find an uptrend, all you have to do is place a Buy Stop order a tick above the high of the Fractal bar. It is that simple!
Under the cover of price charts and technical indicators, in reality, any market only represents the subjective psychological valuation of any given asset. Bill Williams and his colleagues have developed the Chaos Theory and Fractal based trading system to visually represent the overall psychological orientation of almost any market and it makes life much easier for traders.
Once you have mastered how to use the Fractals in combination with the directional trend identified by the Alligator indicator, you can move on to learn the complete Alligator Trading System.


external link:


3 min read
“95% of all traders fail” is the most commonly used trading related statistic around the internet. But no research paper exists that proves this...

3 min read
Trendlines can be great trading tools if used correctly and in this post, I am going to share three powerful trendline strategies with you.

3 min read
Choosing the right trading journal is essential for traders wanting to analyze performance, refine strategies, and improve consistency. In this...