Supply and Demand Trading in 2026
We have been trading supply and demand strategies for over ten years, and they have stood the test of time remarkably well. Supply and demand is...

The Italian mathematician Fibonacci was one of the most talented Western mathematicians of the Middle Ages. He is known for introducing the Hindu–Arabic numeral system to the European academic circle. Today, he is famous among professional traders for his sequence of Fibonacci numbers that is being used for forecasting retracement levels and price projections.
However, there are a lot of applications of the Fibonacci numbers than simply drawing Fibonacci retracement and Fibonacci extension levels. If you want to truly harness the power of Fibonacci numbers, you should also consider using various other tools such as Fibonacci Circle, Fan, and Time Zone.
You are probably already familiar with drawing Fibonacci retracement levels to find potential support and resistance levels. However, these vertical lines only show us where the market may find major pivot zones. With traditional Fibonacci retracements levels, there is no way to predict when the price of an asset might reach these levels.
The best aspect of Fibonacci Circle or Fibonacci Arc is it adds the element of the time horizon to the chart. So, we can pinpoint exactly when the price will react to a certain support or resistance level in the future and plan our trades accordingly.
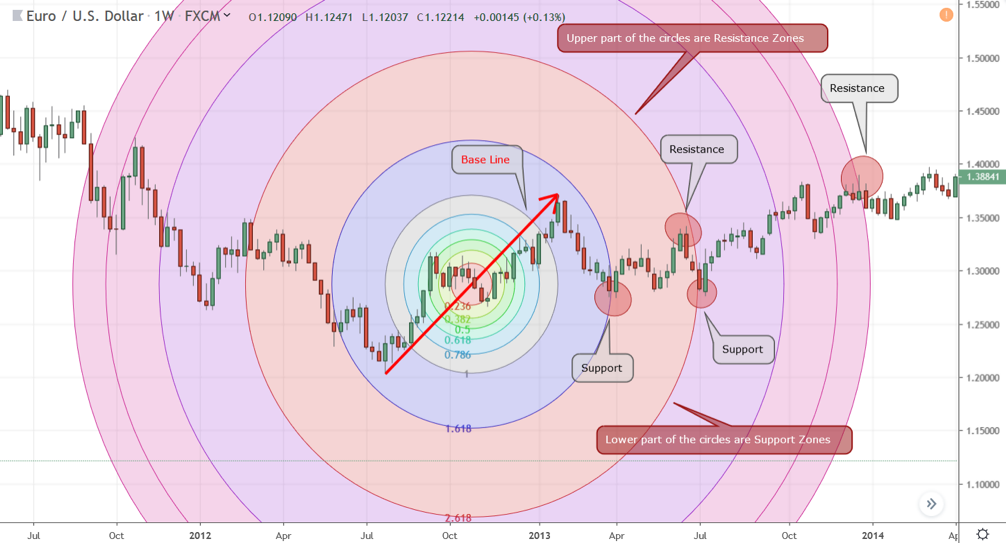
Figure 1: Fibonacci Circle Showing Support and Resistance Zones
In figure 1, we have drawn the baseline from lower point of a weekly trend of EURUSD to the upper point. This line is usually called the baseline of the Fibonacci Circle. Technically, there is no difference between how you can draw Fibonacci Circle compared drawing a regular Fibonacci retracement.
However, the main difference is that unlike the Fibonacci retracement tool, the Circle shows both support and resistance. As you can guess it by now, the upper part of the circles are resistance zones and the lower part of the circles are support zones.
In this example, the 1.618 and 2.618 levels of the Fibonacci Circle not only provided support, but it also did so precisely at a future time as trading sessions moved to the right side of the baseline in the timeframe.
Just like Fibonacci Circles, Fibonacci Fan also can give you a forecast of support and resistance in combination with time. However, Fibonacci Fan involves drawing a series of trend lines instead of circles.
Once you have found an uptrend or a downtrend, simply draw the Fibonacci Fans by connecting the low and high or high or low, respectively. The Fibonacci Fan tool in your charting software will then create a number of trend lines based on the Fibonacci sequence. These trend lines will then likely act as potential support levels during an uptrend and potential resistance levels during a downturn.
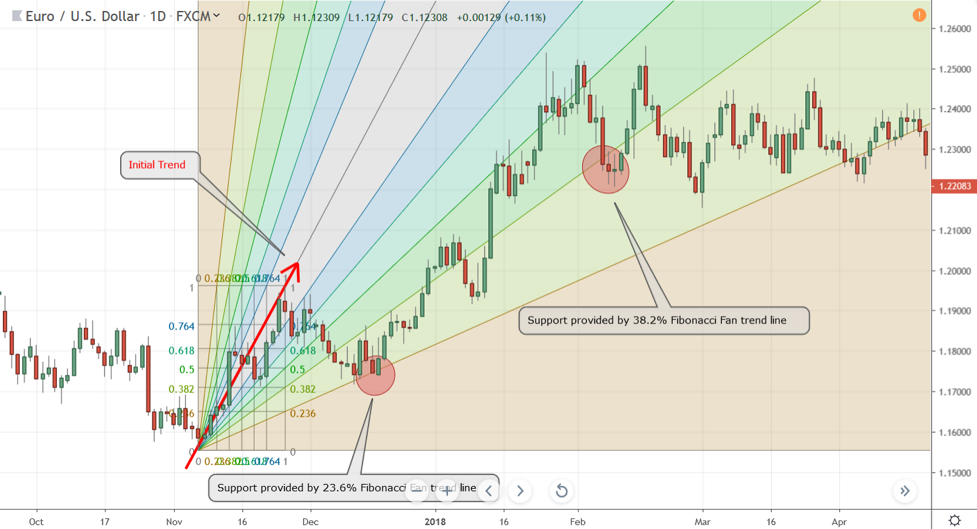
Figure 2: Fibonacci Fan Draws Trend Lines That Can Offer Potential Support During an Uptrend
In figure 2, we have identified an initial trend (the Red arrow line) and drew the Fibonacci Fan by connecting the low and high of this trend. As the EURUSD started a retracement, it soon found a strong support near the 23.6% Fibonacci Fan trend line and soon resumed the uptrend.
Moving forward, the Fibonacci Fan trend lines continued to offer potential support zones in the future. For example, the EURUSD found support near the 38.2% Fibonacci Fan trend line even months after the initial Fan lines were drawn.
During a downturn, these Fibonacci Fan trend lines will act as potential resistance levels.
Most traders often neglect the power of Fibonacci Time Zones because it is one of the most misunderstood and underutilized technical analysis tools out there.
Fibonacci Time Zones are represented by vertical lines on a chart. Unlike the typical application of Fibonacci numbers that forecast potential support and resistance levels, the vertical time zone lines are only used to anticipate potential areas where a swing high, low, or reversal could happen in the future.
You can use Fibonacci Time Zones independently, but it is better to draw historical support and resistance levels on a chart, then draw the vertical Fibonacci Time Zone lines in order to properly identify potential reversal points. Moreover, keep in mind that Fibonacci Time Zones are called “zones” for a reason as you should expect a reversal to happen “near” these zones and not exactly on the vertical lines.
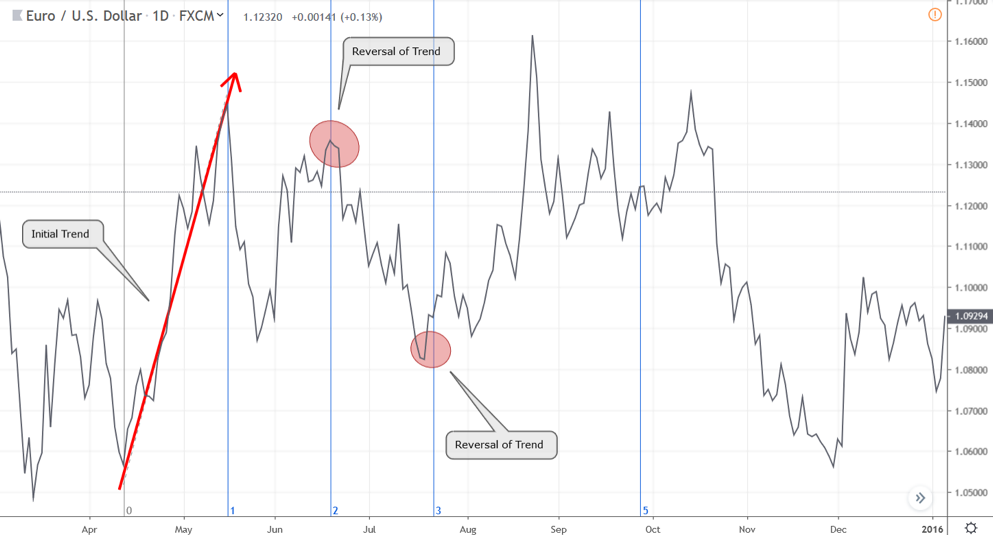
Figure 3: Fibonacci Time Zone Can Predict Potential Reversal Points in the Future
In figure 3, we drew the Fibonacci Time Zone from the low to high on a candlestick chart. However, to better illustrate the potential of using the Fibonacci Time Zones, we changed the chart type of line charts.
As expected, the second wave of the uptrend ended exactly on the 2nd Fibonacci Time Zone vertical line. As we mentioned earlier, these lines act potential reversal zones and you should not expect the price of change course exactly where the lines are formed. Hence, on the 3rd Fibonacci Time Zone, the downtrend reversed and started a new uptrend just ahead of the vertical line.
Fibonacci sequences are one of the mysteries of the universe. While there is no scientific evidence to confirm why these sequences are often found in nature and in the market, empirically speaking, there is a certain correlation to the Fibonacci number derived technical levels and how prices react to these levels.
While learning to use basic Fibonacci retracement levels and integrating it in your trading strategy would already put you far ahead of the rest of the pack, if you truly want to harness the power of Fibonacci numbers, then learning to use Fibonacci Circle, Fans, and Time Zones can provide you with the edge you need to beat the market consistently.
external link:


We have been trading supply and demand strategies for over ten years, and they have stood the test of time remarkably well. Supply and demand is...

3 min read
Choosing the right trading journal is essential for traders wanting to analyze performance, refine strategies, and improve consistency. In this...

3 min read
“95% of all traders fail” is the most commonly used trading related statistic around the internet. But no research paper exists that proves this...