3 min read
Scientist Discovered Why Most Traders Lose Money – 24 Surprising Statistics
“95% of all traders fail” is the most commonly used trading related statistic around the internet. But no research paper exists that proves this...

I just love trading transition points where a Forex pair goes from uptrend to downtrend or from downtrend to uptrend. Those transition points are super hard to trade and very very challenging, but, at the same time, once you understand how to read them, you can take your trading to the next level and understand almost any price chart.
Two very important principles in this trading context are “exhaustion” and “rejection” and those price action concepts can always be found at transition points. In my own trading, and in our pro member area, we talk about transition points all day long because once you can identify transition points, your trading will transform. And regardless of whether you are a trend-following, reversal or range-trader, knowing about them will improve anyone’s trading.
Exhaustion moves after strong trending phases are common and they can be observed quite easily. Exhaustion patterns show a gradual change in trend sentiment and a slow transition.
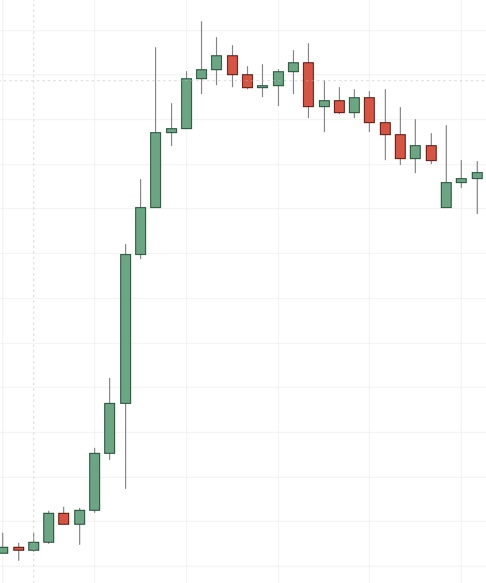
Let’s start with a naked price action chart first. On the left, we see a strong bullish trend with long green candles and momentum. Then suddenly we have one long wick and afterward, the candles become smaller and smaller and finally we start seeing red candles. It’s like a ball you throw in the air: it starts fast and then slowly loses its momentum until it turns at the top. Trends often behave like this too.
The Head and Shoulders is by far my favorite pattern and it shows exhaustion nicely. At the top, we have the head and then once we see the right shoulder, we know that the trend has exhausted because price is not able to push as high and then makes lower highs. What this means is that buyers weren’t as interest anymore and sellers stepped in earlier. When we finally break the neckline, the pattern is confirmed and the market is rolling over.
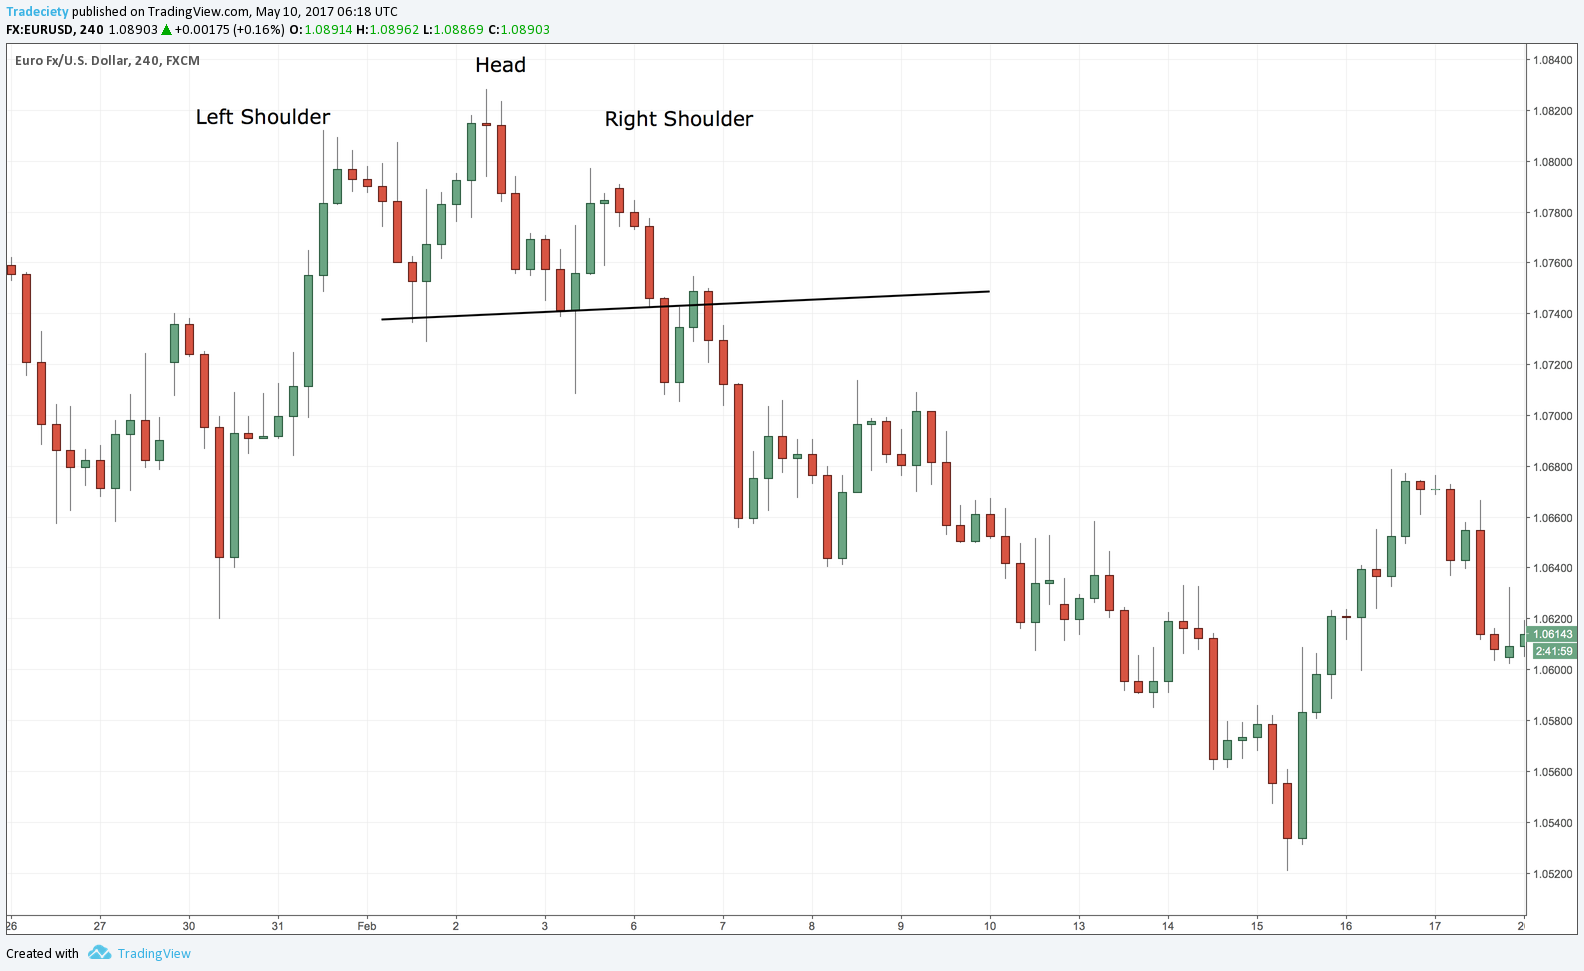
And finally, we can also use the RSI divergence to find exhausting Forex pairs. A divergence means that the trend waves are becoming shorter and less strong which means that the market is exhausting. Although it might still look like a downtrend (lower lows), price action is losing momentum when we compare trend waves and also the size and number of bearish candlesticks.
Rejection patterns, or trap patterns if you want to call them that, are also very common at the end of a trend and they are more volatile and impulsive than the exhausting moves. Whereas the exhaustion shows a gradual shift from one trend direction to the next, the rejection can happen within just one or a few candles.
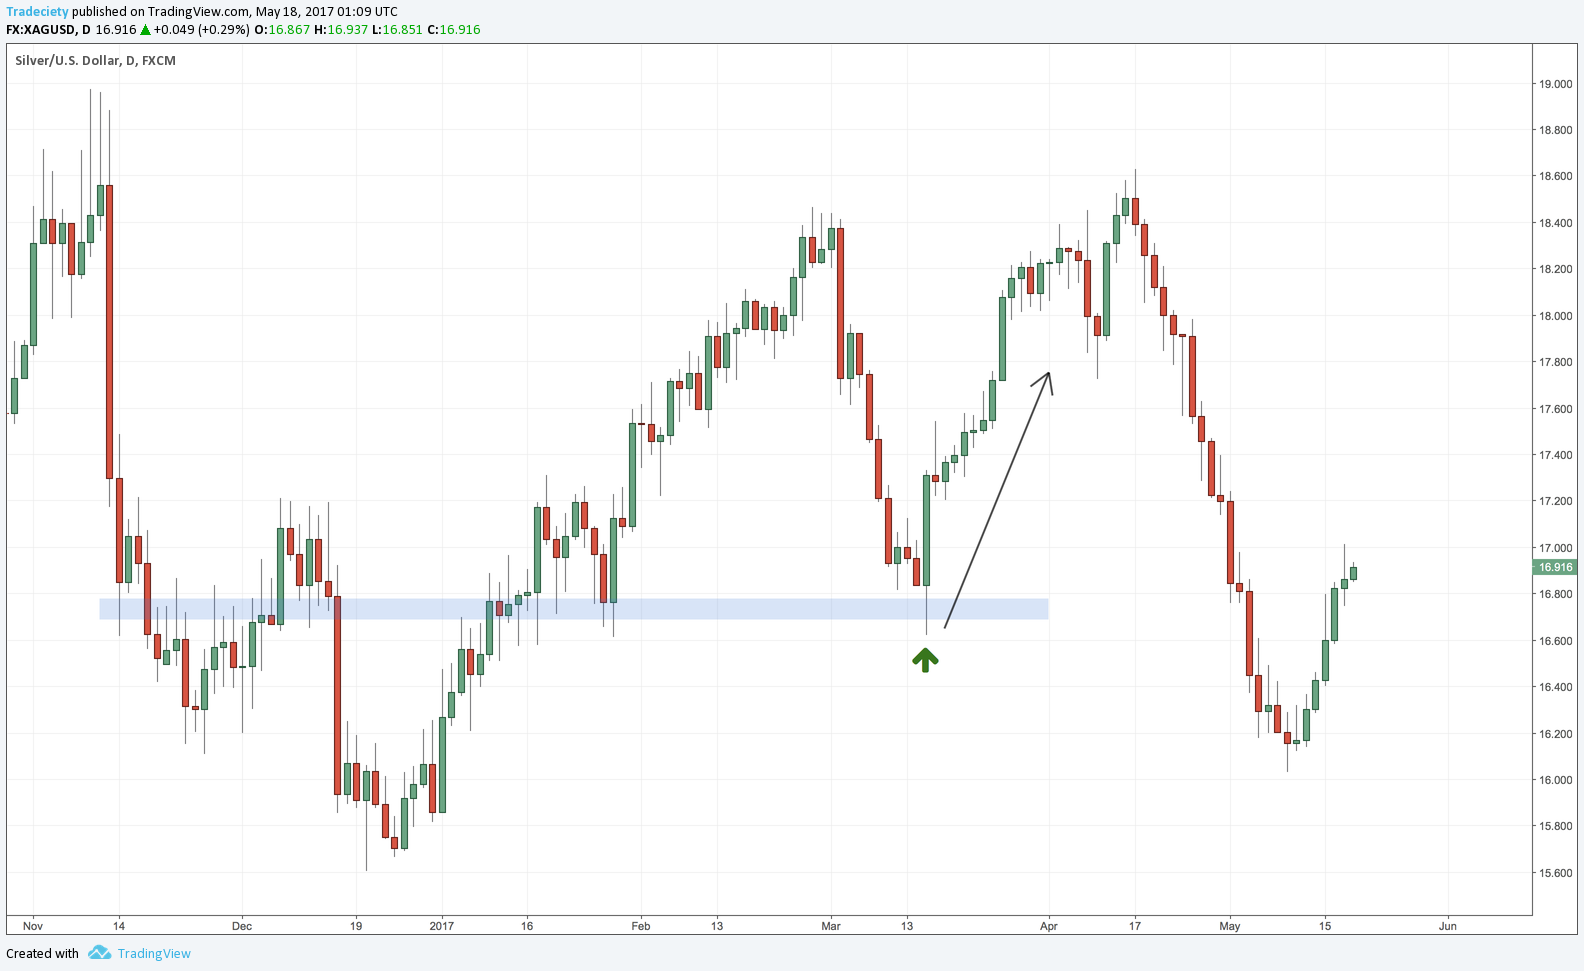
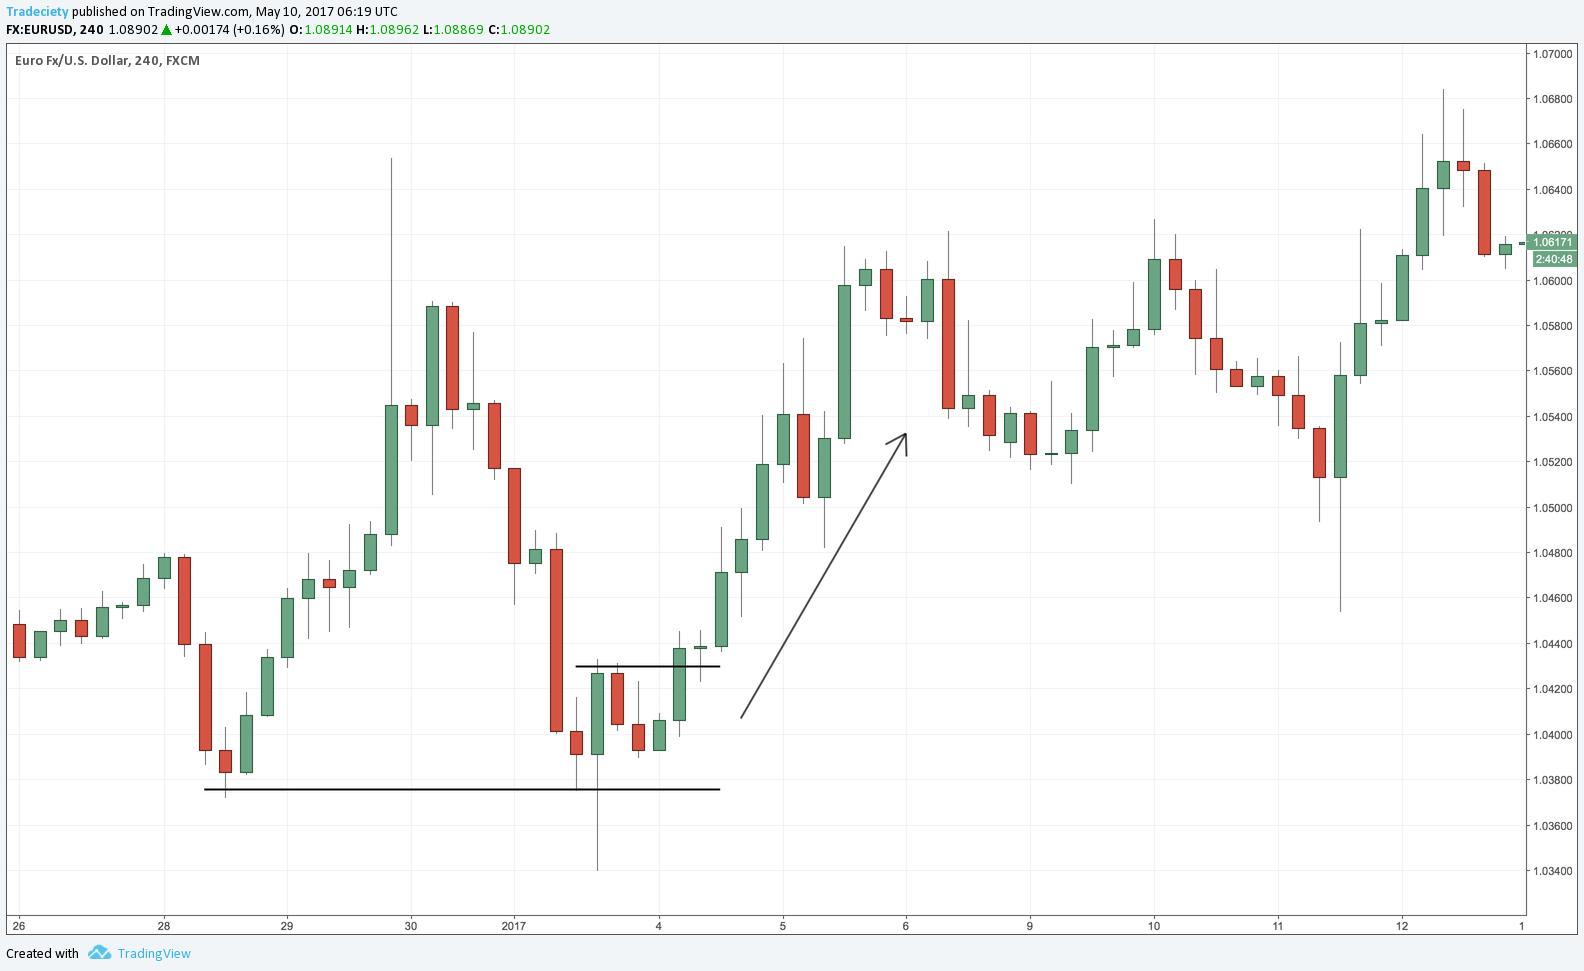
The picture below shows a classic rejection at a support/resistance level. At the time the candle was forming, it probably did look like a breakout and a continuation to the downside, but once the candle was complete, all premature sellers were trapped and price was trading significantly higher. Rejection bars usually have long wicks, penetrating a previous low or high. But engulfing candles can also happen at rejection patterns and are common.
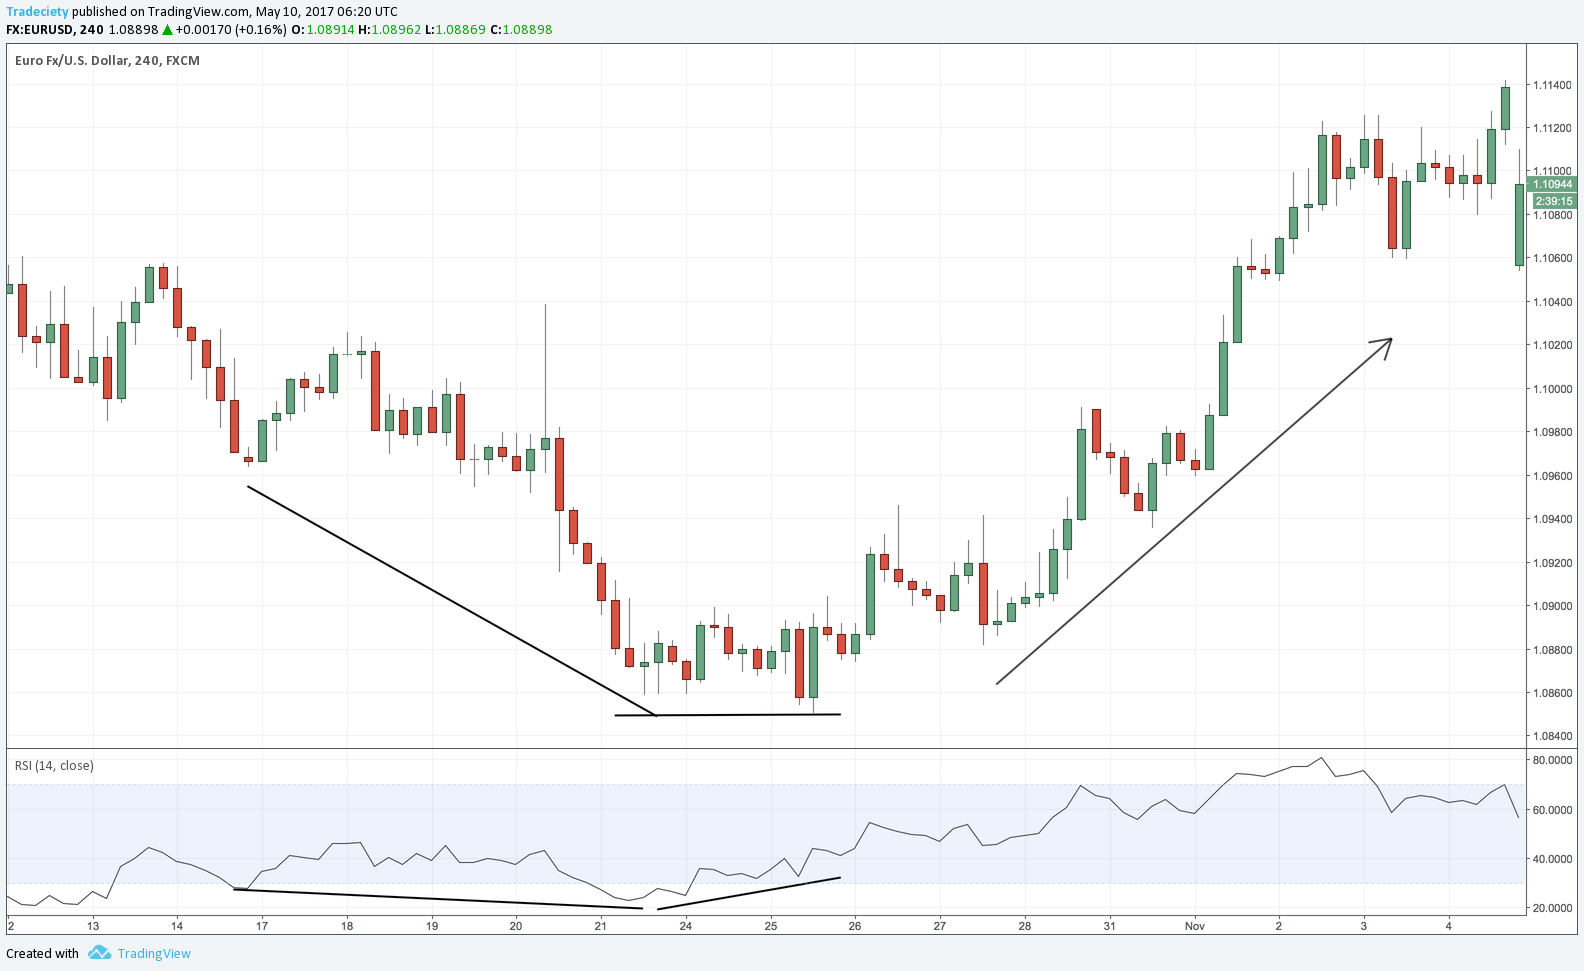
The screenshot below shows a rejection at a double bottom. Price spiked into it and then immediately reversed and moved higher. Many traders use previous swing points as a reference in their trading and violations and rejections, thus, work so well there.
The FOMO trader who has missed the downtrend is eager to get into the downtrend and he believes that a break of a support is a good signal. He enters prematurely and is then caught in a rejection. If this happens to you, make sure to read one of my latest articles where I share a very important trading principles I use in all my trades: avoid FOMO and get into better trades.
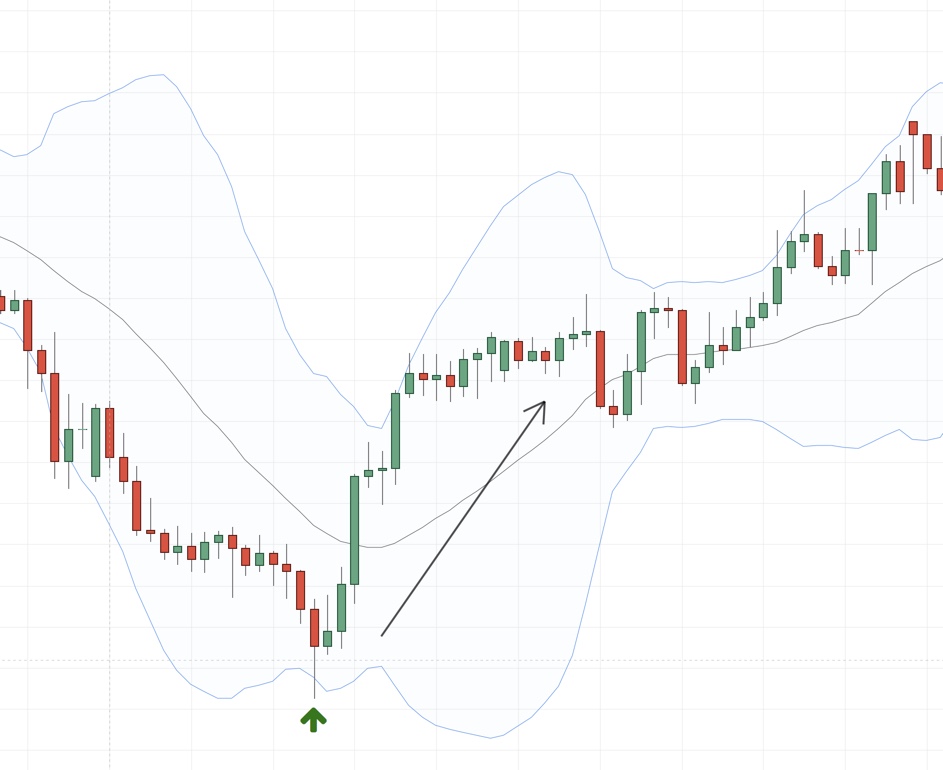
And, lastly, a Bollinger Band ® spike can also be a rejection pattern. Bollinger Bands ® measure trend strength and provide us with information of the likely corridor price is going to move in – a violation of the bands shows an extreme behavior. After a long trend,
In the screenshot below, we can see that after a long trend, price makes a final attempt to move lower but the smart money unloads the shorts and then reverse price to the upside.
Tip: I set the Bollinger Bands to 2.5 std deviations to only catch the absolute extremes and avoid a lot of false signals. Without going too much into detail, a 2.5 Std Dev means that 99% of all price moves will happen between the two bands. A spike is, thus, a rare and important signal.
Rejection and exhaustion patterns are great to know about regardless of what type of trader you are. Trend traders can use this information to ride trends or get out of trades when a reversal is likely; and as a reversal trader, I use it to time new trades and get into new trend early on.
I do not recommend that you trade them by themselves since there is much more to it and it’s very easy to screw up and then become a bottom picker or top caller.


external link:


3 min read
“95% of all traders fail” is the most commonly used trading related statistic around the internet. But no research paper exists that proves this...

3 min read
Trendlines can be great trading tools if used correctly and in this post, I am going to share three powerful trendline strategies with you.

3 min read
Choosing the right trading journal is essential for traders wanting to analyze performance, refine strategies, and improve consistency. In this...