Supply and Demand Trading in 2026
We have been trading supply and demand strategies for over ten years, and they have stood the test of time remarkably well. Supply and demand is...
3 min read
Rolf
Jul 4, 2018 8:00:00 PM

The Donchian channel is a trend-following indicator which has been heavily used by the infamous Turtle traders. The Donchian channel measures the high and the low of a previously defined range – typically of the past 20 days. The screenshot below shows the channel on Apple with a 20-day range where it marks the highs and lows of a 20 day period.
Typically, a trader would look for a well-defined range and then wait for the price to break out to either one side for a trade entry trigger. But, there is more to the Donchian channels and we will discuss how to increase the quality of the signals and how to structure a trend-following position sizing strategy.
Step 1 – finding high momentum breakouts
Of course, not all breakouts are going to be successful and there is no way to generate a 100% accurate system, but there are ways to increase the quality of entry signals for the Donchian channel. The first screenshot below shows the AAPL chart and the 20-day Donchian channel. False breakouts have been marked with a red (x) and successful breakouts with a green tick.
At first glance, it’s apparent that a significant amount of false breakouts exist when momentum is not supporting the move. In the first step, we added the RSI strength and momentum indicator to filter out low-momentum breakouts which are often false breakouts. In the next steps, we show how other tools and techniques can help improve the accuracy of the system.
Tip: If you are a reversal trader or fade breakouts, combining the Donchian channel and the RSI can be a great asset in your trading arsenal. A lack of momentum or divergences can signal false breakouts if followed by a failed break of the range.
Step 2 – high entry accuracy with a trend filter
In the next step, we add a long-term moving average; in the scenario below we added the 100-period moving average which is an excellent filter tool that helps you separate between long and short scenarios. Whenever price is above the 100-period moving average, you would only look for breakouts to the upside; and when the price is below the 100-period moving average, you only look for short breakouts.
Using moving averages as a directional filter is used by many professionals and also Marty Schwartz, who was featured in the Market Wizards series, mentions the moving average filter as one of his favorite tools.
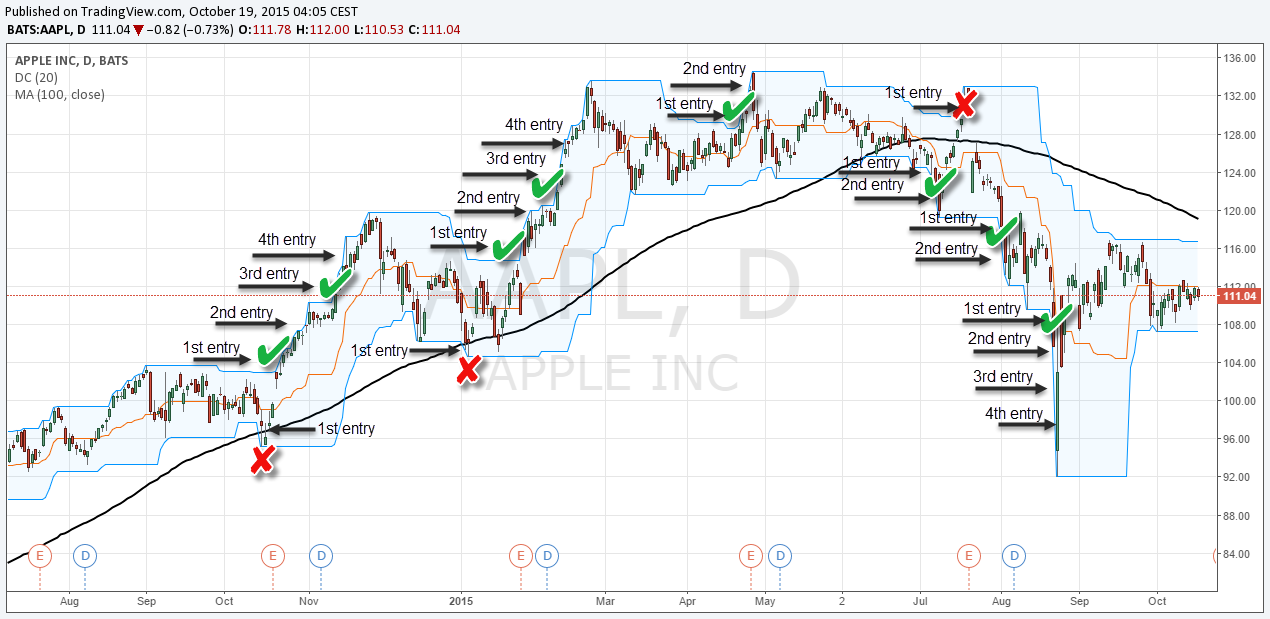
The screenshot below now also includes the 100-period moving average. The amount of signals has been reduced while, at the same time, the quality of the signals has been improved significantly. There are only 3 false signals left and in the next step, we will show how to minimize the impacts of losses by using money management techniques.
Those are just two examples of how adding trading tools and indicators can help you improve the quality of your trade entries. The approach highlights the importance of combining trading tools and concepts that support your trading style and objective in order to filter out low-probability entries.
Now that you have a better understanding about how to improve the quality of trade signals, we can take a look at position sizing. Especially for breakout and trend-following traders, there is a specific position sizing strategy that can help you improve the quality of your system even further.
“Scaling in” refers to the position sizing strategy of entering a fractional amount of your intended position size first and as price moves in your favor, you add to the winning position, and ideally move your stop loss to protect your profits so far.
There are two major benefits of scaling in:
The screenshot below shows the AAPL chart again and it illustrates how the impacts of the false signals could have been minimized by applying the scaling in technique. Whereas the successful breakouts often saw long moves and the trader would have been able to scale in completely, the unsuccessful breakout failed after the first entry and the loss would have been only a small amount.
While this article is not only meant to show you how to use the Donchian channel indicator, it has another message as well: you have to be conscious of your trading style and build your approach around your goals. As a breakout and trend-following trader, look for momentum and sentiment tools that help you read what is going on and filter out trades with a lower probability. On the other hand, if you fade false-breakouts, look for tools that help you identify low momentum price movements into high-impact price areas.
And take it one step further and look beyond generating entry signals; structure your position sizing and money management around your trading objectives. For every trading style, there are techniques and principles that can improve the quality and robustness of the system; think outside the box and start building your own, powerful method and stop following generic advice.

We have been trading supply and demand strategies for over ten years, and they have stood the test of time remarkably well. Supply and demand is...

3 min read
Choosing the right trading journal is essential for traders wanting to analyze performance, refine strategies, and improve consistency. In this...

3 min read
“95% of all traders fail” is the most commonly used trading related statistic around the internet. But no research paper exists that proves this...