
Supply and Demand Trading in 2026
We have been trading supply and demand strategies for over ten years, and they have stood the test of time remarkably well. Supply and demand is...

Price does not just move in one straight line and it’s important to understand consolidations, sideways phases and other low momentum periods.
Pinbars and Dojis are very popular among traders but only very few understand them correctly. And many traders treat those patterns completely wrong and then wonder why price action trading doesn’t work for them.
In this article, I want to help you get a better understanding of how to read and trade those candlestick formations and become better at understanding Forex price action.
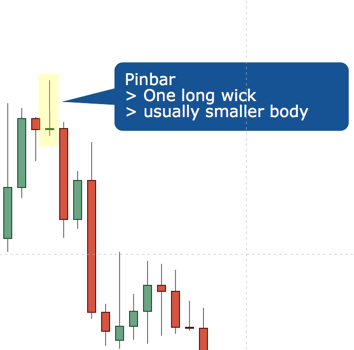
Pinbars can be very obvious and easy to spot which is why they are so popular among traders. A pinbar is in its simplest form a candlestick with one large wick and a smaller body at the opposite end of the candle.
The pinbar usually shows a rejection but it’s not that simple and many traders get this wrong…
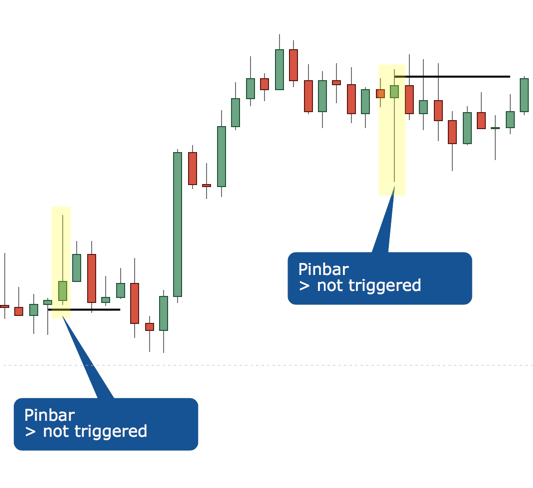
…most pinbars actually don’t get triggered and those untriggered pinbars are what causes losses in trading. The amateur traders jump on every signal that they can find and are usually always too early in the market. Just because you can spot a pinbar, it doesn’t mean that it’s a reason to get into a trade. Trading doesn’t have to be complicated but blindly just trading pinbars certainly won’t cut it.
A pinbar is triggered on the next candle, IF price can follow through and make a new low or high, depending on the pinbar. Multi candle patterns carry more weight than single candle patterns and it’s not advisable to trade individual candlesticks just by themselves.
Multi candle patterns carry more weight than single candle patterns and it’s not advisable to trade individual candlesticks just by themselves. Waiting for the trigger of a pinbar turns it into a multi candlestick pattern too. If you can then add other confluence and signals around it, then you come closer to creating a robust trading system.
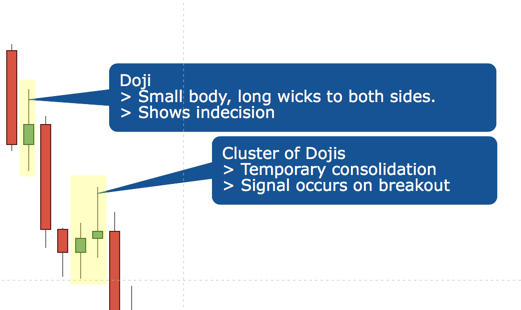
Dojis can be very tricky candlesticks because they challenge a trader’s emotions. Traders always want to see price move to their target fast and a Doji shows a temporary market pause and a consolidation.
Many traders falsely believe that a Doji is a reversal signal but this is not the case. A Doji is simply a short pause where traders and investors are planing the next move.
Price moves in waves and Dojis or low momentum consolidations are normal and with experience you’ll start to get a feel for the rhythm of the markets.
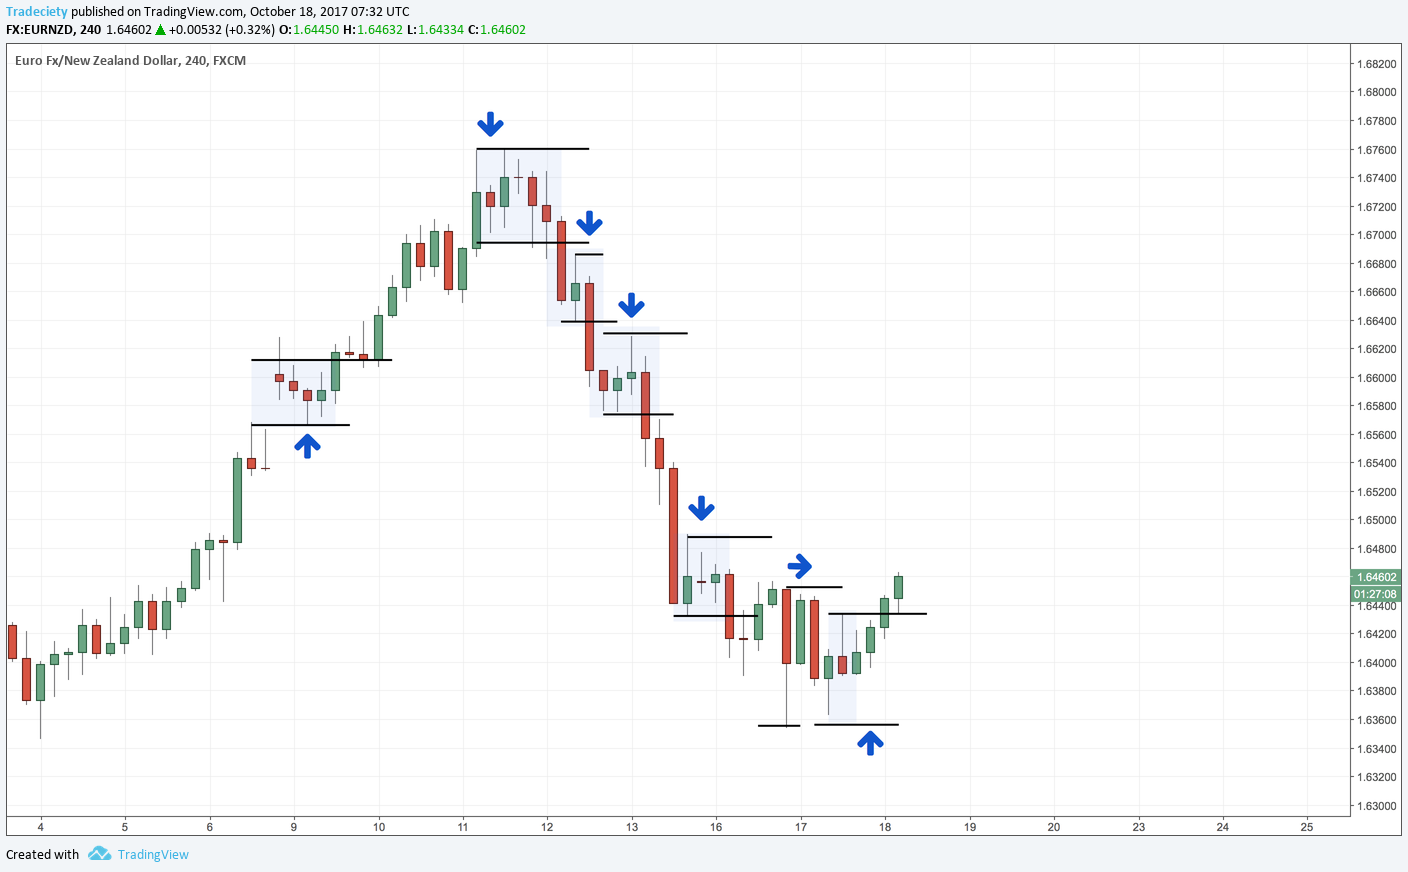
Similar to the Pinbar, a Doji only gets triggered on the next candle when price breaks out with momentum. You can see it in the screenshot below and the Dojis were triggered when price made a new move lower and confirmed a lower low.
So, don’t get scared out of your trades too early, understand that Dojis, Pinbars and consolidations are not signals yet and always wait for the confirmation momentum breakout that triggers such a pattern.
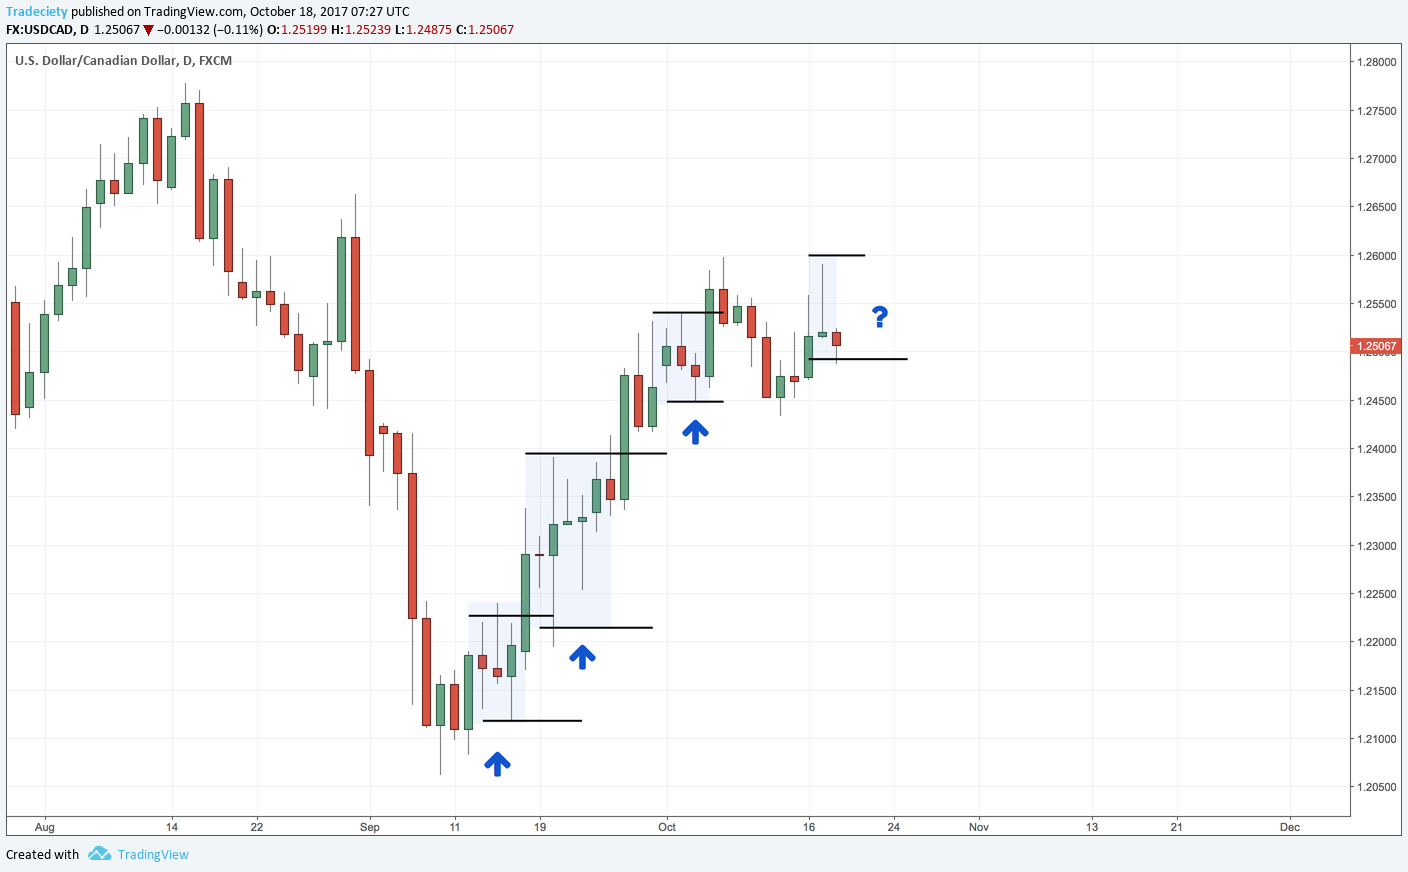
The screenshot below shows a typical chart scenario and although it looks obvious that the uptrend went well, only very few traders would have made money here. All the small candles, long wicks and consolidations would have scared 99% of all traders out of a potentially profitable long trade.
At the same time, you can see that we never had a strong bearish candle against the uptrend. All consolidations or Dojis were triggered to the upside and never to the downside.
Where the chart is now we can see that it’s undecided and now a trader has to wait for a break to either the upside or the downside. If you’re long, you’d do well to stay in the trade until opposite signals are given. As a trader interested in shorts, you need to wait for a break of support.
As a trader, one of the most important skills is doing nothing. You need to learn to sit on your hands more often. Don’t overreact to every little move on your charts.
Below we have a different scenario on a recent trade of mine. First we see that during the downtrend, the consolidations were only triggered to the downisde.
At the bottom, we had a good long signal based on my strategy (learn my trading strategy here) and price also triggered the consolidation to the upside. I made several hundred pips on this one.
Looking at price action this way will transform your thinking and it can also help you become more relaxed about the moves on your price charts. Try it and I promise that you’ll see the benefits.
external link:


We have been trading supply and demand strategies for over ten years, and they have stood the test of time remarkably well. Supply and demand is...

3 min read
Choosing the right trading journal is essential for traders wanting to analyze performance, refine strategies, and improve consistency. In this...

3 min read
“95% of all traders fail” is the most commonly used trading related statistic around the internet. But no research paper exists that proves this...