3 min read
Scientist Discovered Why Most Traders Lose Money – 24 Surprising Statistics
“95% of all traders fail” is the most commonly used trading related statistic around the internet. But no research paper exists that proves this...
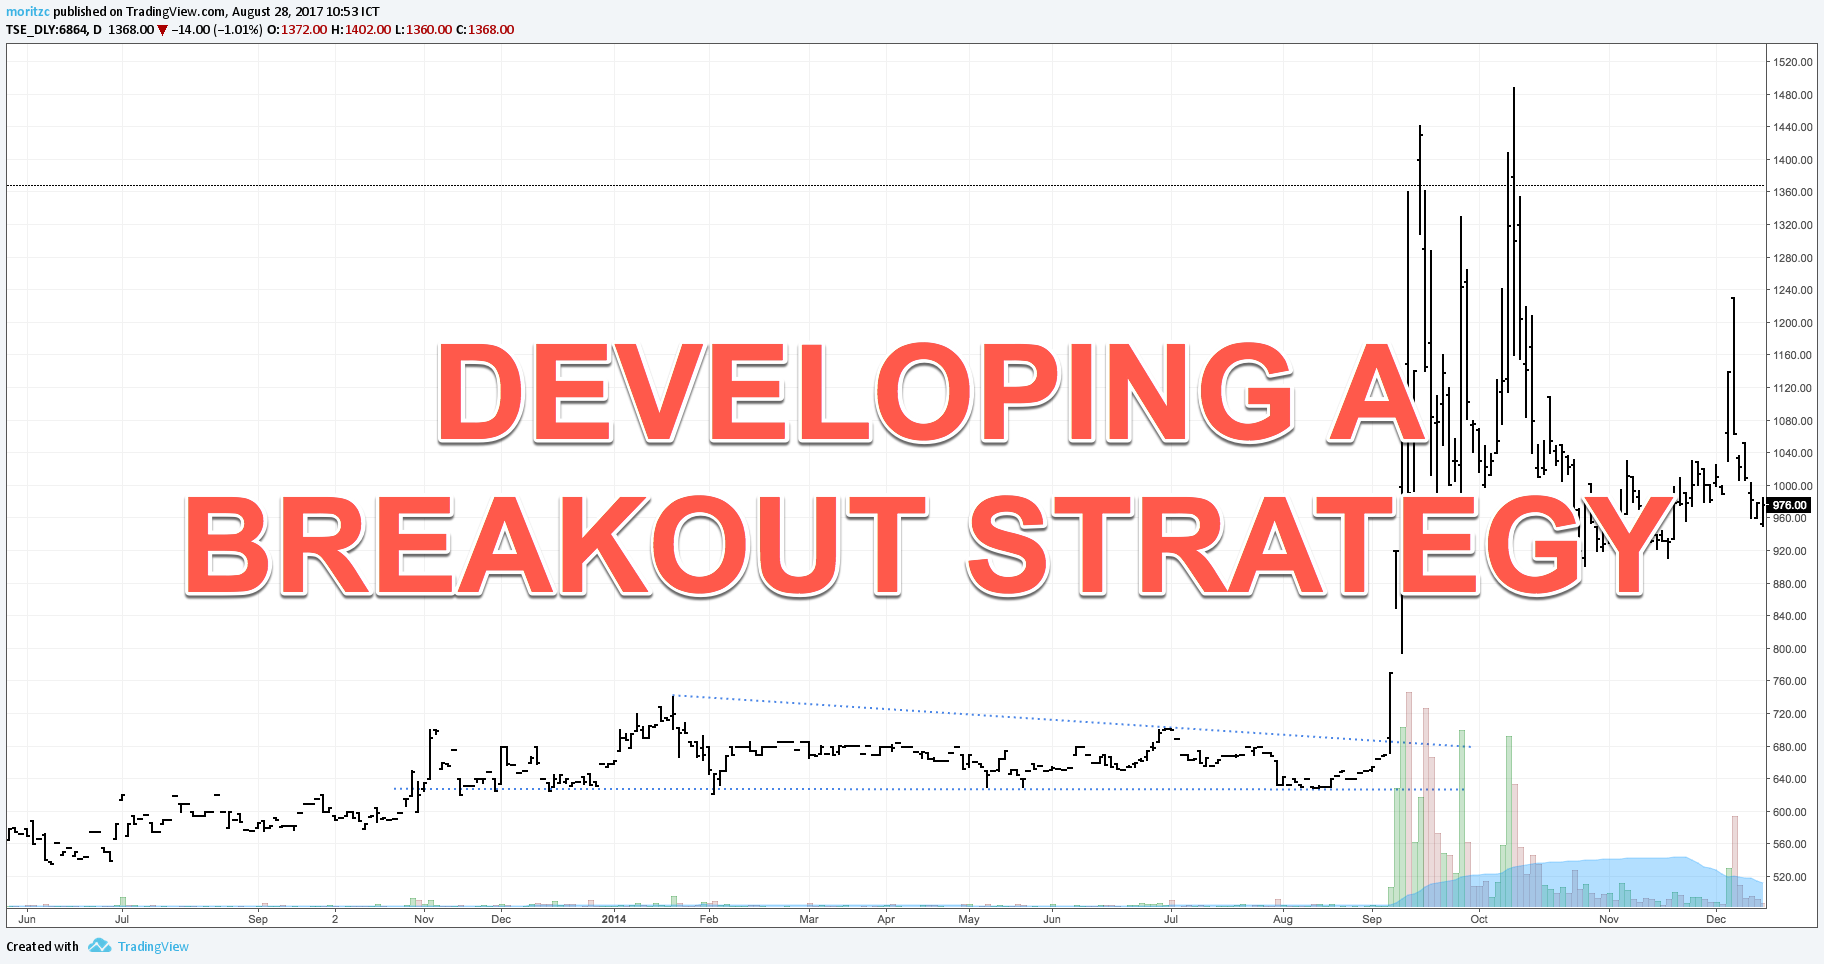
There are two advantages of breakout trading. Firstly, you can clearly define your stop losses and know when a trade idea becomes invalid (below/above the breakout level). Secondly, if the trades work out, a lot of them bomb directly into your target – instant gratification!
There is also a disadvantage to breakout trading – a fairly low win rate, which is, however, made up for with quite attractive risk:reward ratios. Now if you decide that this is the right trading strategy for your psychology, we can proceed to the next steps.
Once you made up your mind, write down your trade plan. Set up a checklist. Then set up your trading journal, think about what else you want to track besides your checklist items – fundamentals, market conditions…? This will help you to further narrow down profitable setup constellations and you might just find incredibly useful filters for your setups.
Then start back testing. I backtest 25 Stocks per day by going through the last 10 years (on Daily & Weekly charts) of data. So I back test 250 years worth of data each day, basically. It takes me about an hour and is a great exercise. Check the video below for how I manually backtest.
Once you have back tested 500 stocks, which will take roughly a month, and have positive results and very likely made some adjustments to your trade plan due to the findings from your back test journal, you can start forward testing. While doing back tests and forward tests, always try out multiple Stop Loss and/or Take Profit approaches simultaneously in order to find the best performing trade management technique for you.You can do this with Edgewonk, for example.
Now for the forward test, we are approaching a new problem, however – stock selection! During the back test, we simply randomly pick a stock and go with it. But in day-to-day trading, we have 100’s of thousands of stocks to choose from. We need a filter, preferably one that is already built into a free platform like TradingView or Finviz. Alternatively, as a paid option, use MetaStock – with it, you can program filters yourself and basically scan the whole universe of stocks for whatever you want.
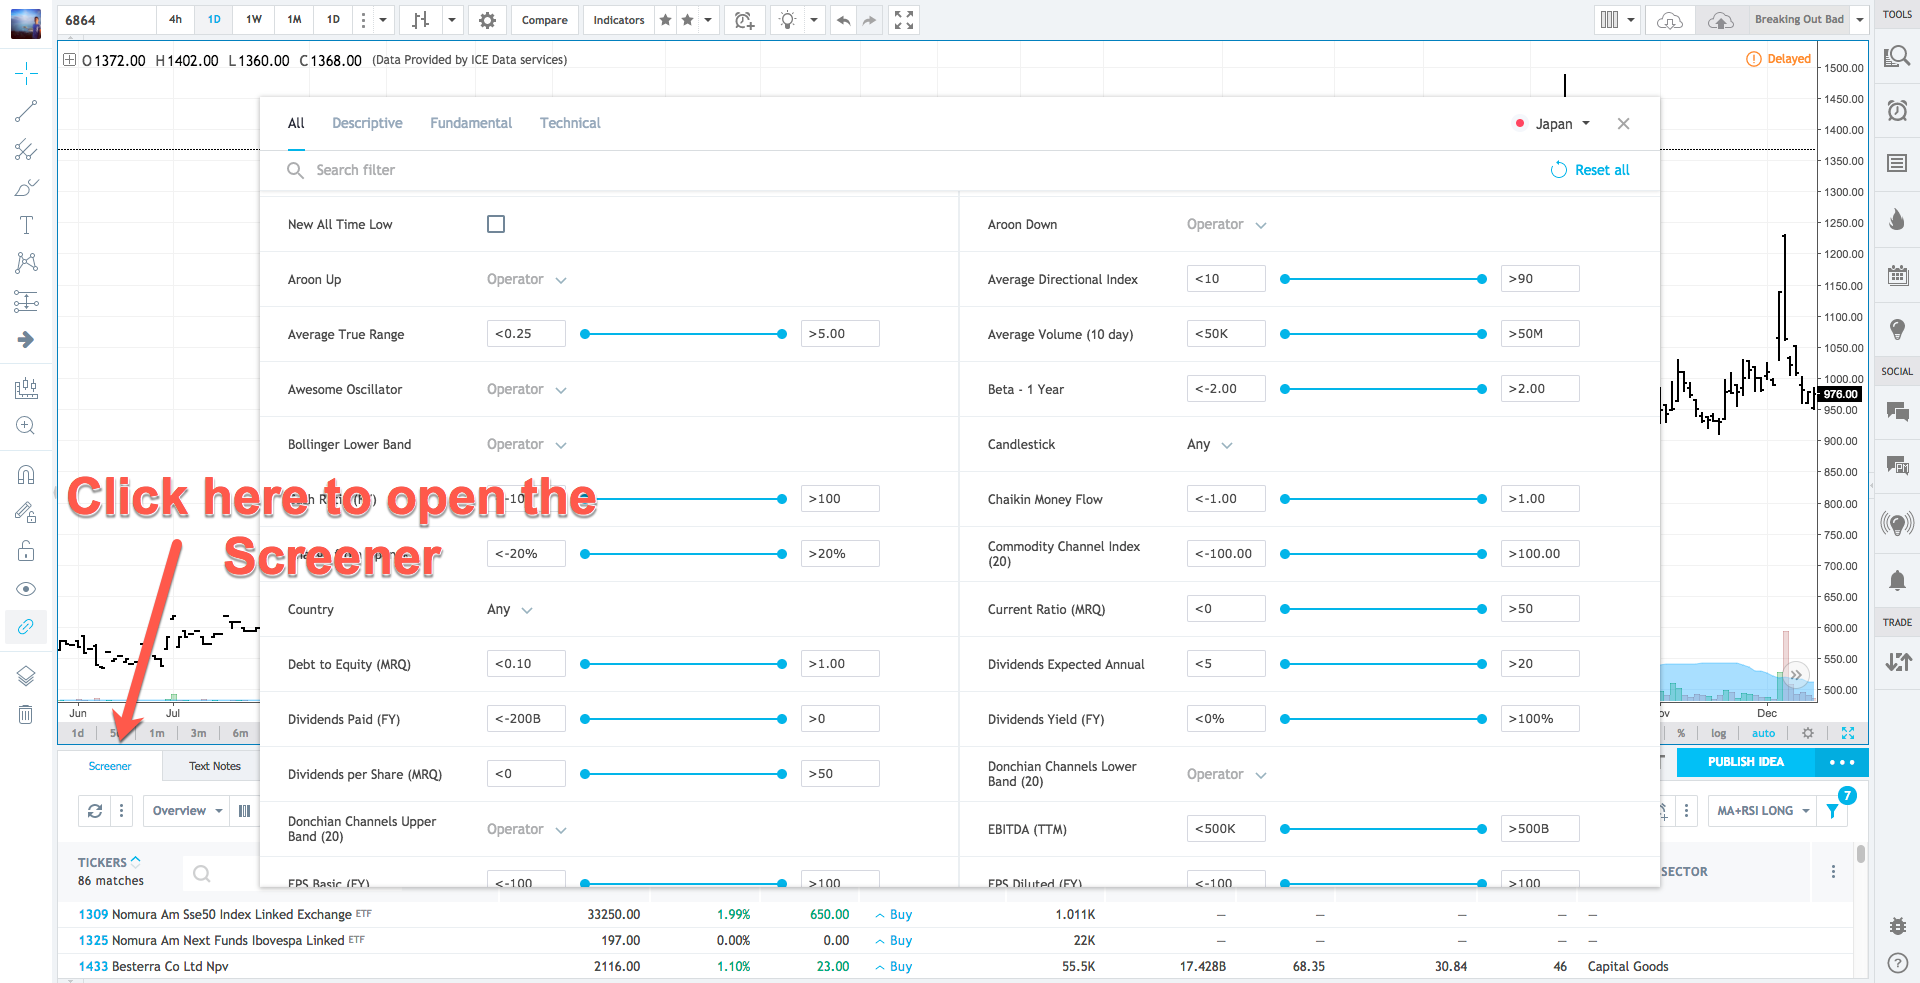
The screener on TradingView.com is a great alternative to paid Screeners
Logically, there are two ways to scan for stock breakouts – one is to look for stocks that are about to break out and then put them on a watchlist, the other one is to scan for stocks that have already broken out and then see whether they fit your conditions.
To scan for stocks that are about to break out, we obviously need to look for congestions – we can do this by scanning for low volume, moving averages converging, Bollinger Bands width, anything that narrows down the stock universe to a small enough list so we can manually go through the individual items.
To scan for stocks that have already broken out, we need to look for the opposite – price in an extreme state. Look for top gainers or losers of the day, extreme indicator readings (oscillators!), unusually high volume..whatever is on your breakout checklist.
I follow the second approach because the first approach IMHO is double the work with no extra benefit for me. Of course, to do so, my strategy needs to have breakout criteria included. If your strategy only looks for classic chart patterns, for example, but you don’t care in what manner price breaks out of them, you will have to filter for low volatility and keep a watch list.
I simply filter for items on my checklist. This could be, for example, a close above the RSI(14) level of 70 and a close above the upper Bollinger Band for a breakout to the upside alongside unusual volume (3 times the 50-day volume average or higher). This narrows down the US stock market to around 100 items per day – doable!
You can easily set up screener criteria like these with the platforms I already mentioned – for free. Then, once you have the list narrowed down, you go through the items on that list one by one and look for the breakouts that meet all your trade criteria, i.e. there has to be a level on the chart that was clearly broken by a threshold of x% – this is something you cannot scan for with the screener, that’s the manual part of picking stocks.
Then, once you chose your setups for the day (or none, absolutely ok), calculate your risk, set up your orders, and tada! Strategy completed. Now you “simply” rinse and repeat and make adjustments along the way whenever needed BUT ONLY with the help and evidence of the backbone of all your trading operations – your trading journal.
Below is an example of a trade that could have easily been found with a simple screener setup.
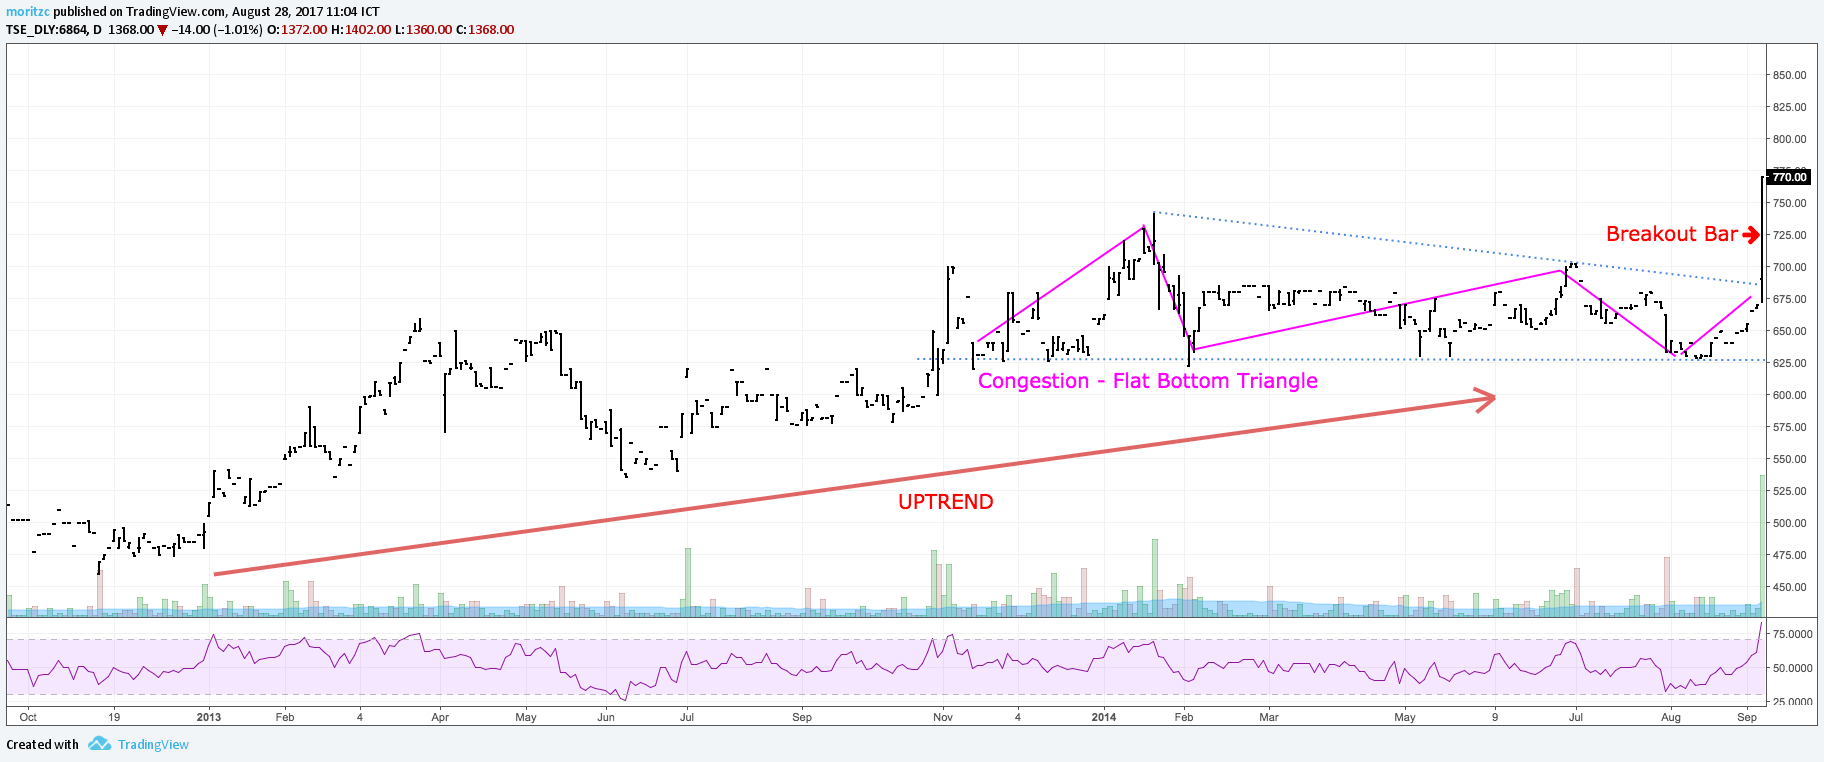
Here, we have a classic chart pattern – a flat bottom triangle, or down sloping triangle, which broke to the top after a 10-month congestion. This stock showed up in a scan filtering for two items – the RSI close above 70 and high relative volume. Then we simply check, whether the chart fits our other criteria for entering a trade as well and we are good to go.
Of course, the more items you add to your screener, the more specialized it will be and the fewer results you will get. And even then, after narrowing it down to only 100 stocks out of thousands, still, there will only be 1-2 good trades and often there won’t even be a good trade. You will have to get used to that.
Some traders run several highly specialized screens and then only look at trading the stocks that show up in all those screens, for example. It is up to you really, and of course you don’t have to stick to technical scanning criteria only – you can also go for fundamental data (stuff on balance sheets, earnings), although these will be much harder to back test and you will have to do a lengthy forward test in order to assess the efficiency and profitability of these screens.
I backtest technicals only and then add fundamental filters in the forward test to find useful correlations between my setups and the economic factors underlying the breakout I am trading at the time. Again, the possibilities are endless.


external link:


3 min read
“95% of all traders fail” is the most commonly used trading related statistic around the internet. But no research paper exists that proves this...

3 min read
Trendlines can be great trading tools if used correctly and in this post, I am going to share three powerful trendline strategies with you.

3 min read
Choosing the right trading journal is essential for traders wanting to analyze performance, refine strategies, and improve consistency. In this...