3 min read
Scientist Discovered Why Most Traders Lose Money – 24 Surprising Statistics
“95% of all traders fail” is the most commonly used trading related statistic around the internet. But no research paper exists that proves this...
I’ve been into algorithmic trading for around 6 months now, following two separate approaches – one is bruteforcing strategies, which works reasonably well but takes a lot of resources ($), servers and electricity and so on. However, it has given me some really neat, tradable strategies. The other approach is developing strategies manually, which is a lot of fun and appeals to my creative side. Today I just quickly want to show you one of the simplest strategies I have ever created (2 lines of code). It is a biased strategy applied to the E-Mini S&P500 Future (ES) contract traded at the CME, on the daily charts, and has (without any position sizing & compounding applied) about the same performance as if you had simply bought and held the S&P over the last 20 years, but without the massive drawdowns that happened, for example, in 2008.
What would a biased strategy on the ES look like, then? Well, we trade long only. At first, I wanted to see what the performance would be if we bought whenever a daily bar closed above the BollingerBand (Length 20, StdDev 2), and reversed our position whenever a daily bar closed below the BollingerBand (Length20, StdDev -2). The performance looked like this…
If Close > BollingerBand(Close, 20, 2) Then Buy Next Bar At Market;
If Close < BollingerBand(Close, 20, -2) Then SellShort Next Bar At Market;
Well, nothing too fancy, as was to be expected. I like to start with simple ideas and then take it from there. Usually, I will develop and refine a strategy on a small chunk of data, and when it works on that chunk, I will forward-test it on the whole data I have to emulate live-trading. However, with bias strategies, it’s different – as we are trying to exploit a certain characteristic of the market, we need to see during the development process already, whether that characteristic exists and how stable it is. For example, a long-only strategy on the ES tested during 2008 would either give us 0 trades due to filters or have a horrible performance.
While that might be true for the development of other types of strategies, as well, and we could, due to bad luck, develop on exactly those 1-2 years of data where our idea does not work, it is a risk we have to be willing to take and a good trade-off in order to avoid the dangers of curve-fitting, over-optimization, and immediate strategy death during live trading. Generally, the higher the timeframe you use, the more data you want to use for both development and testing, as well, to get a good sample size.
Anyway. Let’s get back to our bias. Just a quick check to see whether the strategy does what it’s supposed to do.

Certainly seems like it. It buys when the price closes above the BB and reverses when it closes below the BB. Interestingly enough, this strategy made a lot of money during 2008 and the 2000 crash, but gave it all back during the other years. So, as especially the US Stock Indices always have to go up in the long term (or else capitalism goes bust and then we don’t have to worry about trading anymore), let’s introduce our bias.
We go long when the price closes above the BB, and we exit the trade when it closes back inside the BB – this should allow us to capture the big upside moves, while we patiently wait out bear markets. Here is the performance.
If Close > BollingerBand(Close, 20, 2) Then Buy Next Bar At Market;
If Close < BollingerBand(Close, 20, 2) Then Sell Next Bar At Market;
Still nothing to rave about, but at least we are in the positive for now and caught a nice run at the end during Trump’s election. However, it seems that the S&P500 is a steady riser, but doesn’t do huge, volatile moves, at least not to the upside, so our breakout strategy doesn’t make much sense. What would make more sense for an instrument that climbs slowly but steadily in waves? I am sure you guessed it right, entering on pullbacks and exiting when the trend becomes overextended!
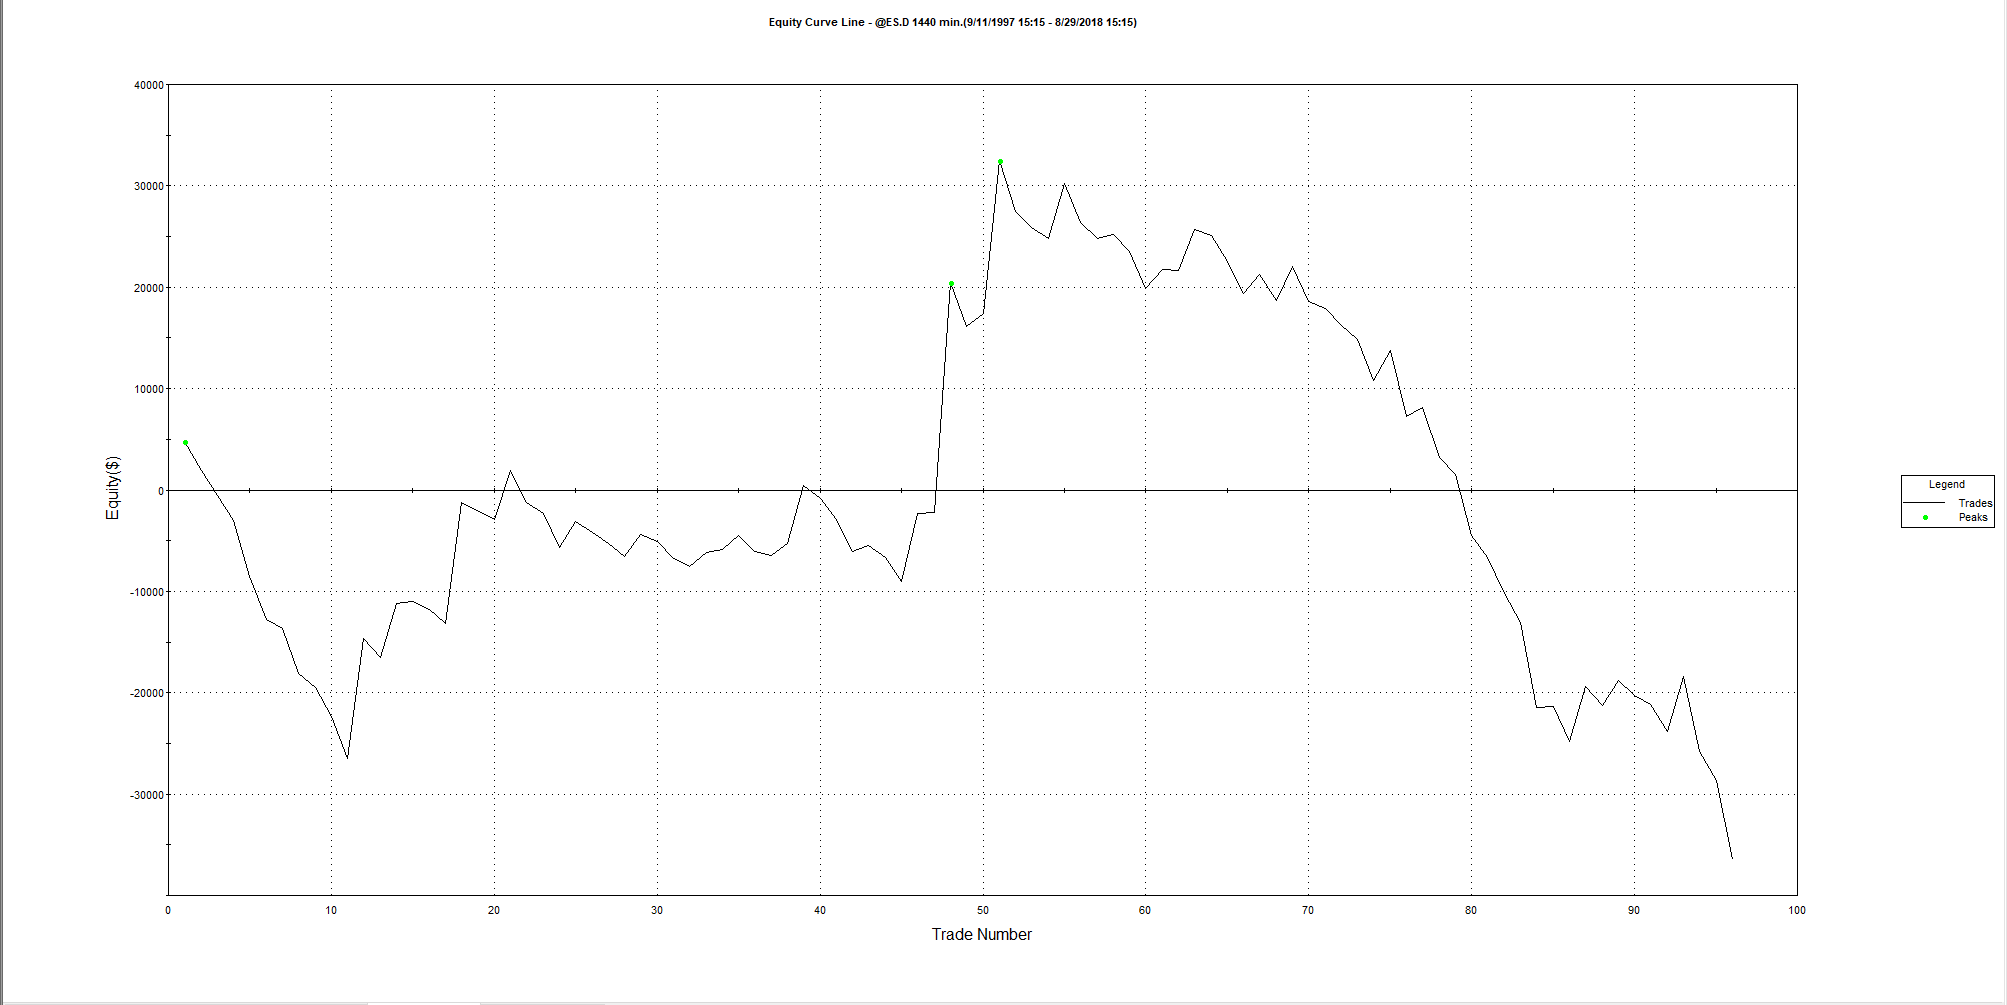
In other words, we buy when price closes below the BB, and exit when it closes above the BB. Here’s how that works.

If Close < BollingerBand(Close, 20, -2) Then Buy Next Bar At Market;
If Close > BollingerBand(Close, 20, 2) Then Sell Next Bar At Market;
We are making much more money already, and right now we are on a ridiculous 20-trade winning streak which has been going on since 2009. However, the 2008 and the 2000 crashes really killed our performance. Look at that.
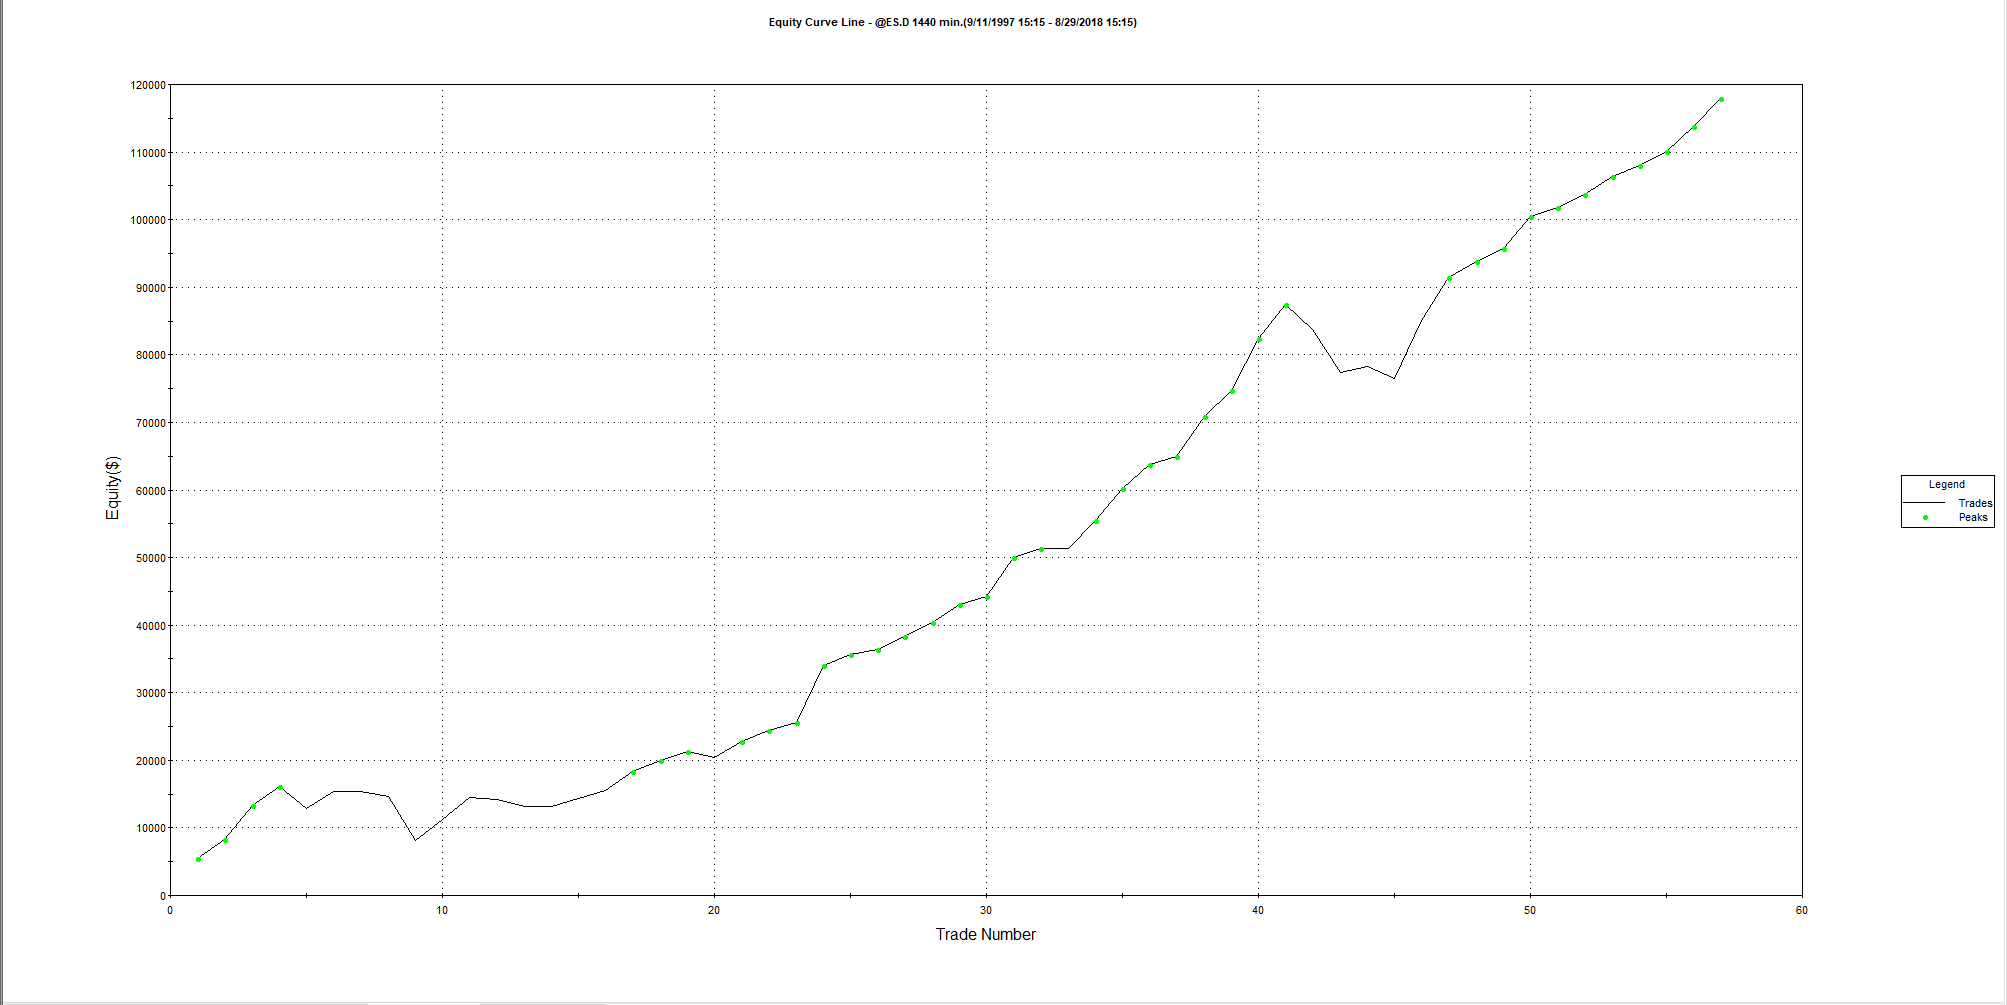
As we are trading a long-only strategy, there is a simple solution to filter out bear markets. We only trade when the price is in a long-term uptrend. Our favorite indicator enters the stage, the moving average. We will go with the 200-day simple moving average for starters. Here it goes.
If Close < BollingerBand(Close, 20, -2) And Close > Average(Close, 200) Then Buy Next Bar At Market;
If Close > BollingerBand(Close, 20, 2) Then Sell Next Bar At Market;
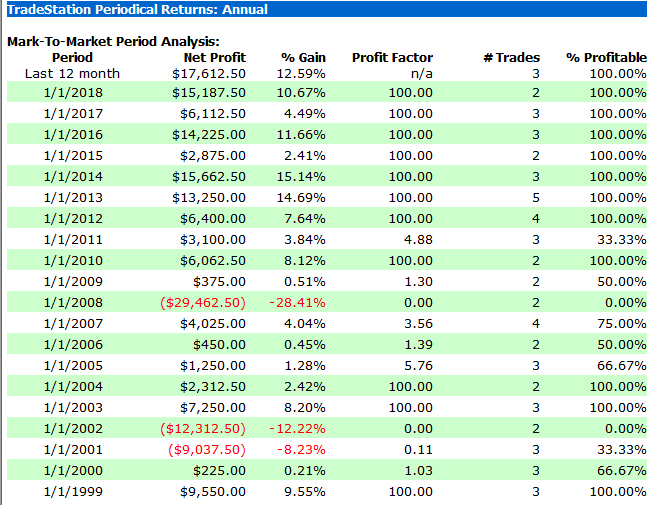
Whoop-de-doo! Ridiculous winrate, but not a lot of trades. 2008 simply disappeared from the performance report, zero trades. 2001 and 2002 gave us small losses, manageable.
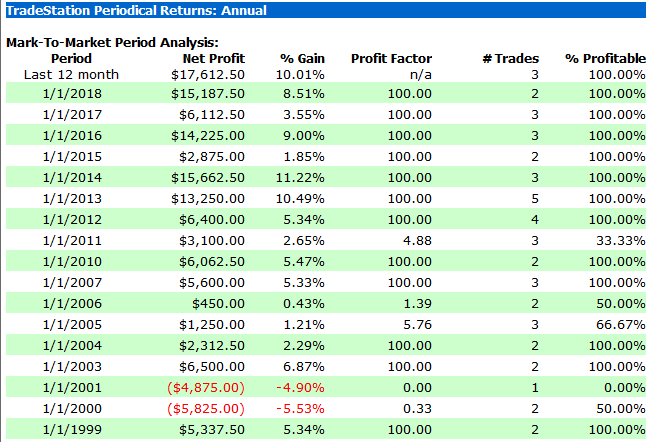
Not bad. The performance is acceptable, we don’t have to worry about commissions as we don’t trade a lot and the average trade profit is quite high ($2,400) as is to be expected on the daily charts, however, we trade only 2-5 times per year. In a portfolio of many strategies, this is acceptable. If this is your only strategy, well…have fun waiting. So I tried to go to the lower timeframes, for example, the 4-hour, 2-hour, 1-hour etc., using Daily as the secondary timeframe (only trade when the daily SMA200 is below price), but all it did was increase our number of trades while lowering our net profit and our average profit per trade. Not worth it for now, but could be pursued further and be combined with other ideas.
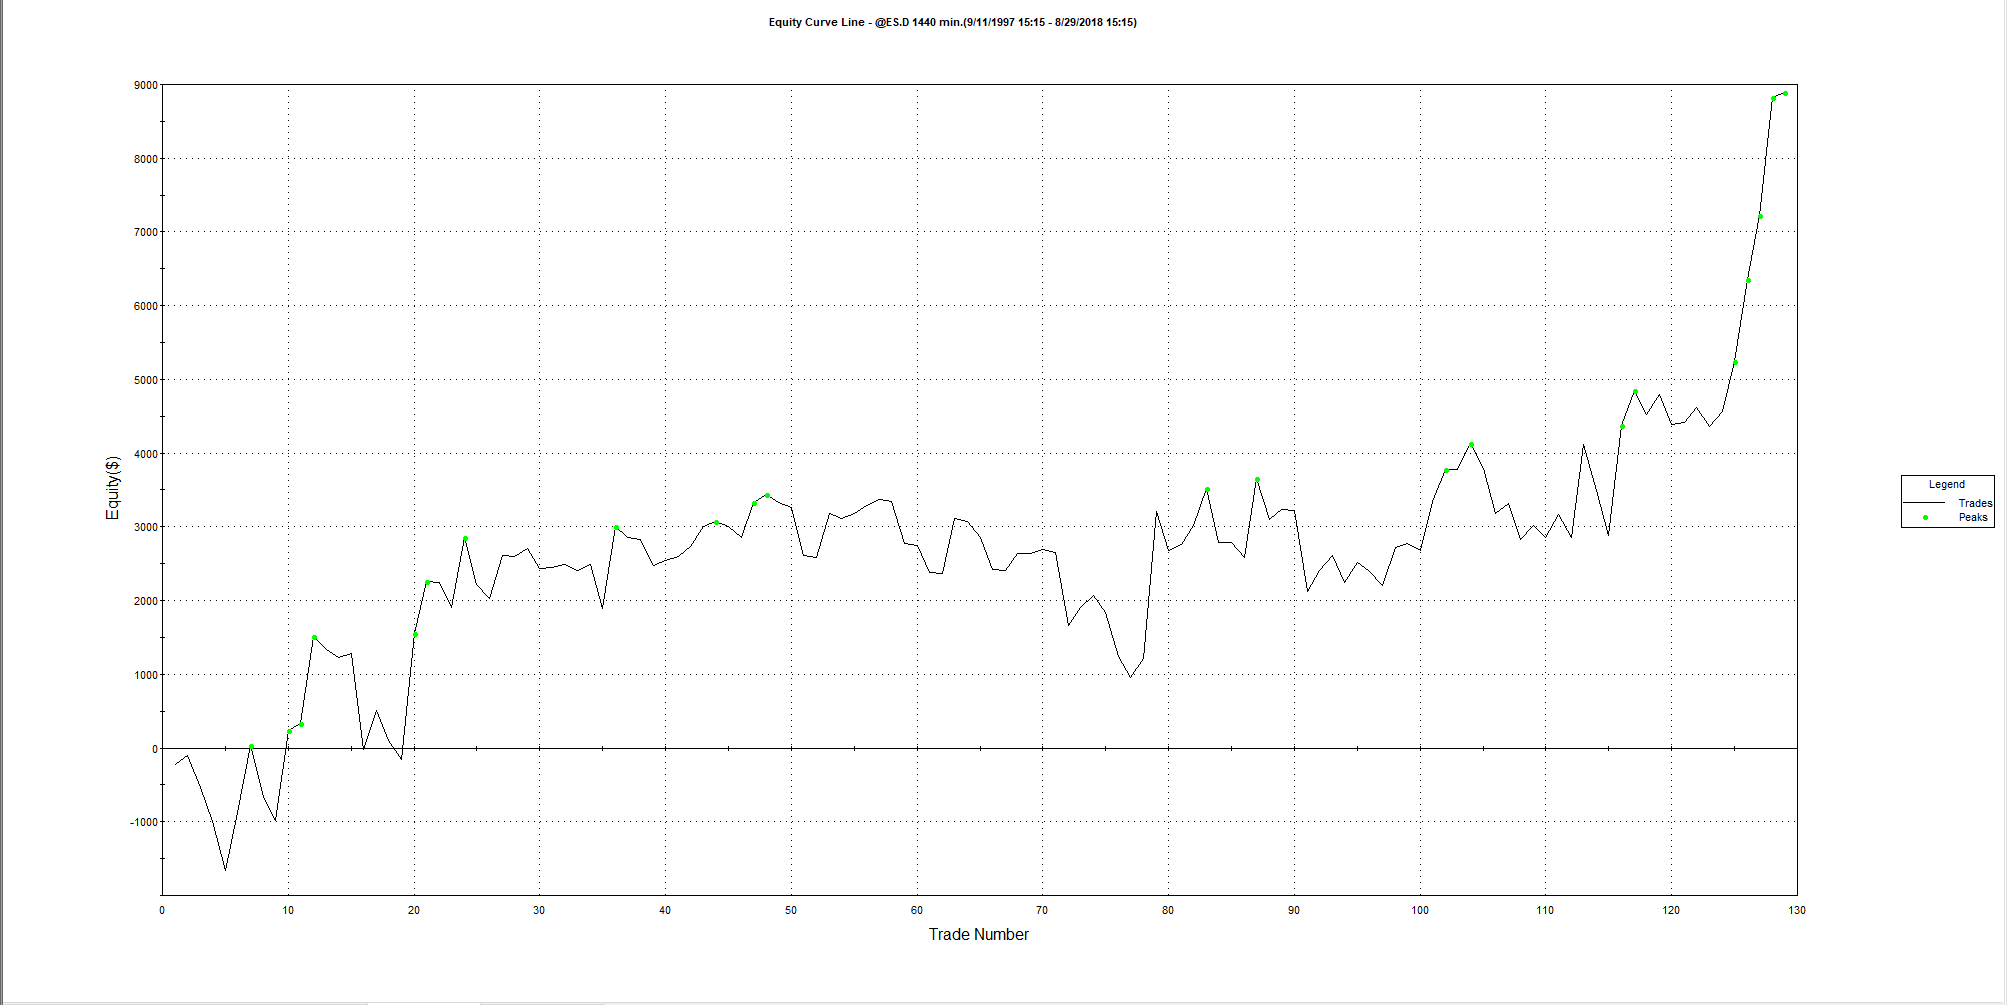
Now I felt like we could do more with our take-profits, that I wanted to capture more of trends when they really happened, so I experimented a bit with exits after (x) bars. Basically, I did 200 backtests with the same parameters except for exiting after 1 bars, 2 bars, 3 bars, and so on. This is also a great method to test the quality of entry signals, by the way – simply seeing where price goes 1 bars, 2 bars, 3 bars etc. after your entry. As you can see in the chart below, our signal is always profitable, no matter if we exit after 1 or 200 bars. That is encouraging and quite uncommon.

Inputs:
ExitBars(0);If Close < BollingerBand(Close, 20, -2) And Close > Average(Close, 200) Then Buy Next Bar At Market;
If BarsSincEentry = ExitBars Then Sell Next Bar At Market;
I am not too happy about the visualization options of TradeStation, other platforms are doing things better in this department, but oh well. We work with what we got. Two things are interesting here: The best profits happen around 150 days holding time, which correlates with our previous exit strategy at the other end of the BB (average holding time 147 days), but the results seem to be outliers (ideally, we want to have mountains with flat tops in this graph to ensure stability of our parameters, which the only one seems to be around 20-30 days in the lower part of the graph).
Going further into detail into the performance report, I don’t see an advantage of this method, but it adds one optimizable parameter to our strategy. Surely we could choose to exit all our trades after 30 days – it would reduce our average holding time drastically and give us a few more trades per year, but it would also decrease our overall performance while not reducing drawdowns. I will stick with the BB exit. You see, even in the realm of absolute numbers there is still room and need for discretion and personal preference.
So far, we didn’t optimize anything. We added a BollingerBand with standard settings and a moving average of 200 periods as our filter. I don’t want to optimize the moving average, and if I did, I would only do it in steps of 50 (50, 100, 150, 200, 250, 300). Experience tells me, it’s not worth it. What interests me more are BollingerBand length and the Standard Deviation units. An optimization of these (steps of 5 for BB length and steps of 0.5 for StdDev) results in the BB Length being shortened to 10, and the StdDev staying at 2.
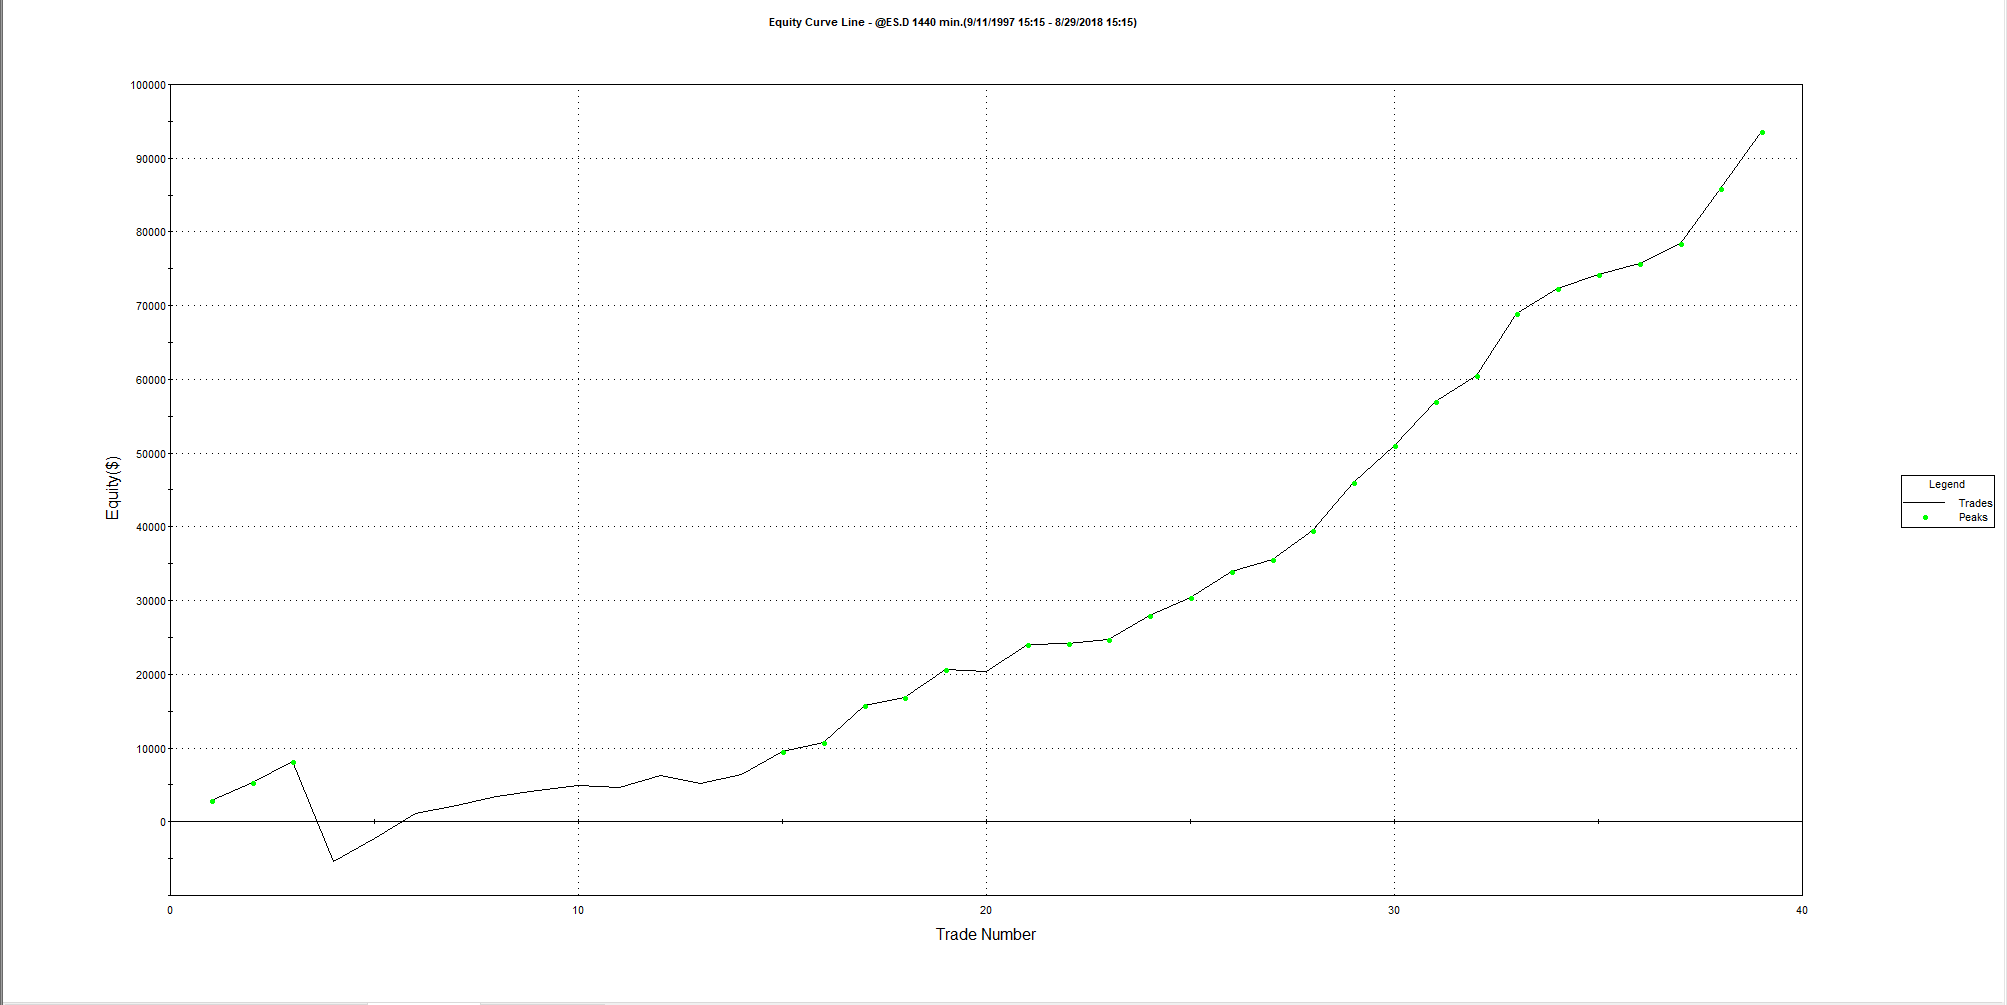
With these settings, we squeeze $20,000 more out of the market and have an even smoother equity curve. I won’t say no to that.

I then tried optimizing the upper and lower band separately (once again in order to see whether we could stay longer in winners), but that didn’t do much and only added another optimizable parameter. Let’s forget about that. So, here is our final EasyLanguage code.
Inputs:
BBLength(10),
BBDev(2),
MALength(200);If Close < BollingerBand(Close, BBLength, -BBDev) And Close > Average(Close, MALength) Then Buy Next Bar At Market;
If Close > BollingerBand(Close, BBLength, BBDev) Then Sell Next Bar At Market;
At 10% maximum drawdown with 120% return (no position sizing applied), this is quite a nice performance. Buy & Hold would have given us 134% over the same period, however without compounding and with the horrendous 2008 and 2001/2002 drawdowns. You would now have to add a protective stop, of course, in order to not go broke when the market goes completely sour. Also, this strategy trades only 2-5 times per year. While I can live with that, as there is only one optimized parameter, certainly this strategy won’t make us rich and needs a lot of capital with only one contract in play, in order to be traded. You’d need a diversified portfolio of 20+ strategies like this in order to make meaningful returns without going nuts on the risk.
Now you can do Walk-Forward analysis on this strategy if you want, or even Cluster-Analysis and what not, but in this case, it’s simply not necessary. It works as it is and will continue to keep working until capitalism goes ka-blammo.
What I mainly wanted to show you is that strategies don’t have to be complicated. Some of my day trading strategies have 10-20 lines of code and pass all the robustness tests with flying colors. And as you can see, the code is not difficult. To be an algotrader means to be creative and to be organized. And to be very, very curious about the subtle intricacies and characteristics of the markets that you want to develop strategies on.
Or sometimes, to be simply very, very blunt. Long only strategies on stock indices, a good place to start. Or maybe try the Apple stock? If you can develop methods to find out 1. what makes markets tick (trending, mean-reversion?) and 2. how efficient your entries are, and then have proper robustness testing methods and an organized process in place in order to stay creative and productive, well..let’s just say, this can be very rewarding. It certainly has been for me, so far.
PS, I am also learning to play the Piano and speak Japanese at the same time so stop making excuses ;-).


external link:


3 min read
“95% of all traders fail” is the most commonly used trading related statistic around the internet. But no research paper exists that proves this...

3 min read
Trendlines can be great trading tools if used correctly and in this post, I am going to share three powerful trendline strategies with you.

3 min read
Choosing the right trading journal is essential for traders wanting to analyze performance, refine strategies, and improve consistency. In this...