Supply and Demand Trading in 2026
We have been trading supply and demand strategies for over ten years, and they have stood the test of time remarkably well. Supply and demand is...
How often have you found yourself flipping through timeframes of the same instruments time and time again without really knowing what you were looking for!? And how many times did you identify a potentially good setup but then forgot about it just to see that it played out exactly as you thought it would a few hours later?!
| We’ve all been there, but the good news is that there is an easy solution how to overcome this nasty and time wasting timeframe-flipping habit: the trading plan. In this article we’ll show you how to setup the free program EvernoteTM so that it can be used as a very powerful personal trading plan and create your own trading plan template. |
Although it might look like a lot of work, a trading will save you time during the trading week and will undoubtedly increase your trading performance. And as we said in our last article, when you want to combine your regular job and trading, a trading plan is a must-have.
There are three simple questions you have to ask yourself and if you answer one with yes, a trading plan will definitely improve your trading performance:
If you say that you don’t need a trading plan, but you answered one of the questions with ‘yes’, you are lying to yourself out of laziness…
The purpose of a trading plan is to minimize the amount of the time you spend flipping through charts and searching for trades – and prevent traders from making impulsive decisions.
A trading plan is the professional approach to analyzing, planning and executing your trades. Whereas amateurs lack structure and jump from chart to chart trying to find a trading opportunity, the professional trader will know where and how he is going to trade before the markets open.
Based on your trading approach you create an individual game-plan for each instrument you trade. First, you perform a top-down analysis, including the analysis of price action, indicators, support/resistance, etc. Second, you evaluate whether you see a potential setup forming. If you can spot an interesting development on your charts that might generate a trading opportunity, write it down so that you can come back to it and check how things are playing out. Even better, create if-then scenarios for the setups that you are watching.
When you start your trading session you come back to the trading plan and analyze what happened during the time you were away and whether any of the potential setups you identified earlier are now ready. If you see new setups evolving, or potential setups you identified before got canceled, you have to update your trading plan as well.
We will show you how to set up EvernoteTM and turn it into a powerful trading plan. Why EvernoteTM? First, it’s a free tool which is easy to handle. Second, EvernoteTM comes with many features that allow traders to create the ultimate trading plan tool.
Obviously, you have to get EvernoteTM first.
>> Get EvernoteTM here
You also have to install one add-on to use EvernoteTM as a trading plan tool. Skitch is a tool which lets you take screenshots, draw on them and integrate them in your EvernoteTM notes.
>> Get Skitch here
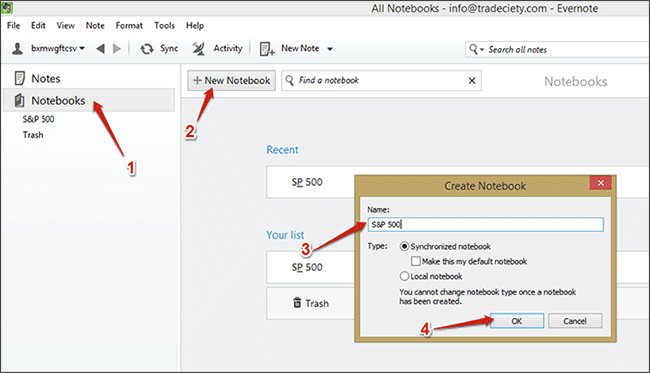
First, we will setup Evernote so that you can easily use it to organize your trading plan. You only have to do the setup once. To organize your trading plans, we will create a separate notebook for each instrument that you trade with 4 clicks.
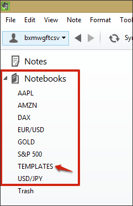 Now, you’ll have to repeat the 4 steps for each instrument that you trade. Your sidebar could look something like this once you are done.
Create an additional notebook called “Templates” because you are going to need it in the next step.
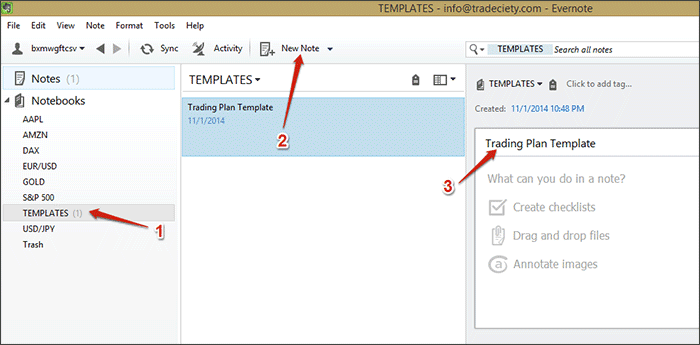 We are now going to create our first note, our trading plan template, but the process is almost identical to creating a notebook.
How you build your trading plan template highly depends on your trading method, but to give you a general idea how to structure it, we’ll give you a general example how your template could look like.
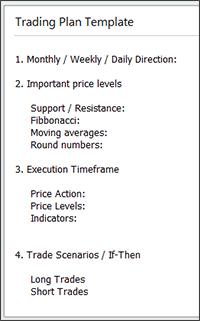 Usually, you start with a top-down analysis of your instrument. On the higher timeframes such as the monthly, weekly or the daily timeframe, you want to get a general feeling to where price is in relation to the ‘big picture’ and also identify the overall direction of your instrument. You don’t have to go into too much detail – here you just want to set the frame for your further analysis. Keep in mind, the purpose of a trading plan is to save time, therefore, keep your notes short and precise. If it takes too long to review your notes, your trading plan missed the point.
If you identified important price levels on the higher timeframes, you note them here. Which tools you use, depends on your trading method, but to give you an idea how what to write here, we added a few points.
Then, you’ll zoom in and go to the timeframe where you execute your trades. Here you take a closer look with regards to close by and important price levels (support and resistance, previous highs and lows, moving averages, Fibonacci sequences and levels …), price action patterns or other related developments and you also observe the indicators that you are using. Again, the goal of your trading plan is to minimize the time you spend analyzing charts during your trading hours, therefore, keep your notes precise, to the point and leave out unimportant things.
Now comes the most important part and why a trading plan is so valuable: the if-then trade scenarios. Although they depend on your trading style, we’ll provide you with some general examples how you could create if-then trade scenarios:
– Break and retest of a certain price level as support
– Break above a certain Moving Average, Fib level, support & resistance, previous high/low, round number)
– Release of fundamental data on XXX (insert the news event, the day and the number you want to see)
– Volatility / Volume reaches a certain level (defined by VIX, ATR, volume …)
– The formation of a certain price action pattern around a specific price level
– A specific setup on the indicators you use
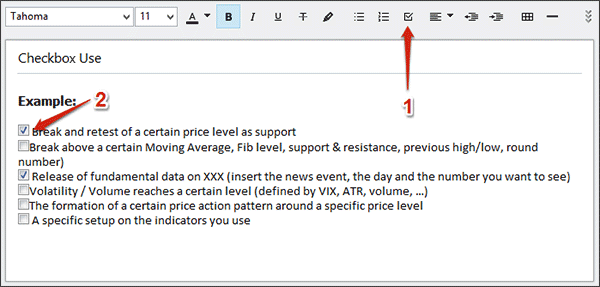
Another great tip is to add checkboxes to your trading scenarios. This way you can just check off things from your if-then list and see faster if your instrument is close to generating a trading opportunity or not.

A picture says more than thousand words and adding a screenshot of your charts with a mapped out trading game plan makes your analysis even more effective. In the beginning we mentioned that you should get Evernote’sTM add-on Skitch which allows you take screenshots, annotate them and upload them straight to your trading plans.
After you started Skitch, just click on ‘screen snap’ and Skitch will start the screen capture mode.
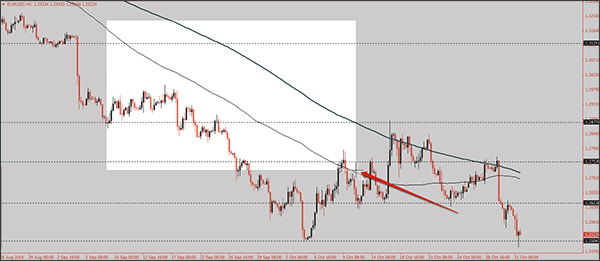
You can use your mouse to click and drag it over your charts to select the area you want to use for your screenshot.
Tip: CTRL + SHIFT + 5 will also start the screen capture mode.
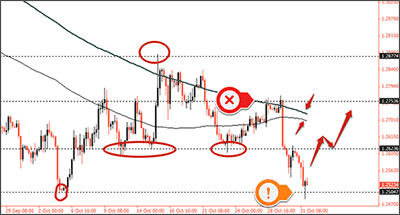 Skitch offers you a variety of arrows, lines, markers, text tools and a free hand drawing tool to choose from. Don’t overload your charts – keep it as clean as possible while visualizing your thoughts and trading plan.

Once you are done annotating, click and hold the ‘Drag Me’ button at the very bottom of your Skitch window and select the EvernoteTM trading plan note where you want to place your screenshot.
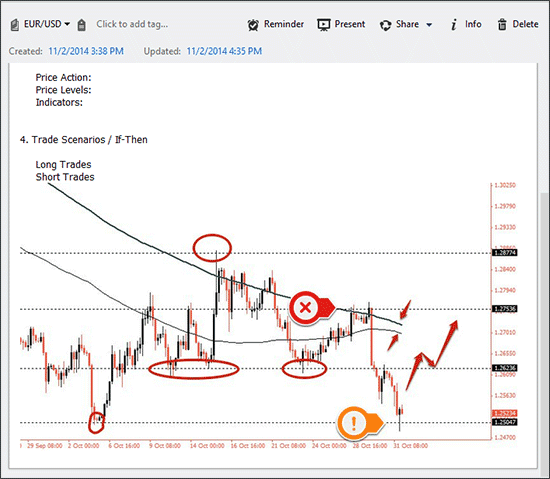
The screenshot will be pasted at the bottom of your trading plan note.
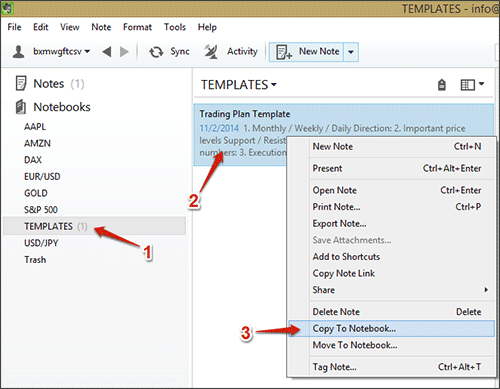
Now that you have created a trading plan template, you are ready to actually use it for your trading and analysis. Click on the notebook ‘TEMPLATES’ in the left sidebar, right-click on the ‘Trading Plan Template’-note in the middle of your screen and click on “Copy To Notebook” from the menu. Another window opens and you select the instrument you want to create a trading plan for.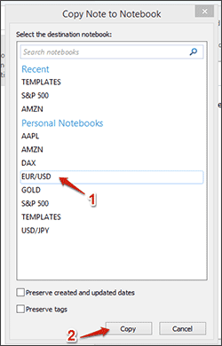
Each time you want to create a new trading plan for an instrument, you have to follow this step. It will keep your trading plan template where it is and copies a fresh template to the instrument you choose.
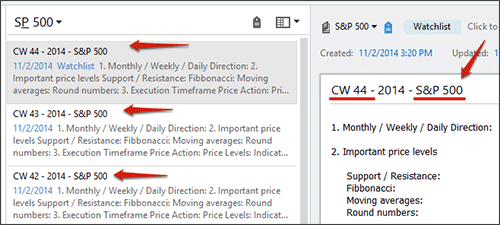
To stay on top of things it is important that you establish a professional approach right from the start. We suggest renaming each trading journal with either the current count of the calendar week or the day you created the trading plan on, and add the name of the specific instrument at the end as well – you’ll see why in a bit.
You will unquestionably see the biggest impact on your trading performance if you perform a thorough analysis on Saturday or Sunday, when the markets are closed and you have all the time in the world to analyze each instrument you trade. If you are not a full-time trader, but have a regular job during the week, creating a trading plan on your weekends is one of the easiest ways to increase your trading performance significantly even though you cannot watch your charts all day long and the best way to minimize the time you need to spend for trading during your week.
But don’t worry; you won’t have to repeat this process every day. If you have created a trading plan before the markets open, you just have to add and change little details throughout the week.
After you have done a detailed trading plan for each instrument, you will know which instruments are close to generating a trading opportunity and which instruments will need another day or two before you can enter a trade.
Fortunately, EvernoteTM offers another feature that helps us traders to organize our trading plans even more effectively: TAGS.
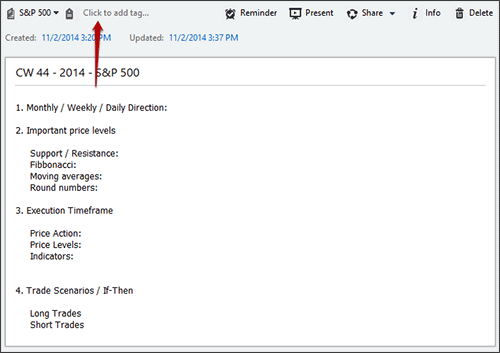
Adding a Tag to a trading plan is done with one click. Select the trading plan, click ‘Click to add tag…’ and type in the name of the tag. That’s it.
We’ll repeat it again one more time: the purpose of a trading plan is to minimize the amount of the time you spend flipping through charts and searching for trades – and prevent traders from making impulsive decisions.
Therefore, we use the EvernoteTM-Tags to organize trading plans by their importance and whether a trade is imminent or a setup needs a few more days to play out. We chose to call the tags by weekdays. We’ve found that this is the easiest approach to stay on top of things and make the monitoring as intuitive as possible.
For example, after you’ve done your trading plan on a Sunday afternoon and identified instruments that are close to generating a trade, you assign the tag Monday to the specific instrument. If you then come back to your trading platform Monday morning, you just click the tag Monday and your EvernoteTM shows you all the instruments and trading plans for that day.
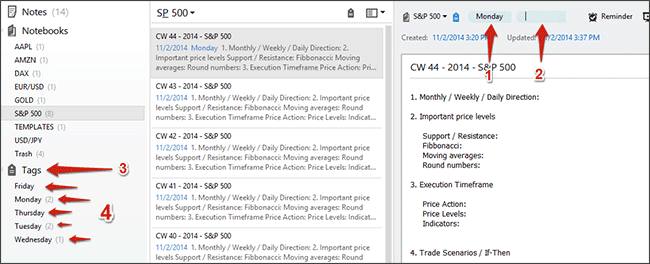
You can see if tags have already been assigned to a note (1), add new tags (2) and you can navigate all assigned tags through the list in the sidebar (3)(4).
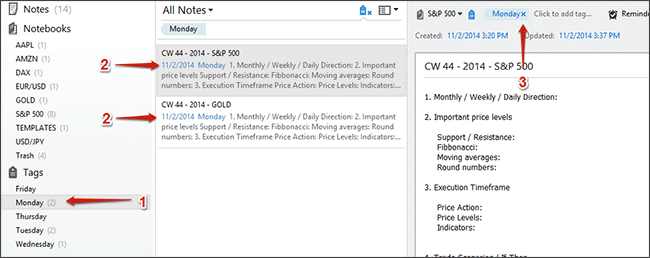
If you have created all your trading plans during your weekend and assigned tags to the instruments where you expect a trade to happen soon, you can just select the Tag that represents the current day (1) and EvernoteTM will show you all the instruments and the trading plans with that specific tag (2). If a potential trading opportunity is cancelled, you can just click the x next to the tag and the trading plan disappears from the tag. You then can fully concentrate on the instruments that are listed for the specific day.
After the end of each trading day, you should go through the trading plans that have the tag of the current and the next day assigned to them. Check the specific ‘if-then trading scenario’ part of each trading plan and compare it with your charts and decide whether the instruments are closer to generating a trading opportunity and require closer attention or not.
For example, if you thought the EUR/USD might generate a trade on Monday but it didn’t, you can just delete the Monday-tag and use the Tuesday-tag instead. If price and/or fundamental developments moved in a way that makes the instrument uninteresting, you can delete all the tags and check it again on your weekend when you create a new trading plan.
– Create a detailed trading plan for each instrument you trade.
– If you expect a trade to happen on Monday, assign the Monday-tag to the instrument’s trading plan.
– If you expect a trade to happen at a later point during the week, use the tag Tuesday, Wednesday, Thursday or Friday.
– select the tag Monday and analyze the instruments which you are going to monitor that day.
– Don’t open charts of instruments that are not listed under Monday.
– At the end of the trading day, go through the trading plans with the tag Monday to check whether things played out as they did, if you expect a trade to happen later during the week, select the tag Tuesday, Wedsnesday,…, or if your trading scenarios got cancelled and you don’t have to watch the instrument anymore during that week, delete the tags.
On Tuesday, Wednesday, Thursday and Friday you just repeat the steps from Monday.

We have been trading supply and demand strategies for over ten years, and they have stood the test of time remarkably well. Supply and demand is...

3 min read
Choosing the right trading journal is essential for traders wanting to analyze performance, refine strategies, and improve consistency. In this...

3 min read
“95% of all traders fail” is the most commonly used trading related statistic around the internet. But no research paper exists that proves this...
