Supply and Demand Trading in 2026
We have been trading supply and demand strategies for over ten years, and they have stood the test of time remarkably well. Supply and demand is...
4 min read
Rolf
Nov 4, 2019 4:14:51 AM

The Commodity Futures Trading Commission publishes the COT report every Friday at 2:30 p.m. Eastern Standard Time and it is composed of vital information regarding the positions of retail traders, hedge funds and other institutional speculators including banks and financial institutions.
Currency futures can play an important role in identifying which way the wind is blowing and if you want to trade in the same trend direction of large institutional traders, then the Commitments of Traders (COT) report from the Commodities Futures Trading Commission (CFTC) can help you do so.
One of the vital points of trading currencies in the multi-trillion-dollar interbank market is the very nature of this market. When we think about currency trading, it often means traders are free to exchange one currency for another without involving any central exchange. Hence, the bulk of the transactions in the interbank market happens over the counter (OTC).
The lack of a central exchange in the Forex market means there is no way to measure how much capital is going short on a currency pair against going long and vice-versa. So, when we take a look at the Level II orders, it often only shows pending orders from other clients of your broker, but not the entire market positions.
However, the COT report from the CFTC compiles a weekly tally of all futures orders and if you know how to interpret the data properly, it can provide traders with ample ammunition to understand if a trend will continue or reverse or even forecast if a new trade will start from the scratch in the near future.
The CFTC publishes a range of COT reports on a weekly basis. However, as Forex traders, we need to only pay attention to the Current Legacy Report. To be specific, we need to interpret the Futures Only Short Format of the Chicago Mercantile Exchange.
Once you have opened the Short Format report, you will find a huge amount of text and nothing more. No charts and no specific headings that can remotely indicate that this report can be used by spot traders.
However, if you pay close attention, you can see the text-only report categorizes all data under currency-specific tables. If you are interested in the British Pound, just search for “POUND STERLING” or if you are interested in the Canadian Dollar, search (Ctrl + F) for “CANADIAN DOLLAR.”

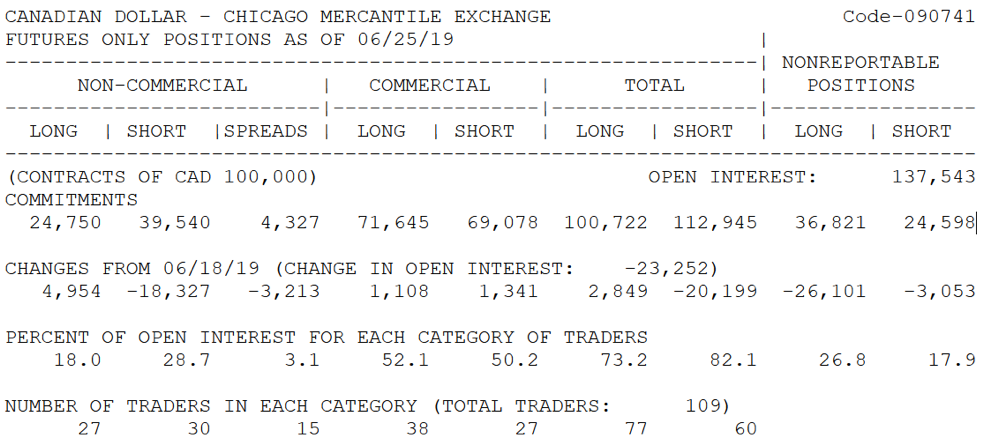
Figure 1: Screenshot of Chicago Mercantile Exchange Futures Only Short Format Data of Canadian Dollar
Let’s try to decipher what these numbers represented in figure 1.
The NON-COMMERCIAL data typically consist of speculative traders that include hedge funds, retail traders, and financial institutions who have either long or short exposure. For example, a hedge fund might think that the rate of USD/CAD will go down and takes up a futures contract to speculate in the market in order to earn a profit from a change in the price of the currency pair.
The COMMERCIAL data is usually made up of positions of legitimate businesses that are using futures contracts to hedge against large currency swings. For example, if an American importer wants to buy a number of cars from Toyota, they might place an order now and have to pay the entire sum in Japanese Yen in six months’ time when the cars will be delivered to the port in New York. Since the rate of USD/JPY can fluctuate within this six-month time period, the importer may hedge his position by buying currency futures.
Commercial positions are usually not taken to speculate, but these contracts are taken to protect the businesses from drastic price swings in the currency market. However, these contracts can also reveal developing market trends.
The total column is just the sum of non-commercial and commercial positions. On the other hand, the Long and Short columns represent the number of positions taken by traders.
Before you can interpret the COT report for gauging trends, first you need to have an idea about how the market works.
Let’s say you found a COT report of USDCAD that shows the extreme difference between the net long and net short positions. While the COT report does not show at which price the positions are taken, the sheer volume of long and short positions can reveal the future directional movement of a currency pair.
When the majority of contracts are long, everyone will want to bid up the price. But, a lack of short positions means the uptrend will have to end soon. Hence, eventually, the price will go down. By contrast, if you see a large number of Short positions, but a relatively low number of Long positions, it will usually indicate an uptrend.
We know, this explanation seems counterintuitive. Hence, in the following examples, we will simplify the process and show you the COT indicator on TradingView that you can use for trading COT reports.

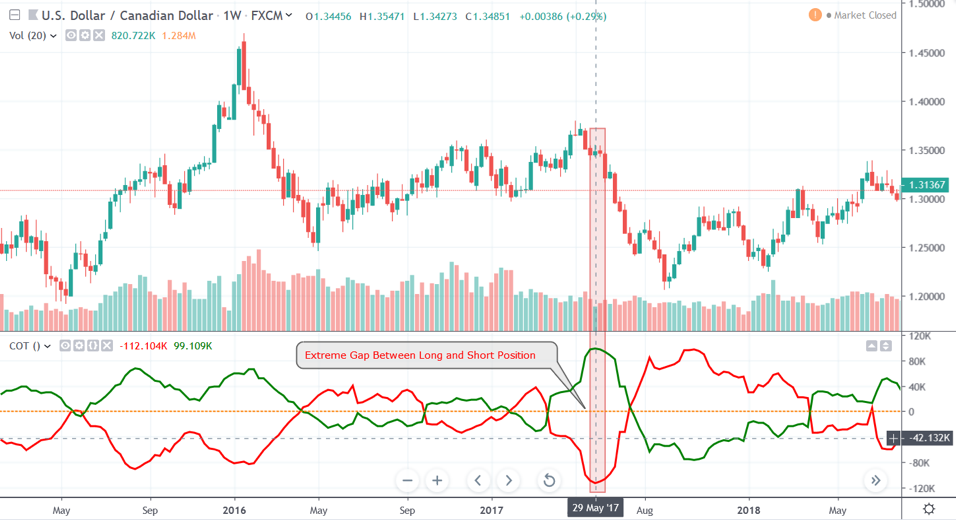
Figure 2: COT Report Showing High Long Positions but Relatively Low Short Positions
In figure 2, we can see that on May 21, 2017, the USD/CAD had a -112.104K short positions but only 99.109K long positions. As you can see, in the following weeks, the spot rate of USDCAD fell and triggered a downtrend.

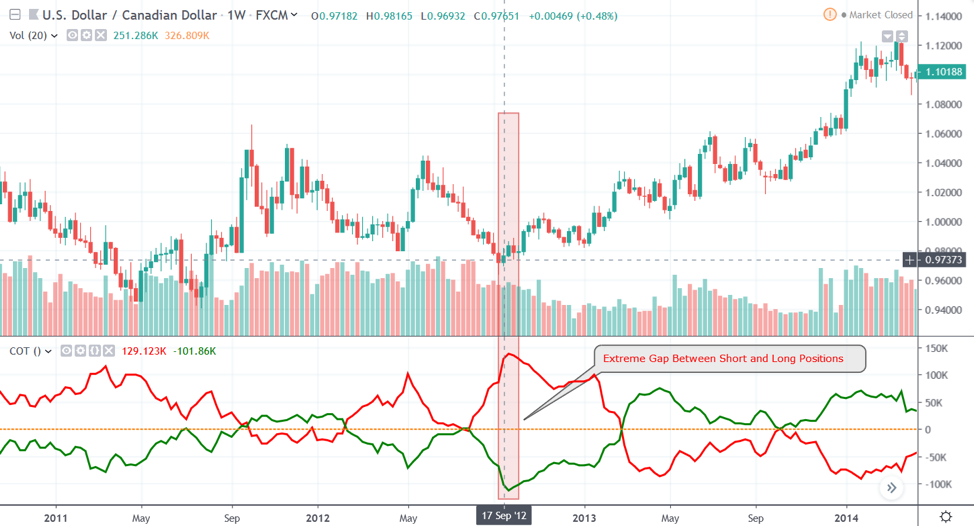
Figure 3: COT Report Showing High Short Positions but Relatively Low Long Positions
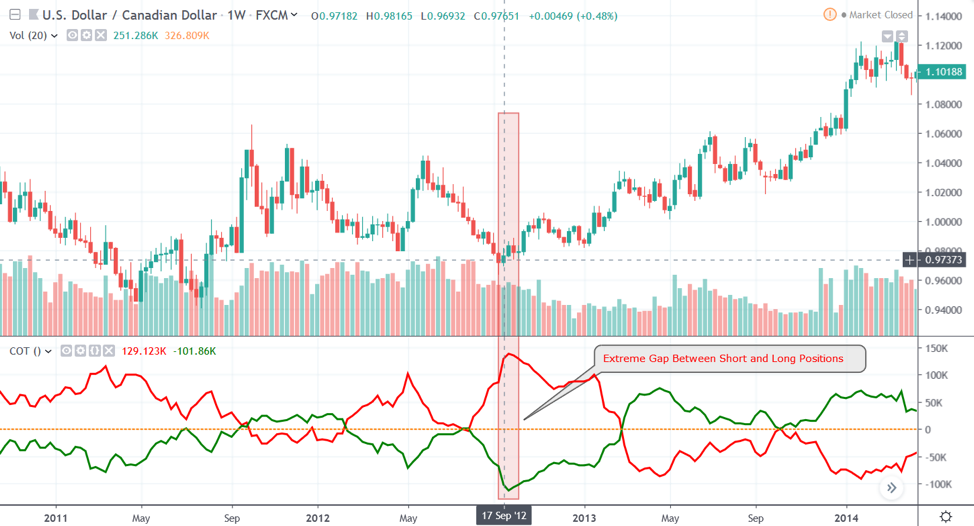
In figure 3, we can see that on September 17, 2012, the USD/CAD had a 129.123K short position but only -101.86K long positions. As you can see, in the following weeks, the spot rate of USDCAD went up and triggered an uptrend.
Since the CFTC publishes the COT reports on a weekly basis, it makes sense to use the Futures long and short figures to trade on the Weekly timeframe. However, most retail Forex traders are day traders. Therefore, you can keep the long-term perspective in mind and still trade on the daily or even lower timeframe in the direction of what the COT reports indicate.
If you can successfully align your technical trading strategy in line with the broader trend indicated in the COT report, it can magnify your win rate and help you catch large trends.

We have been trading supply and demand strategies for over ten years, and they have stood the test of time remarkably well. Supply and demand is...

3 min read
Choosing the right trading journal is essential for traders wanting to analyze performance, refine strategies, and improve consistency. In this...

3 min read
“95% of all traders fail” is the most commonly used trading related statistic around the internet. But no research paper exists that proves this...