3 min read
Scientist Discovered Why Most Traders Lose Money – 24 Surprising Statistics
“95% of all traders fail” is the most commonly used trading related statistic around the internet. But no research paper exists that proves this...

In the past weeks we have analyzed different indicators and trading tools. Now it’s time to combine what we have learned and apply it to the charts. In the following article we explore how to use confluence analysis to detect price targets, how to stay in trades longer and how to identify possible reversals. For this purpose, we use Bollinger Bands, Fibonacci extensions, the MACD histogram and price action patterns to form well-rounded trade ideas.
As we have said in numerous articles, many helpful trading tools and indicators exist, but each has its advantages and shortcoming. By combining different tools, a trader can offset the weaknesses of individual concepts and create a sophisticated and more reliable trading approach. First of all, let’s explore the limitations and advantages of the different trading tools in question:
Pros: Meaningful reversals often start when price breaches the outer Bollinger Bands.
Cons: In a strong trend, price can ‘ride the outer Bands’ for a long time without reversing.
Read more about Bollinger Bands
Pros: After price reaches the 168/200 Fibonacci xtension, reversals are often likely.
Cons: Can only be applied ton the second wave of a trending move, because of the ABC pattern.
Read more about Fibonaccis
Pros: The divergence is usually a very reliable factor when it comes to identifying turns.
Cons: Choppy price behavior can make the MACD histogram unreliable. Requires clean swings because it is classified as a trend indicator.
Pros: Commonly known concepts. Some patterns can deliver accurate signals.
Cons: Often very subjective signals.
Confluence is the magic word when it comes to building a trading idea. Traders who only rely on a single indicator or tool, will receive very mixed results to say the least. By combining indicators and trading concepts, a trader can significantly enhance the quality of his decision making process and often increase the reliability of his signals while offsetting the limitations of individual trading tools.
In the following examples, we use 4 different trading concepts to form trade ideas (Bollinger Bands, MACD, Fibonacci Extensions and price action). However, we do not require all criteria to be present at all times to enter a trade. We differ between a no-trade scenario, an inferior trade, a decent trade and an optimal-trade scenario. The checklist below shows how the different scenarios are characterized. Furthermore, if you follow such a structured approach and categorize your trades into different classes, you will be able to see which signals provide more reliable signals and which do not add additional value.
| No-Trade Scenario | Inferior Trade | Decent Trade | Optimal Trade | |
| Bollinger Bands(Breaching the outer Band) | 1 out of 4 criteria is present | 2 out of 4 criteria are present. | 3 out of 4 criteria are present. | All criteria are present. |
| MACD(Divergence) | ||||
| Fib Extension(168/200 Fib extension) | ||||
| Price Action(Reversal patterns) |
First, look at the left screenshot. How often do you find yourself in such a position where you look at a very overextended trending move and wonder why it has turned at a specific price, but did not reverse earlier? Traders have a tendency to try to call tops and bottoms which, if done incorrectly, can lead to disastrous results.
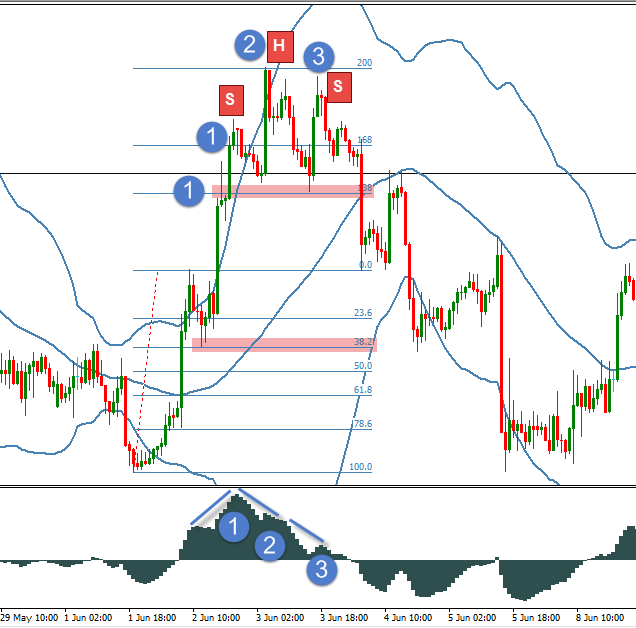
If we take a look on the right screenshot, it becomes much clearer.
Point 1) After the second swing, price barely touched the Bollinger Bands (weak signal), it also came short of the 138 Fib extension (another weak signal) and we cannot spot a reversal price action pattern. The only thing pointing to a possible reversal is the MACD divergence.
Recapitulating: MACD divergence à only 1 out of 4 criteria à No strong signal and no trade
Point 2) Now, price made it to the 168 Fib extension (very extended move), it breached the outer Bollinger Band significantly and the MACD histogram is showing a divergence. Only the price action reversal pattern is missing (although a Head & Shoulders patter formed later as well).
Afterwards, the reversal was very strong and pronounced.
Recapitulating: Fib extension, Breached Bollinger Band, MACD divergence à 3 out of 4 criteria à Decent Trade
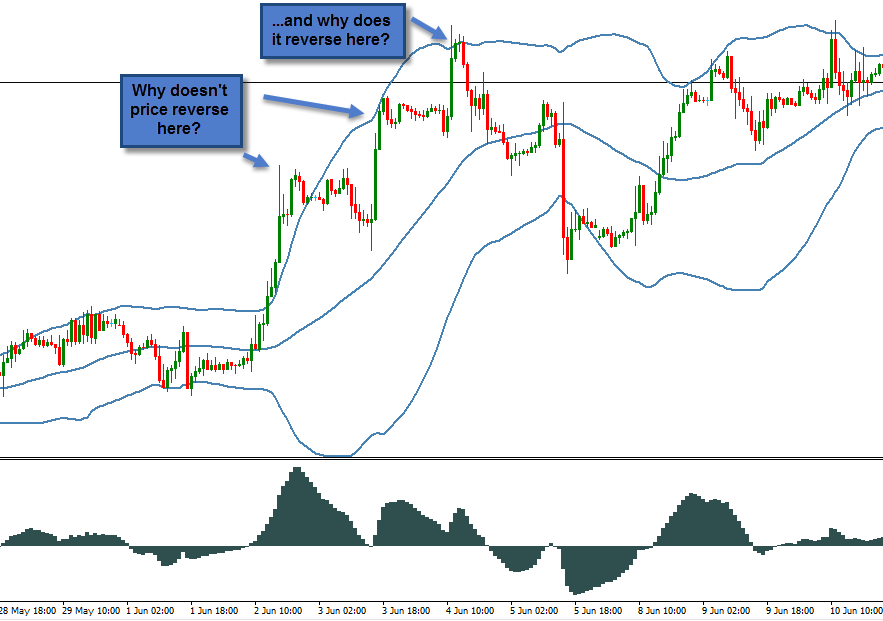
Scenario 1: Why didn’t price reverse earlier? Click to enlarge |

Scenario 1: Identifying concluence and building a trade scenario. Click to enlarge |
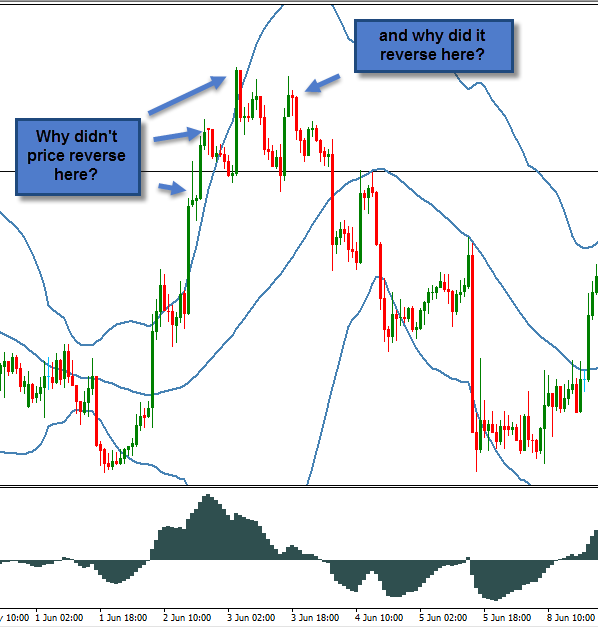
This price scenario is very similar. After a strong bullish move, price made three more bullish moves before finally reversing. Were there clues that could have signaled why the first three retracements did not lead to a stronger reversal and why price kept on trending? Let’s take a closer look.
Point 1) We have two retracements here:
First, we can see a pinbar (reversal pattern) outside the outer Bollinger Band (another signal) at the 138 Fibonacci extension (not a reversal area) and also the MACD was still bullish.
Recapitulating: Price action pattern, Breached Bollinger Bands à 2 out of 4 criteria à Weak signal and inferior trade (would have resulted in a loss for traders who only rely on 2 criteria)
Still at point 1) After the next bullish push, traders had to deal with another possible reversal scenario. Let’s revisit it:
We are again outside the outer Bollinger Band (signal), broke through the 168 Fibonacci extension (another signal), no price action pattern is present and the MACD is chopping around (not interpretable – need a clear price swing because it is a trend indicator).
Recapitulating: Overextended Fibonacci level, Breached Bollinger Bands à 2 out of 4 criteria à Weak signal and inferior trade (Depending on trade management, this trade would have resulted in a loss or a small profit for traders who only rely on 2 criteria)
Point 2) Again, price went outside the outer Bollinger Bands (signal), it reached the 200 Fibonacci extension (signal) and the MACD printed a divergence (note that the divergence was only confirmed once price went back into the Bollinger Bands). Only the reversal price action pattern was missing.
Recapitulating: Overextended Fibonacci level, Breached Bollinger Bands, MACD divergence à 3 out of 4 criteria à Good signal. The retracement was also much stronger than on the previous point. Depending on the trade management, a trader could have realized a profit.
Point 3) This time, the swing did not make it past the previous swing high (lower high , a bearish signal) and not made it through the outer Bollinger Bands. The MACD is showing a convergence (lower MACD and lower high à bearish confirmation). Price came close to the 200 Fibonacci again and we saw a head and shoulders pattern.
Recapitulating: 3 out of 4 criteria present. (Fibonacci, MACD and price action reversal pattern). Would have resulted in a winning trade.
Click to enlarge |
Click to enlarge |
The last scenario we are going to revisit is a strong bearish trend on the DAX. Price stayed below the middle Band and the outer Band for almost the whole time, and even was outside the lower Band for quiet some time, without reversing. Just recently we saw the reversal that caused price to go all the way to the upper Bollinger Band. Let’s take a look why it happened, when it happened.
Point 1) Price is outside the outer Bollinger Band and the MACD is showing a divergence. But, price just barely broker below the 0 Fibonacci and is nowhere near the overextended Fibonacci area and no price action pattern occurred.
Recapitulating: 2 out of 4 criteria present (Bollinger Band and MACD divergence). Could have resulted in a (small) profit, if a trader feels comfortable taking trades with only 2 confirmation signals.
Point 2) Price had been outside the outer Bollinger Bands for a relatively long time, the MACD is showing a convergence (lower lows on price and lower lows on the MACD histogram). No price action pattern is present and price is only at the 138 Fibonacci extension.
Recapitulating: Only 1 out of 4 criteria present. No trade.
Point 3) Price did not make it through the outer Bollinger Band. But the MACD is showing a divergence, price stopped right at the 168 Fibonacci level and we saw an opening run-away gap which is a bullish signal at this level.
Recapitulating: 3 out of 4 criteria present (MACD divergence, price action pattern, Fibonacci extension). Decent trade setup followed by a strong reversal to the opposite Bollinger Band.
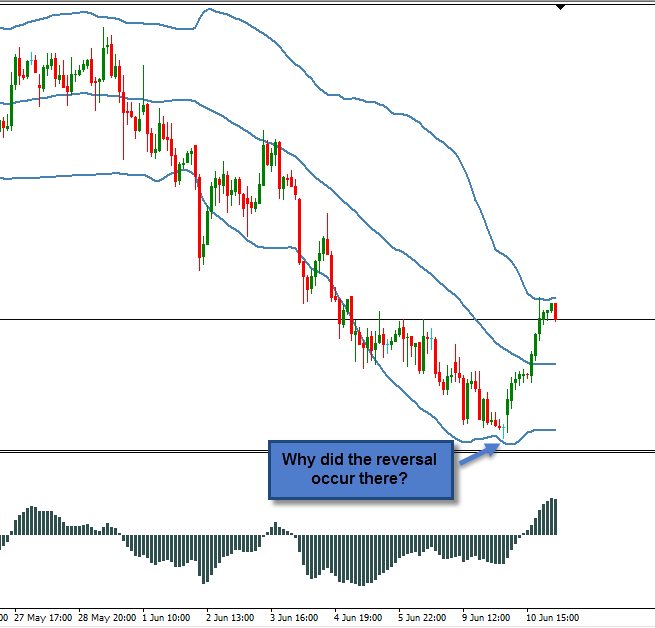
Scenario 3: Why did the price reversal where it occured? Click to enlarge |
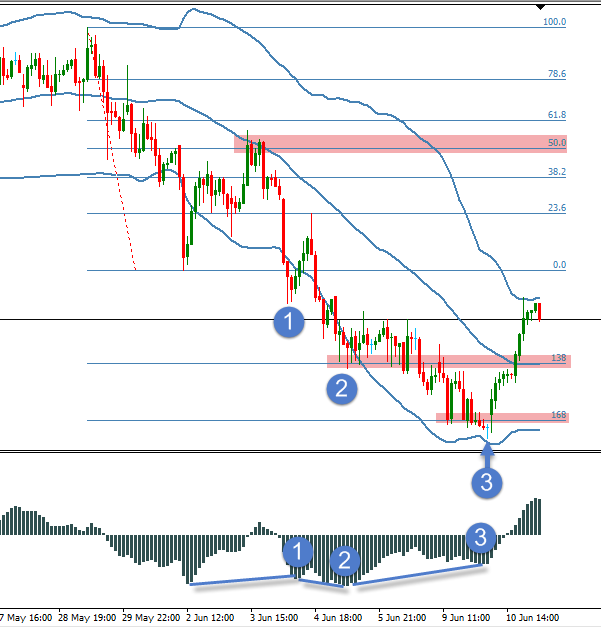
Scenario 3: Reasons why price did not turn earlier. Click to enlarge |
There are numerous takeaway lessons from this article we want to highlight:


external link:


3 min read
“95% of all traders fail” is the most commonly used trading related statistic around the internet. But no research paper exists that proves this...

3 min read
Trendlines can be great trading tools if used correctly and in this post, I am going to share three powerful trendline strategies with you.

3 min read
Choosing the right trading journal is essential for traders wanting to analyze performance, refine strategies, and improve consistency. In this...