Supply and Demand Trading in 2026
We have been trading supply and demand strategies for over ten years, and they have stood the test of time remarkably well. Supply and demand is...

During the Friday Chart of the Week posts, I want to use the opportunity to dive into important topics that I haven´t talked too much about in our other blog articles previously.
This week, I want to focus on trading sessions and why it is important to keep an eye on the different trading sessions. This is especially true for day trading strategies on the lower timeframes.
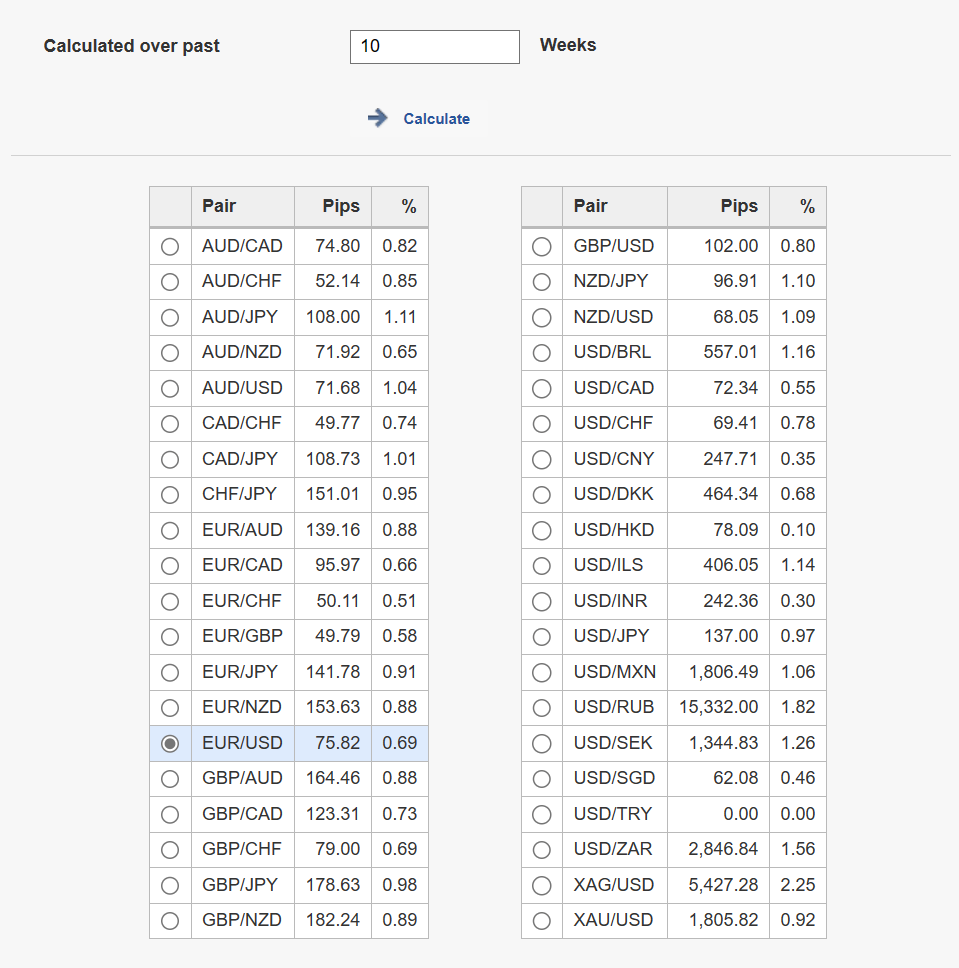
The tables below show the average daily price volatility in pips, but also in percentages. You can also check out the volatility table on investing.com.
During the first step, traders have to identify instruments that are showing high levels of price movements. Only when the price is moving, there is a potential to capture trades that will provide enough upside potential.
In the left table, the highest percentage movers are the AUD/JPY, the AUD/USD, and the CAD/JPY. Instruments that have low percentage volatility levels might be trading in narrow ranges and not show long-lasting trending phases.
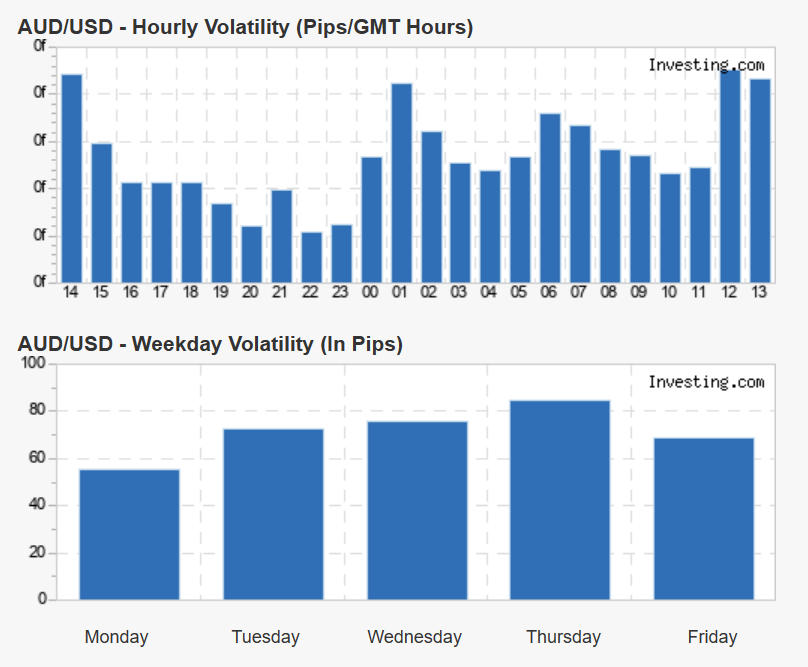
Second, you have to check to see if the instrument is also active during your active trading sessions.
For me, for example, living in Germany, the AUD/USD is a great choice because it has its volatility peak around 12 pm until 3 pm as you can see in the screenshot below. There is a slight peak around 1 a.m. but this falls right into the middle of the night and is, therefore, not optimal. However, three active trading hours are usually sufficient when you are a day trader.
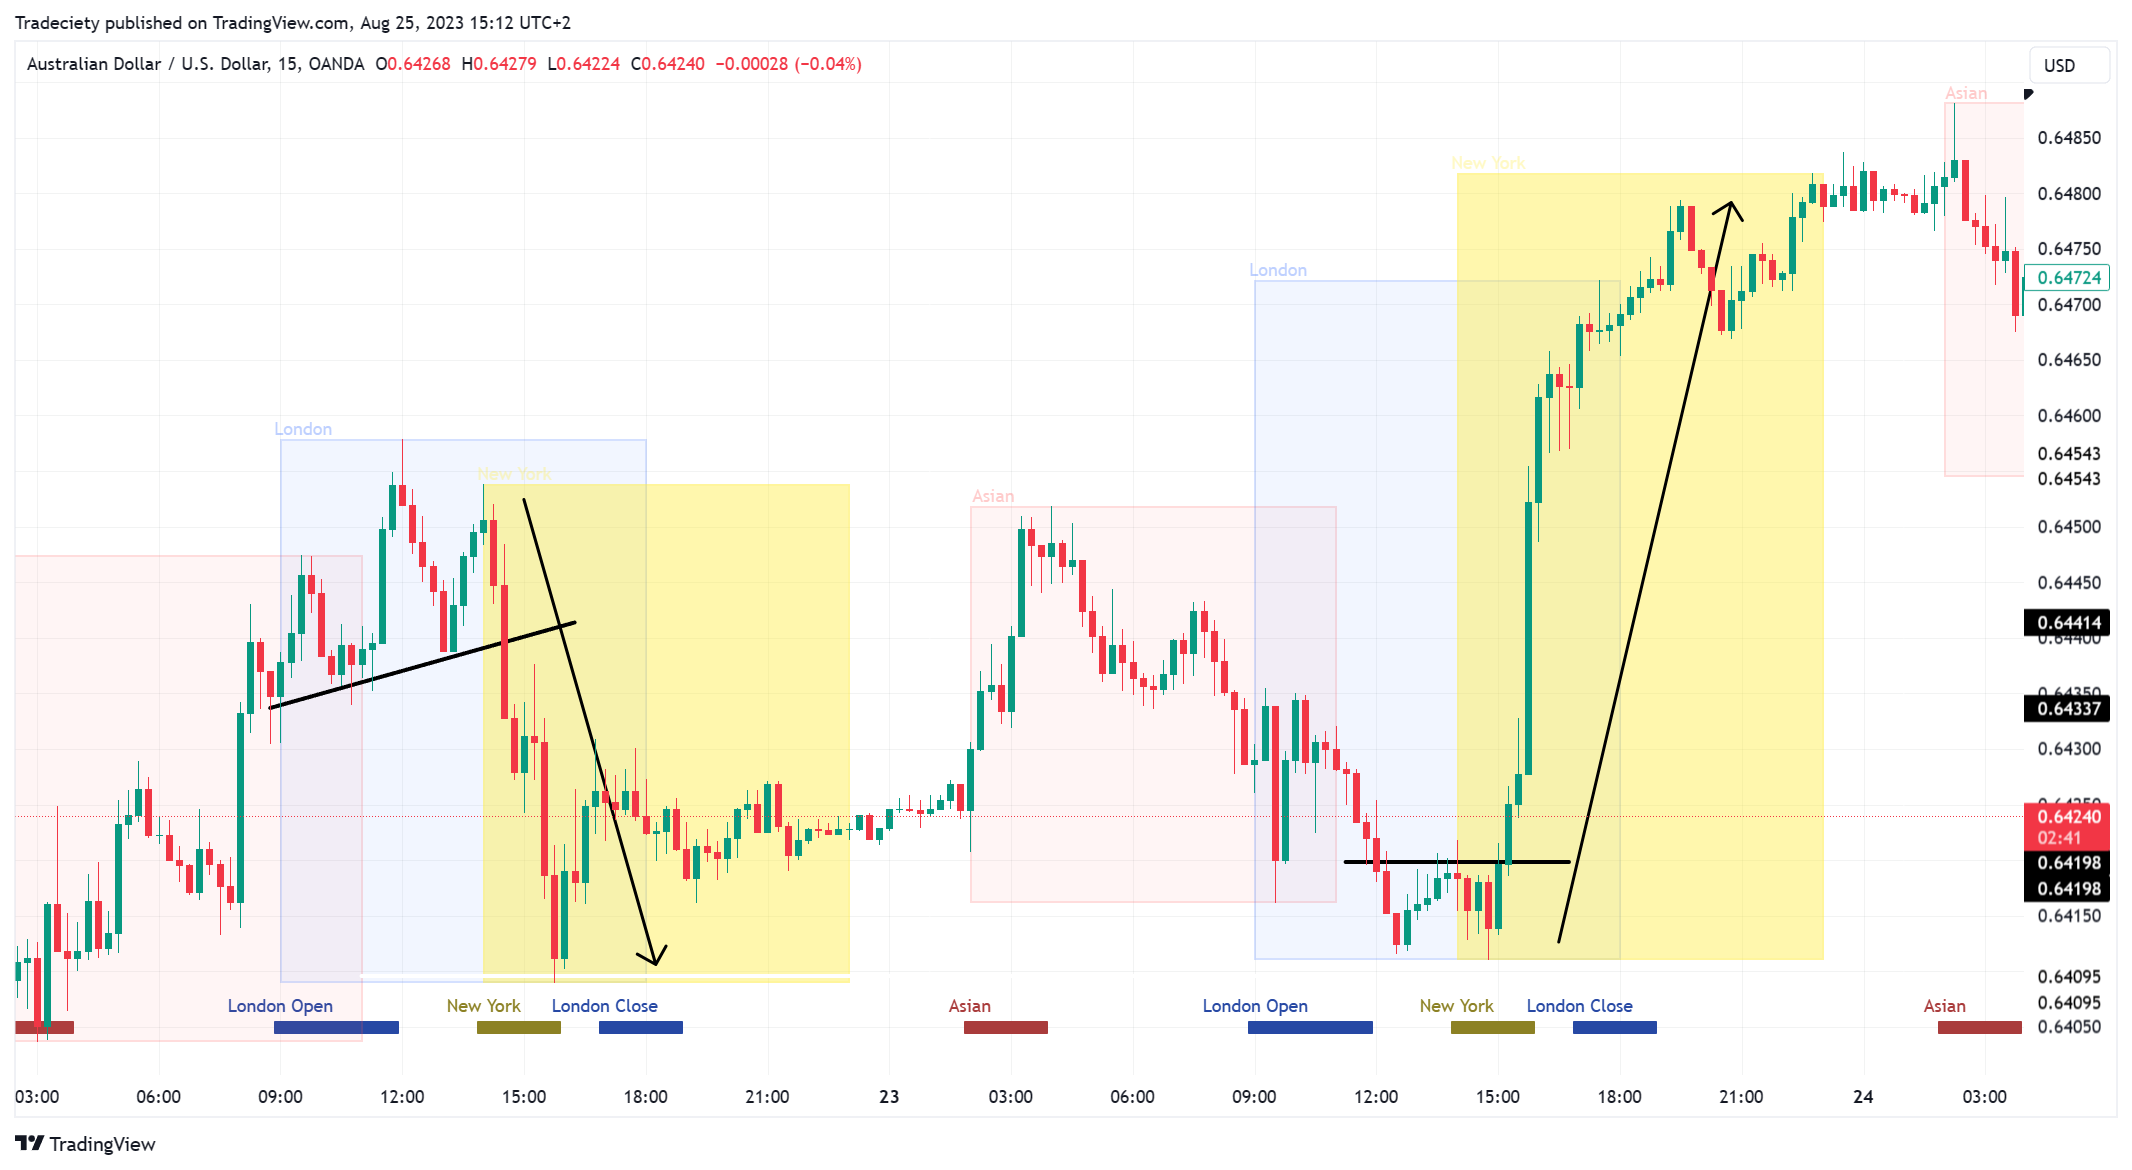
When we take a look at the actual AUD/USD price chart in the screenshot below and focus on the yellow box which is roughly the time from 12 pm until 3 pm, we can see that the price indeed made significant moves during that time.
Of course, this will not hold true for all days, but it is a great starting point to improve your market selection based on your own personal schedule.
I would recommend taking a look at the Forex volatility calculator that I linked above. First, identify Forex pairs that move the most and then confirm that the pairs are also moving during your active trading time.
Often traders are surprised about their findings because they might have traded markets in the past that are not optimal for their own personal schedule.
external link:


We have been trading supply and demand strategies for over ten years, and they have stood the test of time remarkably well. Supply and demand is...

3 min read
Choosing the right trading journal is essential for traders wanting to analyze performance, refine strategies, and improve consistency. In this...

3 min read
“95% of all traders fail” is the most commonly used trading related statistic around the internet. But no research paper exists that proves this...