Supply and Demand Trading in 2026
We have been trading supply and demand strategies for over ten years, and they have stood the test of time remarkably well. Supply and demand is...
In this week´s chart of the week edition, I want to zoom out and look at the broader market since there have been significant changes over the last weeks.
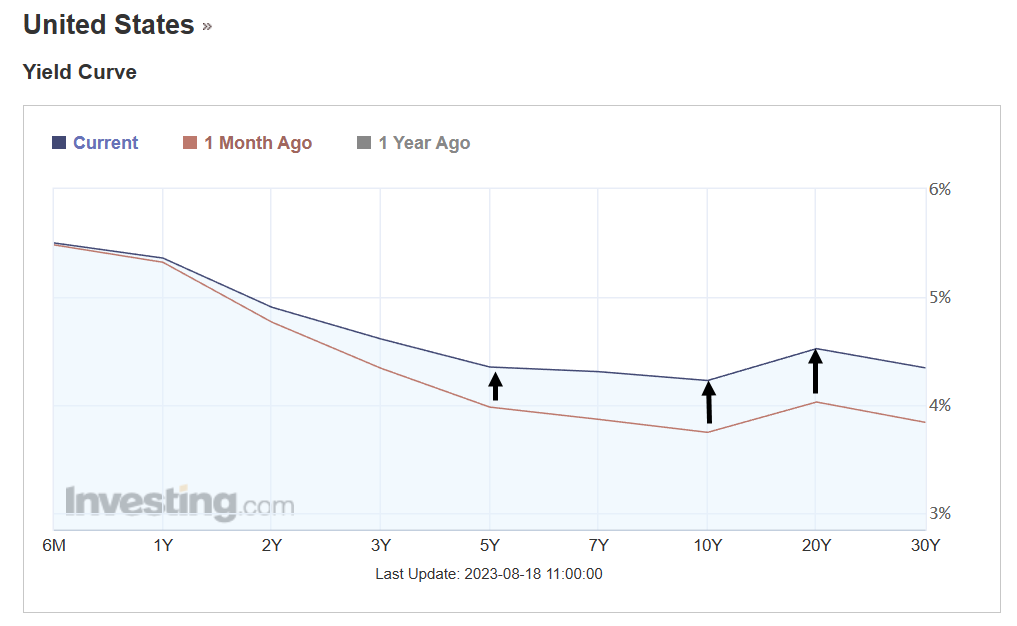
The image below shows the development of the yield curve in the US for government bonds with different maturities and the implication for stock, Futures, and Forex traders are important.
The blue and brown graphs show the difference between the current yield curve (blue) and the yield curve from one month ago (brown).
The yields for longer-term government bonds have risen over the last month which indicates that investors believe that the interest rates are going to stay higher for longer. This is due to the overall robustness of the employment market and the high level of consumer spending. Over the last 18 months, the FED has hiked rates continuously to record highs, and previously investors believed that rates won´t stay as high for the long term. But given the current economic environment, this seems to change and higher long-term rates can have far-reaching impacts as we were able to see on our price charts this week.
source: investing.com
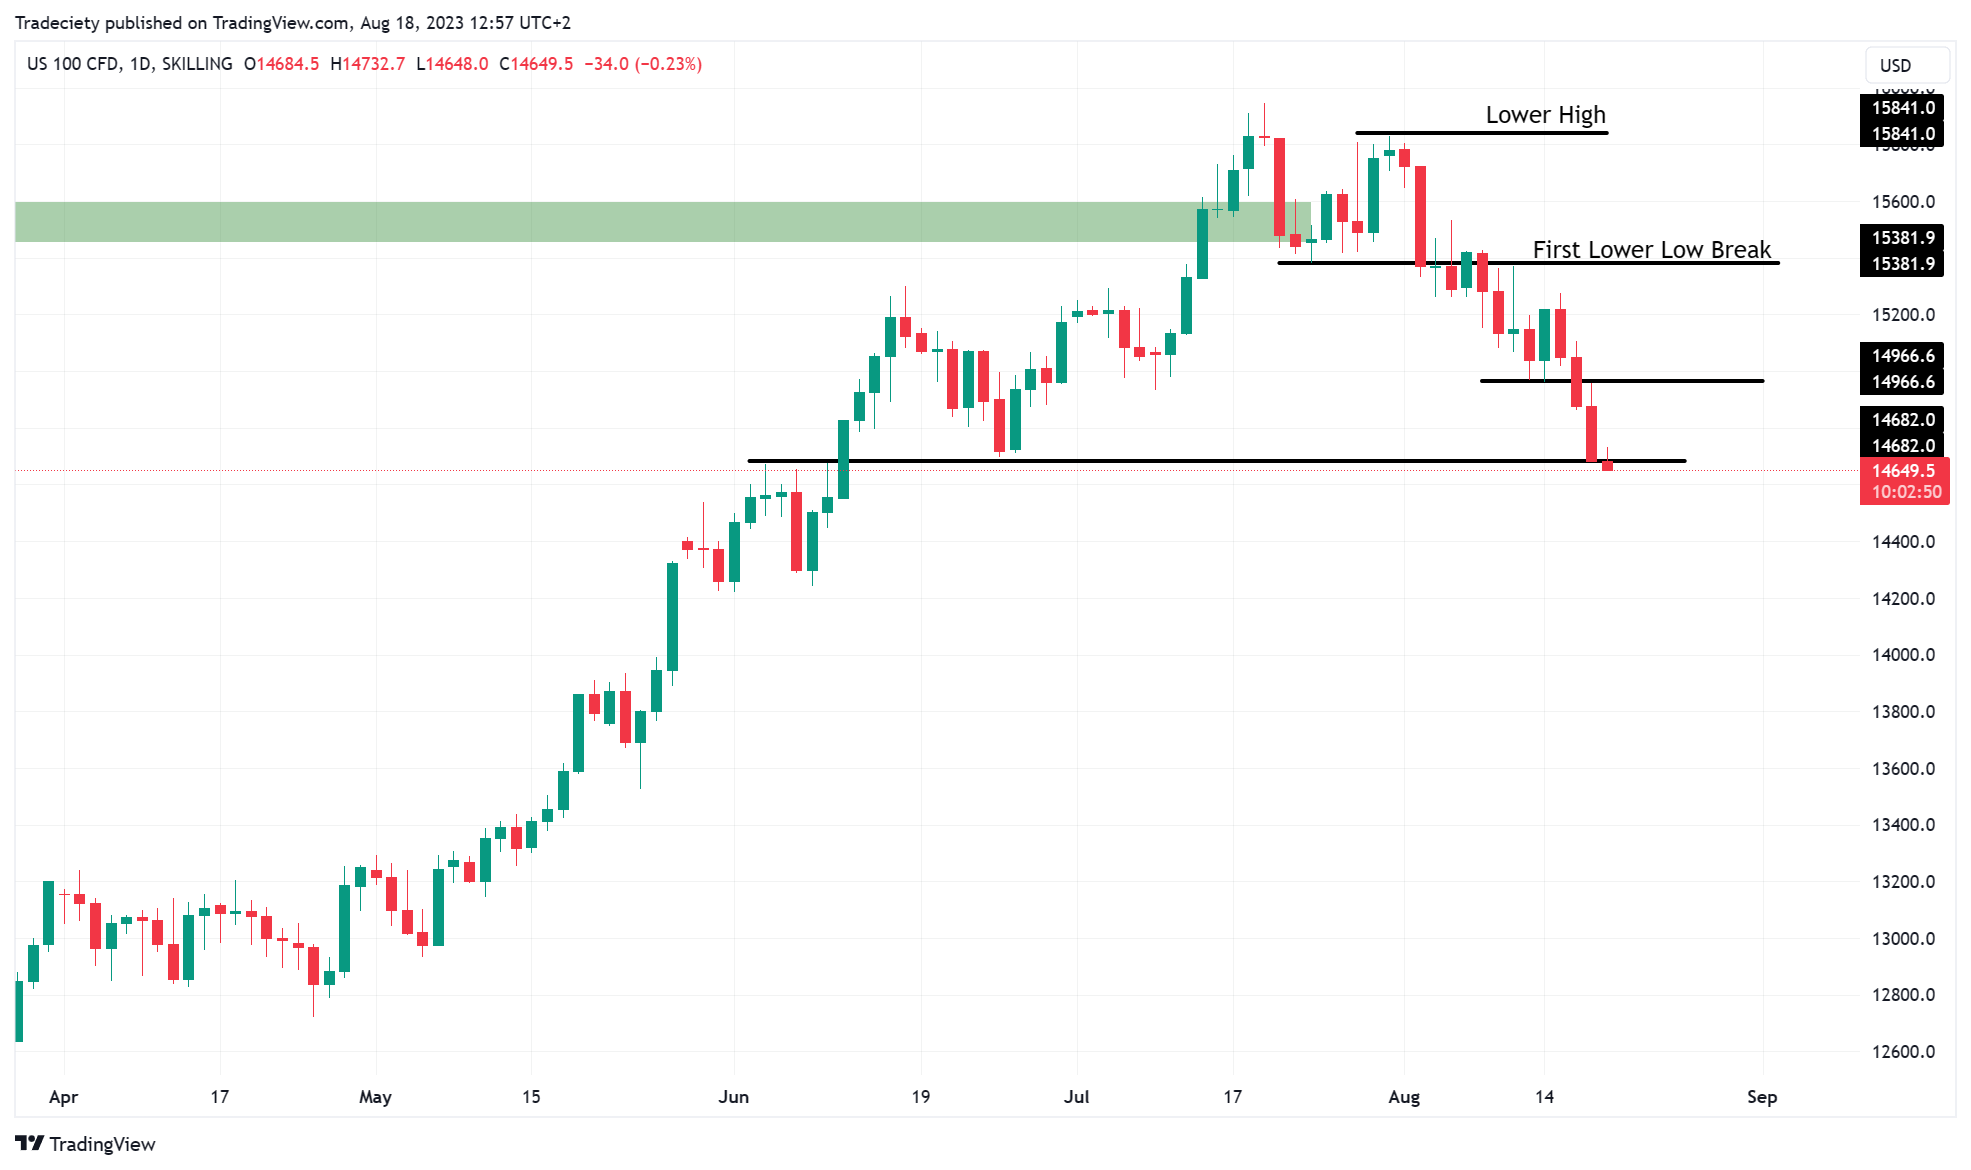
This week, we have seen a broad sell-off across the different indices. Especially the NASDAQ has lost a lot of ground because of the interest rate effects; tech stocks are generally more sensitive to changes in interest rates.
From a technical point of view, the break into new lower lows and a failure to make a higher high were strong bearish signals.
Other indices also saw strong corrections this week.
During times with high-interest rates, investors are looking for alternative investments, that are less risky than stocks, such as bonds.
Higher rates also mean more pressure for companies since interest rate payments on corporate loans are going to be higher. Furthermore, consumer spending is likely to go down because consumers may choose to save more instead of making new purchases.
Especially the housing sector has historically been under pressure during high-interest rate periods since mortgages are going to be more expensive and people may choose to delay purchasing a new home.
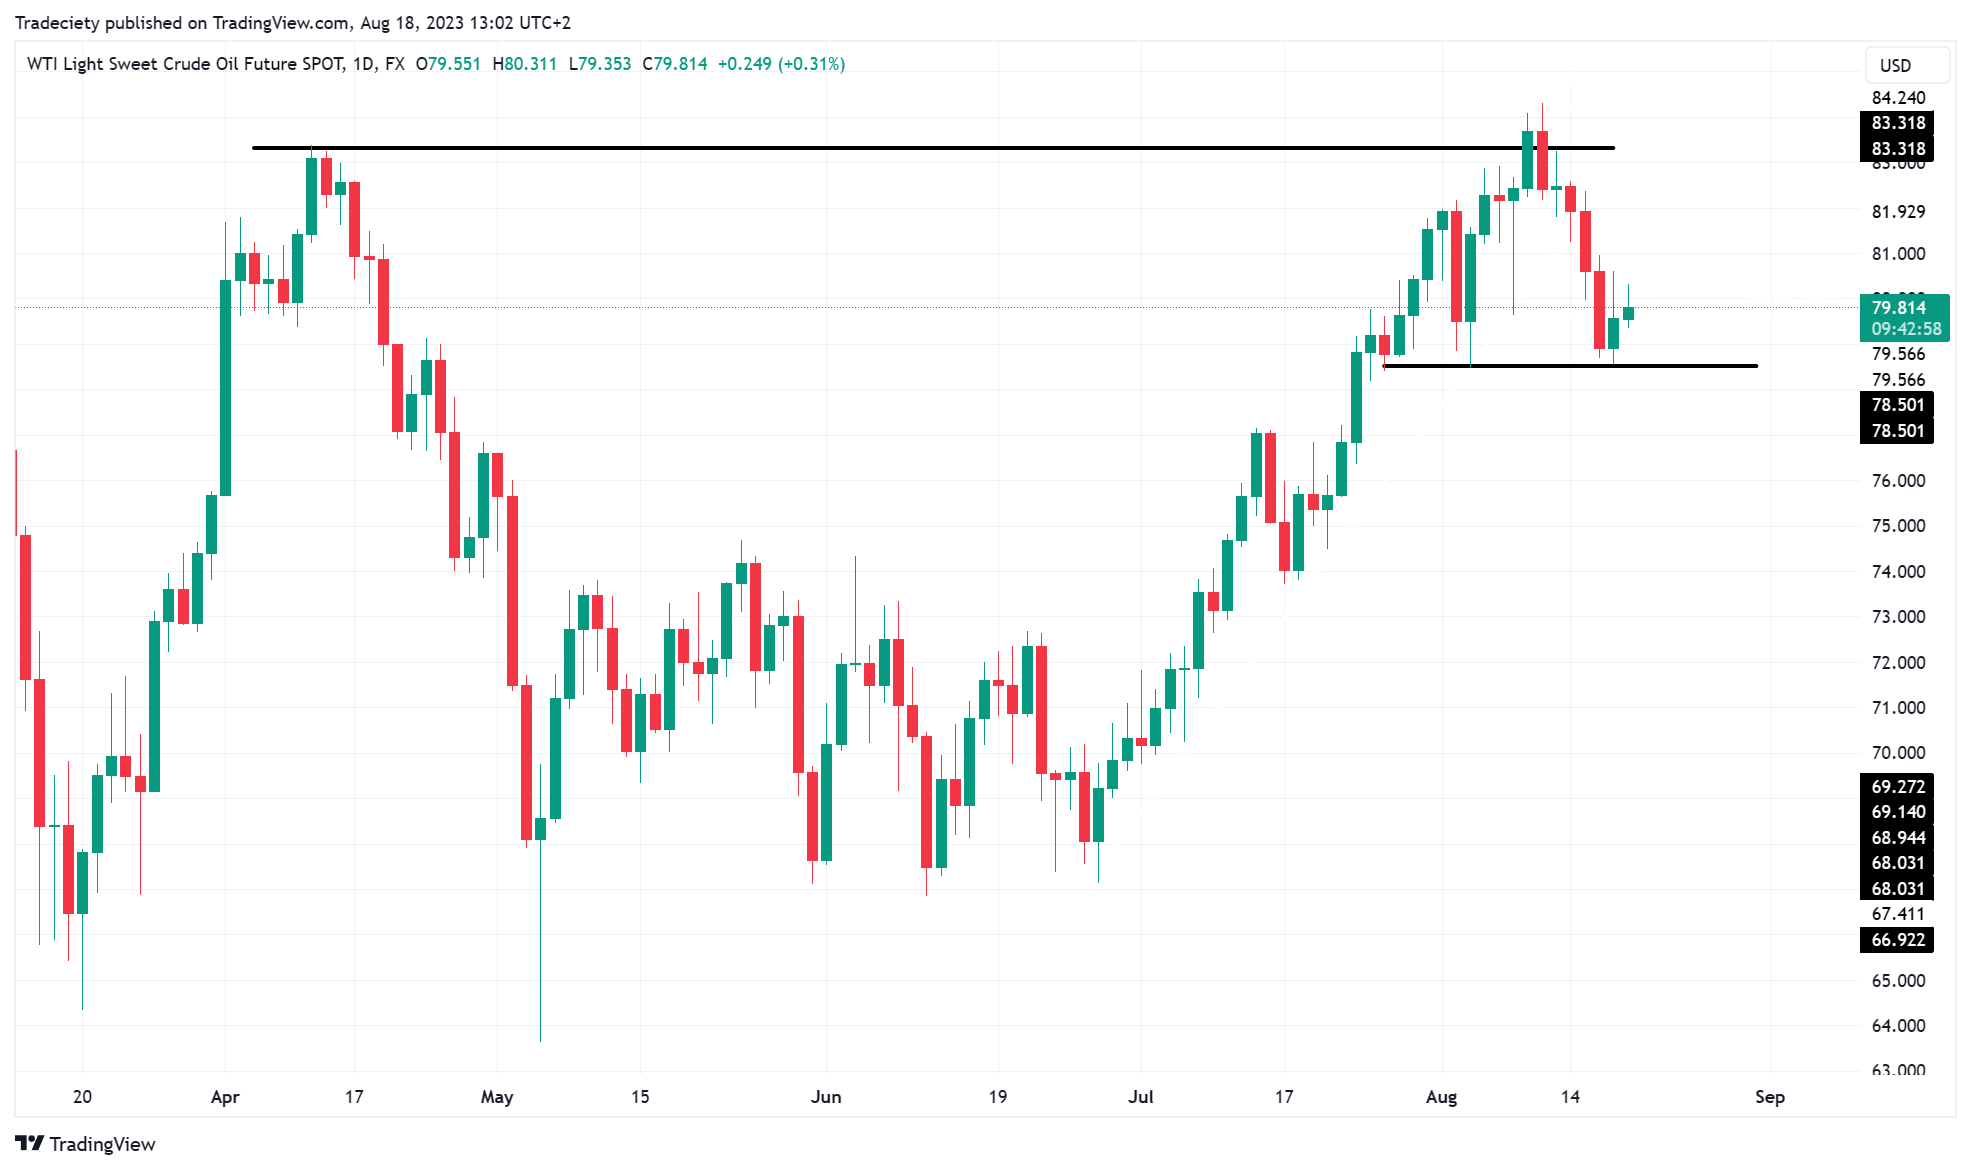
The price of oil is driven by supply and demand and whereas the supply side is trying to keep the price of oil up with production cuts, the demand side could see a drop going forward when the economy is expected to slow down. It will be interesting to see how the balance between the supply and demand side will manifest in oil.
So far, this week saw a sell-off in oil after the engulfing candlestick pattern which the price formed last week at the major resistance level at 83.3
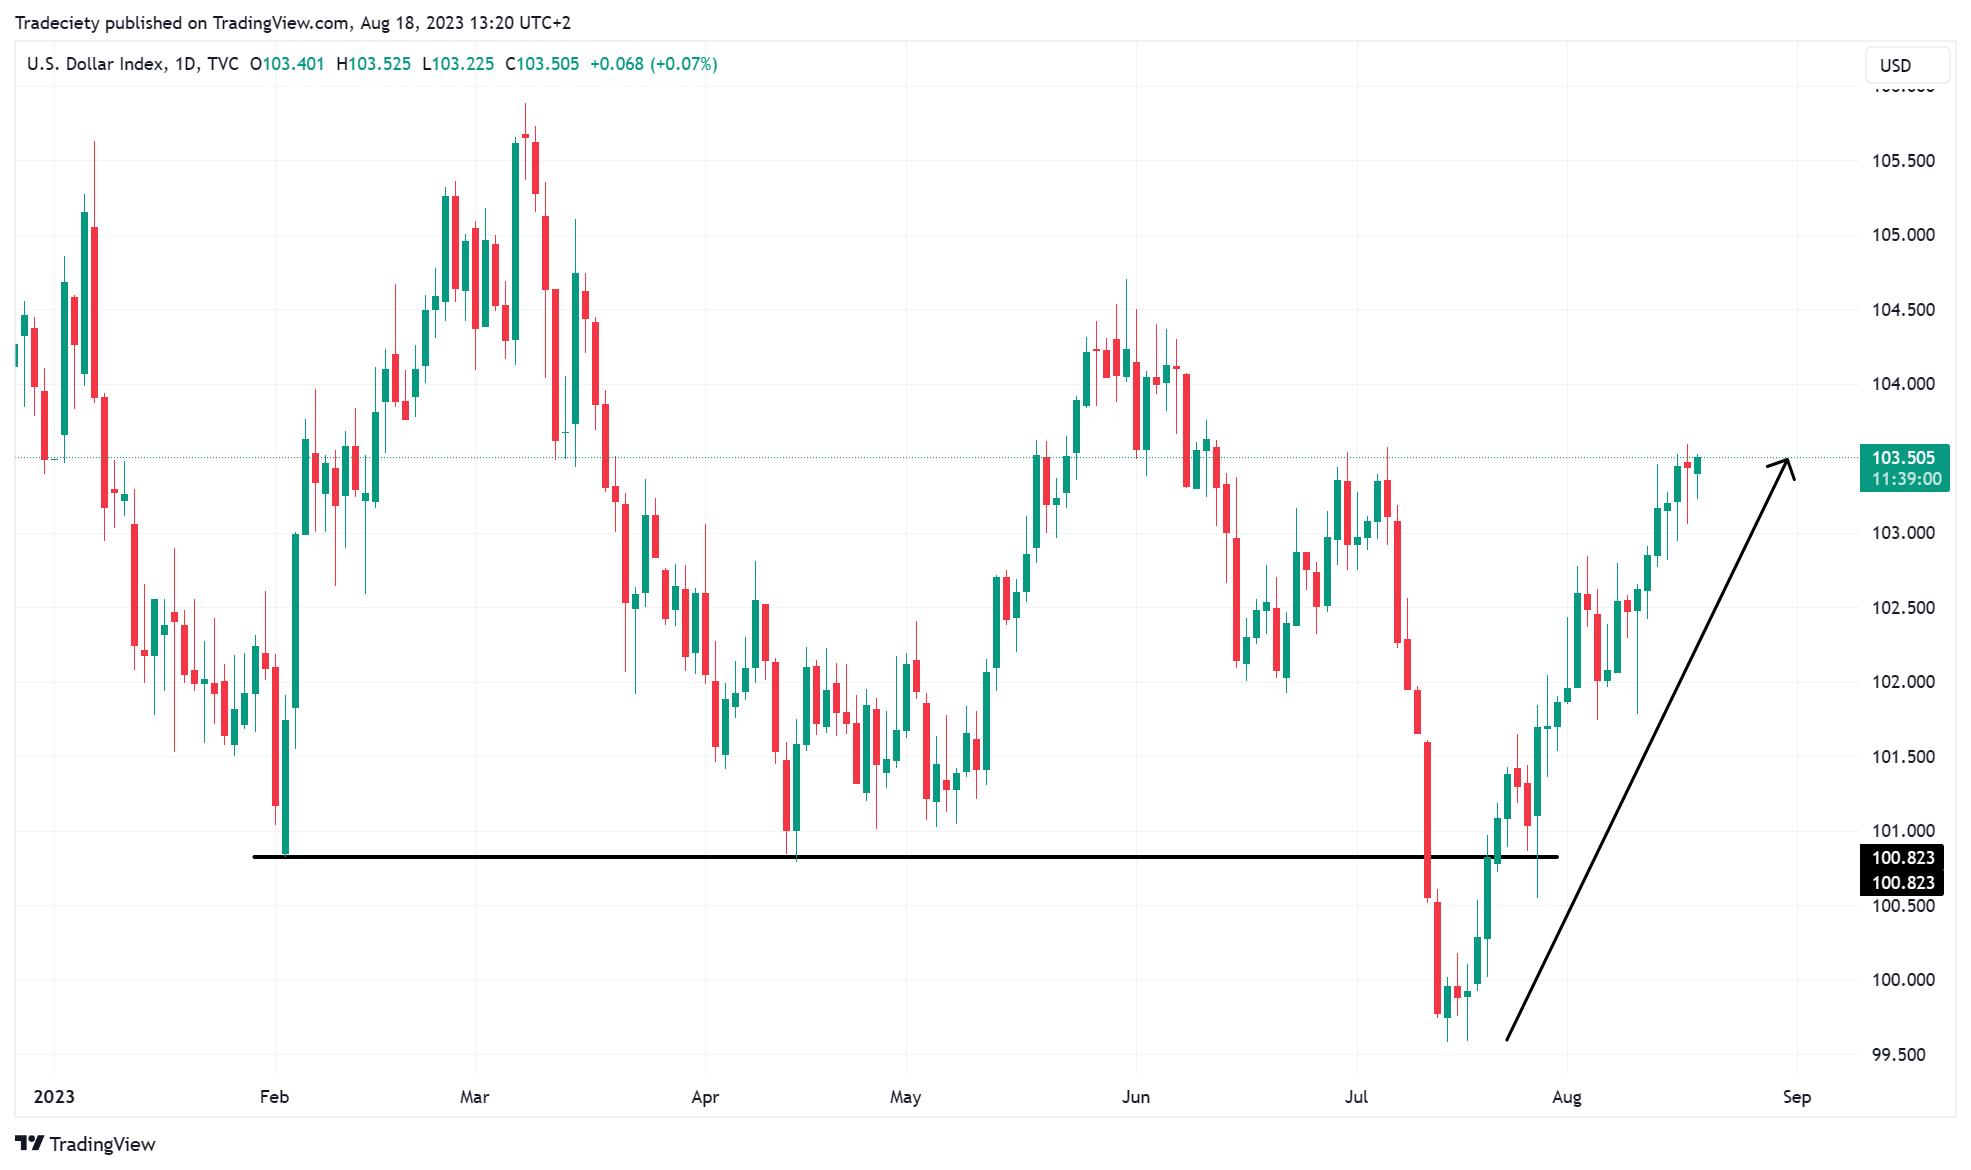
Higher interest rates also typically lead to a higher US-Dollar price. Higher rates attract more foreign capital since investors expect a higher return. Especially the EUR/USD, AUD/USD, and NZD/USD saw strong bearish moves over the last weeks due to the rising Dollar strength.
Interest rates are among the main drivers for a wide variety of asset classes as we have seen. It, therefore, might pay off to start paying attention to the overall sentiment around interest rate developments.

external link:


We have been trading supply and demand strategies for over ten years, and they have stood the test of time remarkably well. Supply and demand is...

3 min read
Choosing the right trading journal is essential for traders wanting to analyze performance, refine strategies, and improve consistency. In this...

3 min read
“95% of all traders fail” is the most commonly used trading related statistic around the internet. But no research paper exists that proves this...