
Supply and Demand Trading in 2026
We have been trading supply and demand strategies for over ten years, and they have stood the test of time remarkably well. Supply and demand is...
This week saw a lot of volatility in the markets due to inflation data which made it hard to find long-term momentum plays. Therefore, traders would have done better focusing on short-term trading opportunities in the lower timeframes.
For this week´s chart of the week edition, I picked two interesting lower timeframe case studies. And at the end, I am including two interesting charts to watch going forward.
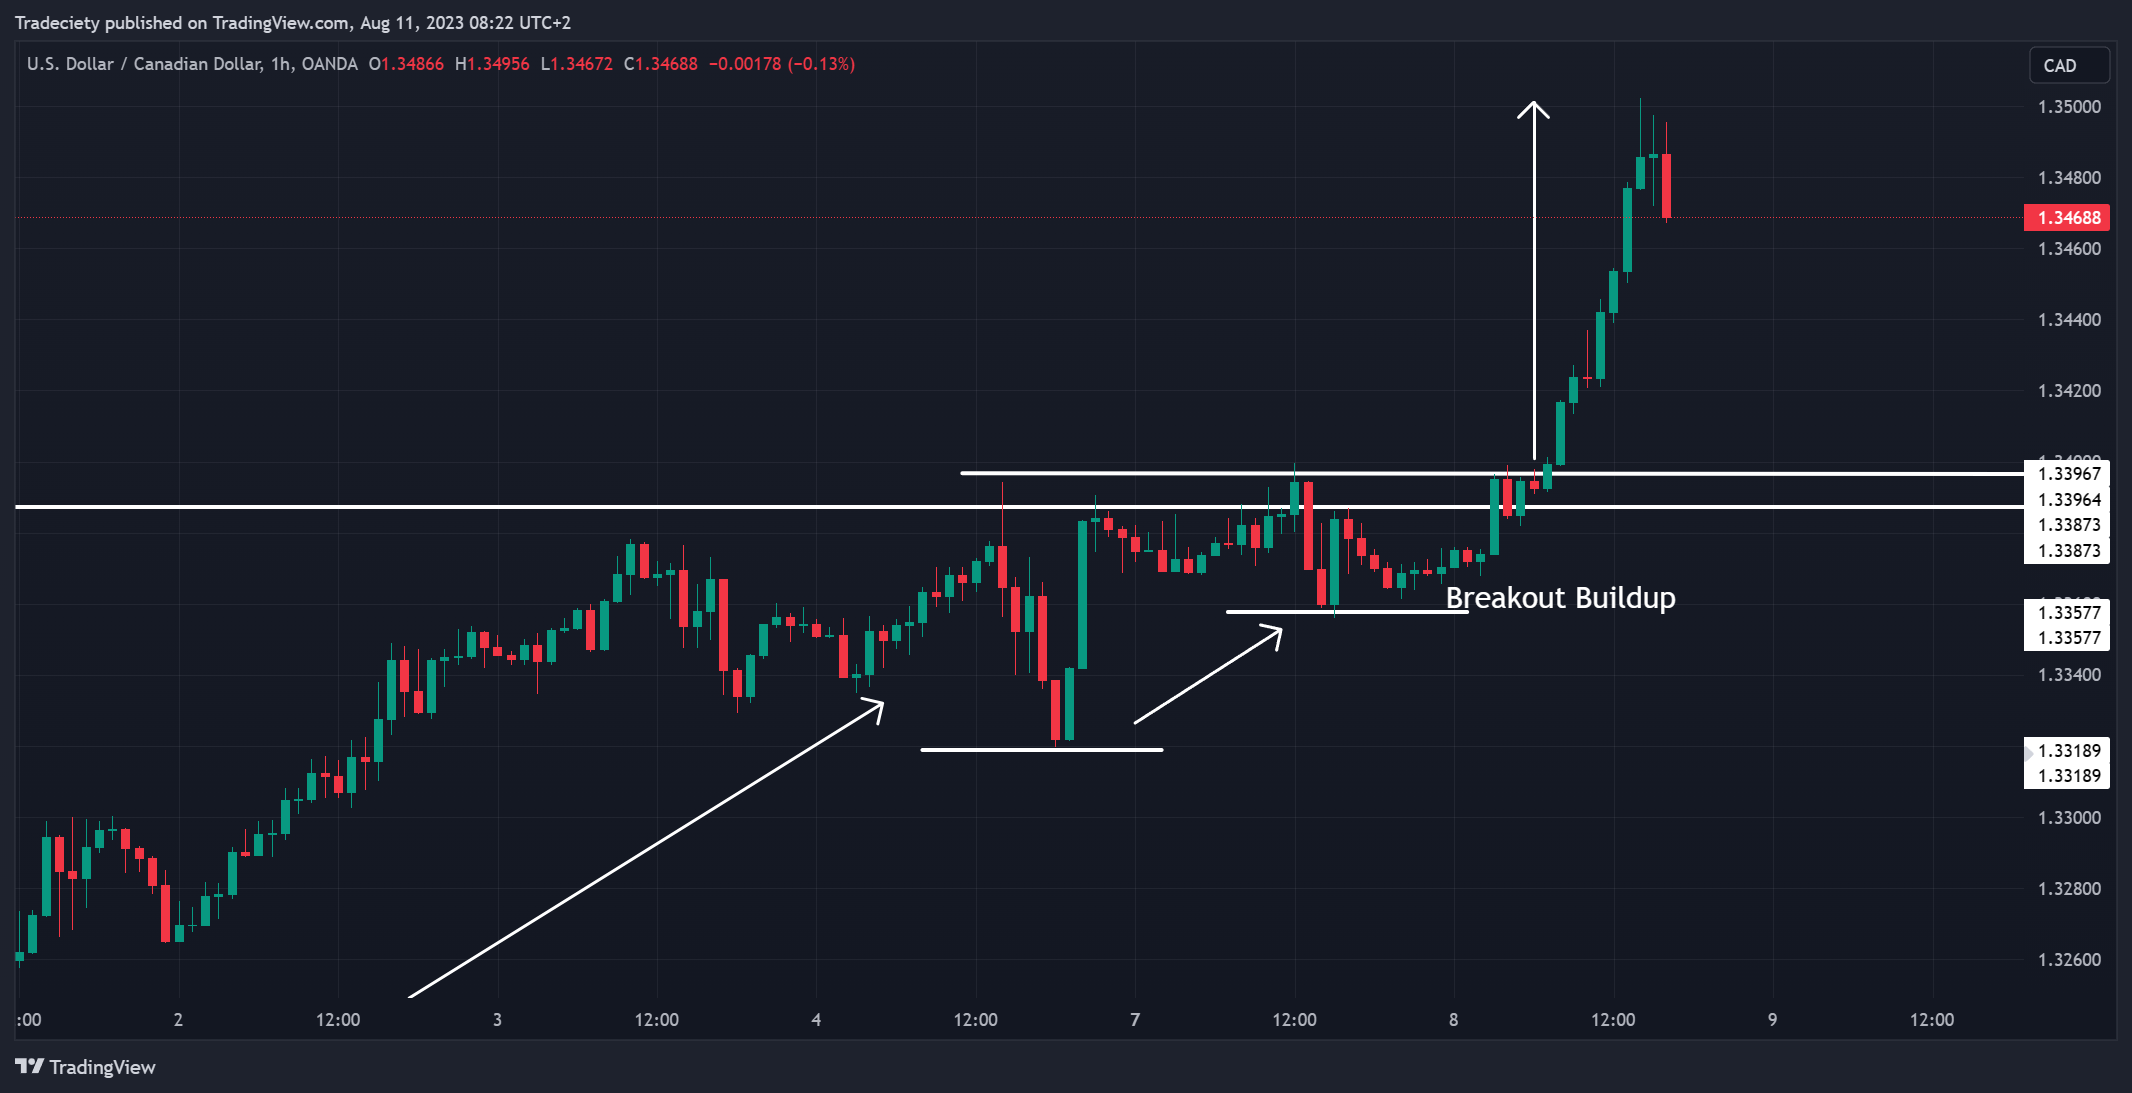
Let us start with the USD/CAD which showed a great breakout pattern earlier in the week. The 1H timeframe below shows an optimal breakout sequence.
The market has been in an overall uptrend providing an overall bullish sentiment to the charts. As we will see in the next screenshot, the market traded back into a long-term resistance level and this lower timeframe shows the breakout buildup pattern. Within a breakout buildup, the price keeps pushing into a resistance sooner and sooner, exhibiting strong bullish interest. The pressure that is released after such tight consolidations is often significant as we can witness here as well.
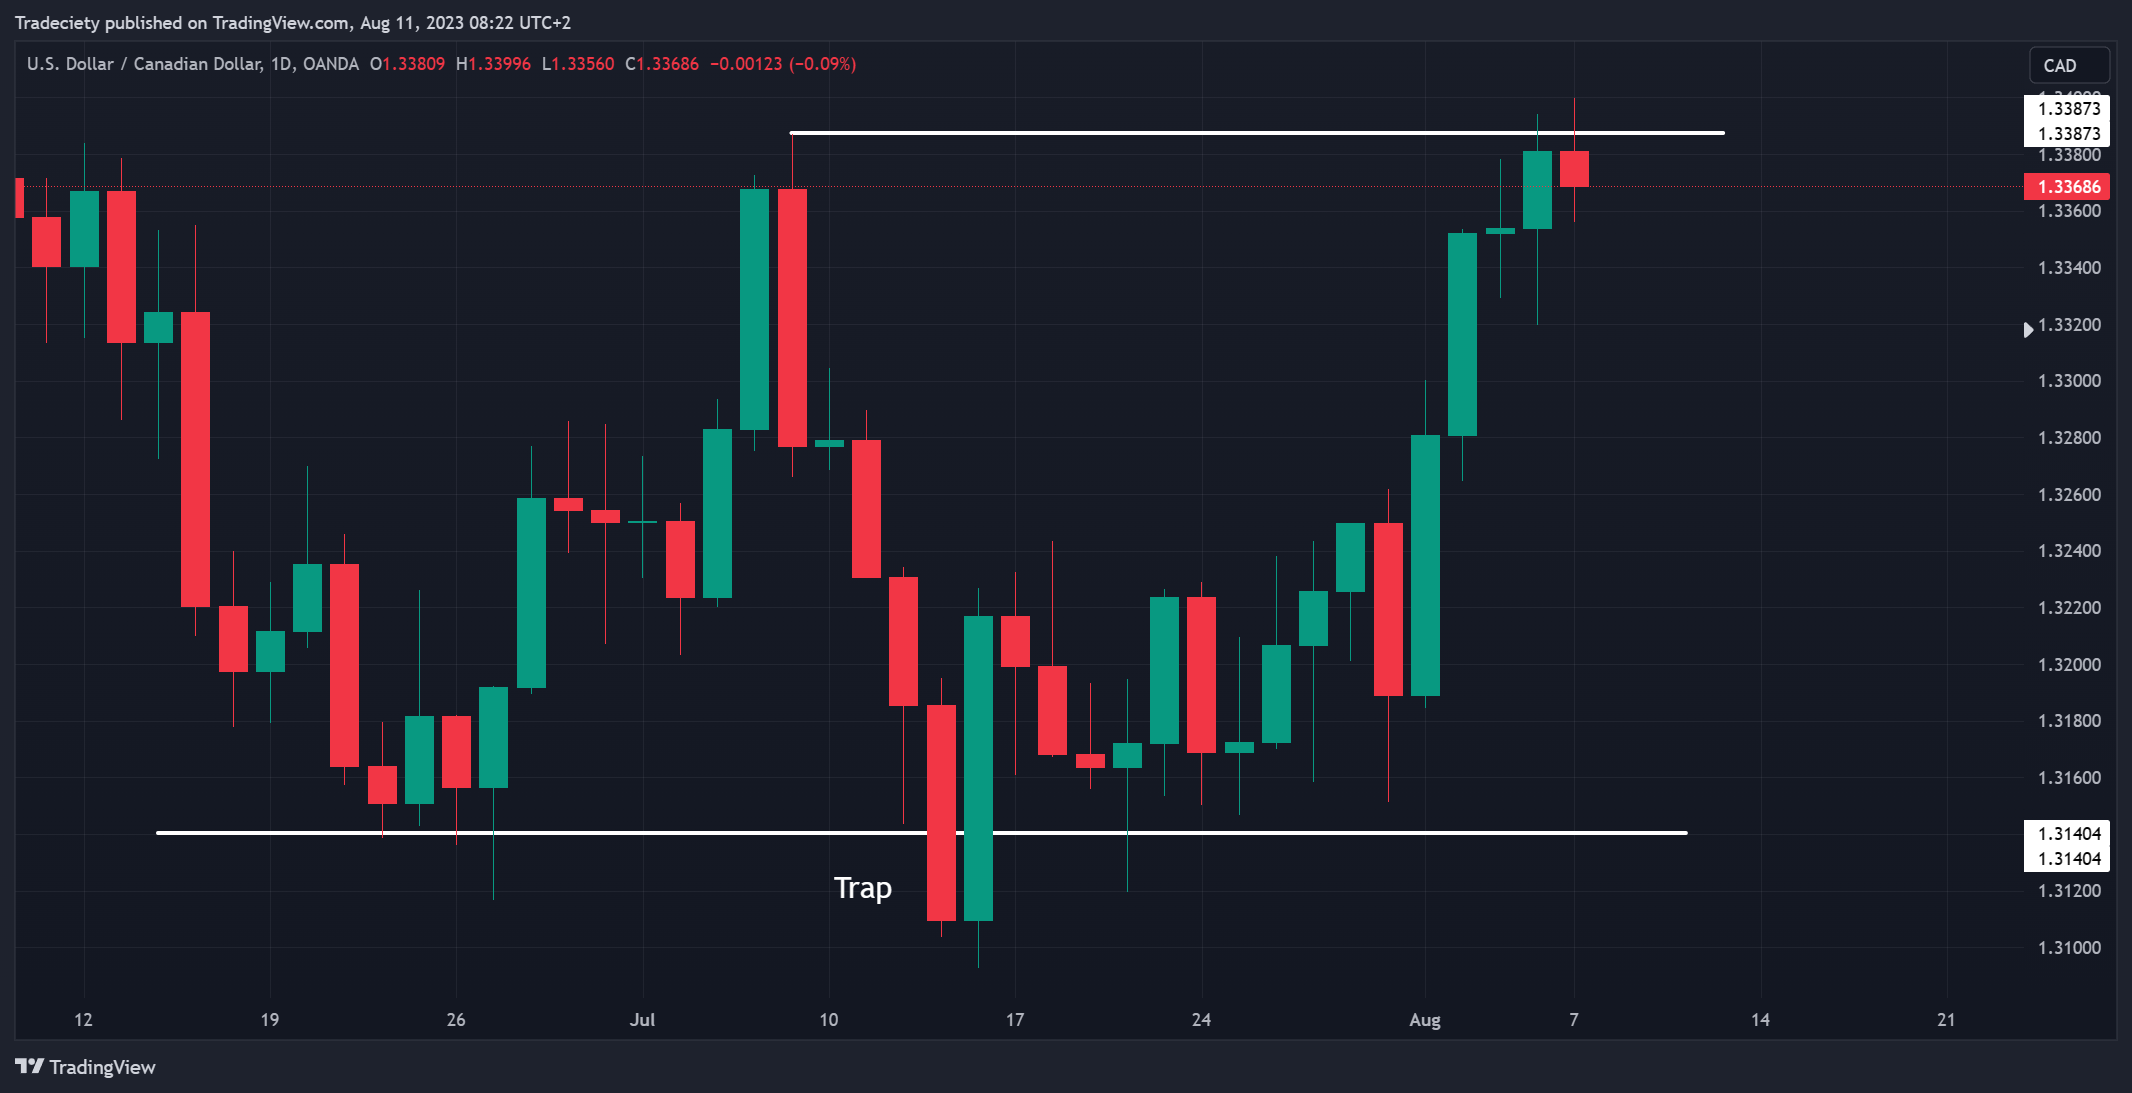
The screenshot below shows the higher timeframe pre-breakout. The price traded strongly into the previous resistance and then started stalling underneath it. The daily candlesticks formed long wicks to the downside, which are the dips that we have marked in the lower timeframe screenshot above.
Many amateur traders make the mistake of trying to short resistance levels too early. It is important to remember that the price has been trending higher recently and bullish continuations are often likely.
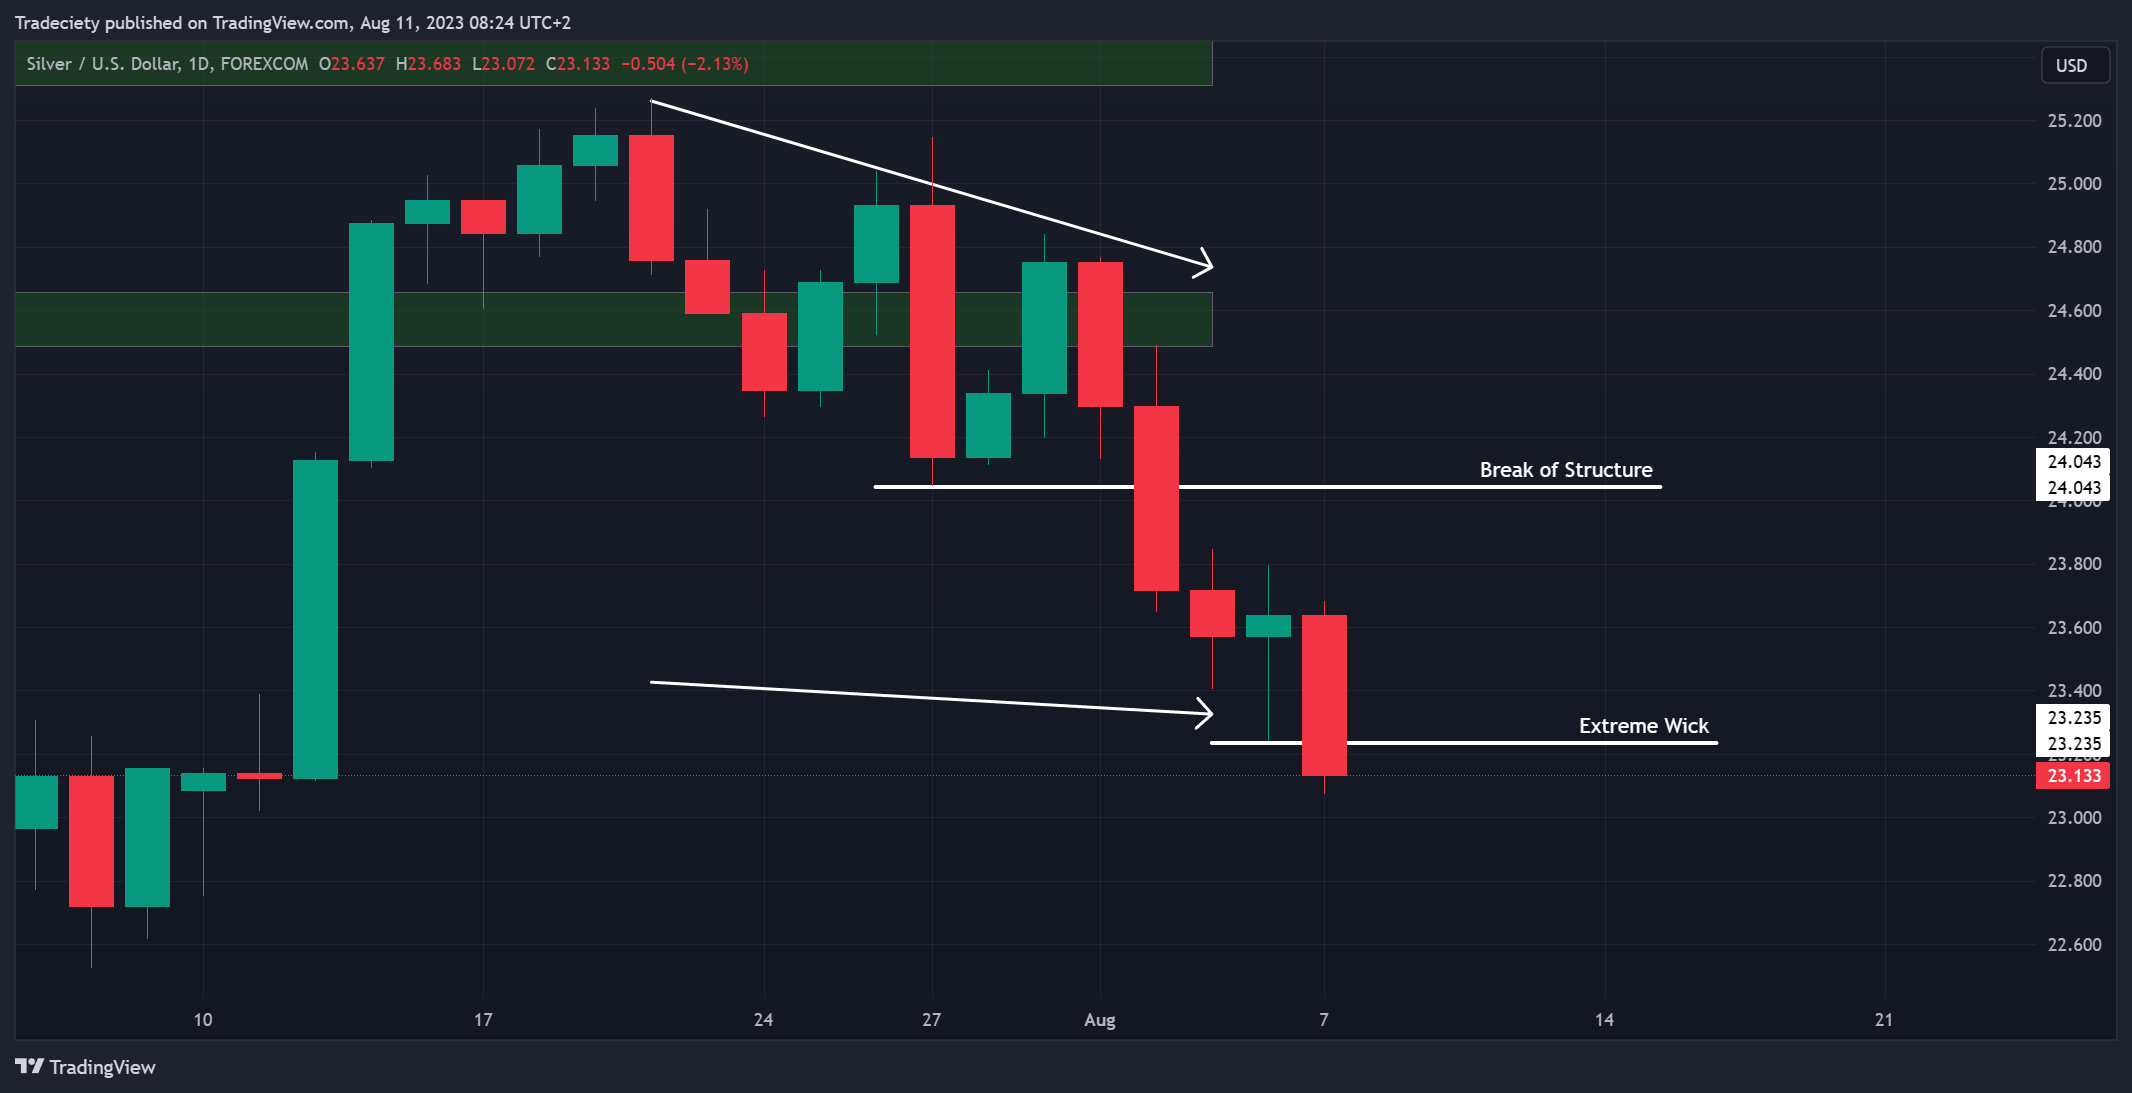
With silver, I want to start the chart analysis on the higher timeframe and we can observe a great downtrending price structure here.
First, the price broke out of the distribution top and the high momentum breakout occurred at the "Break of Structure"; this started the initial bearish move.
On the next consolidation, the price formed a strong pinbar (green candle). Many traders easily get scared out of their trades because of wicks. However, pinbars are not necessarily a reversal candlestick pattern and it all depends on the next candle. A good rule of thumb here is: you do not trade the pinbar, but the reaction to the pinbar.
The next candlestick is able to take out the low of the pinbar candlestick wick which is a high momentum signal. Some traders refer to this pattern as "eating the wick".
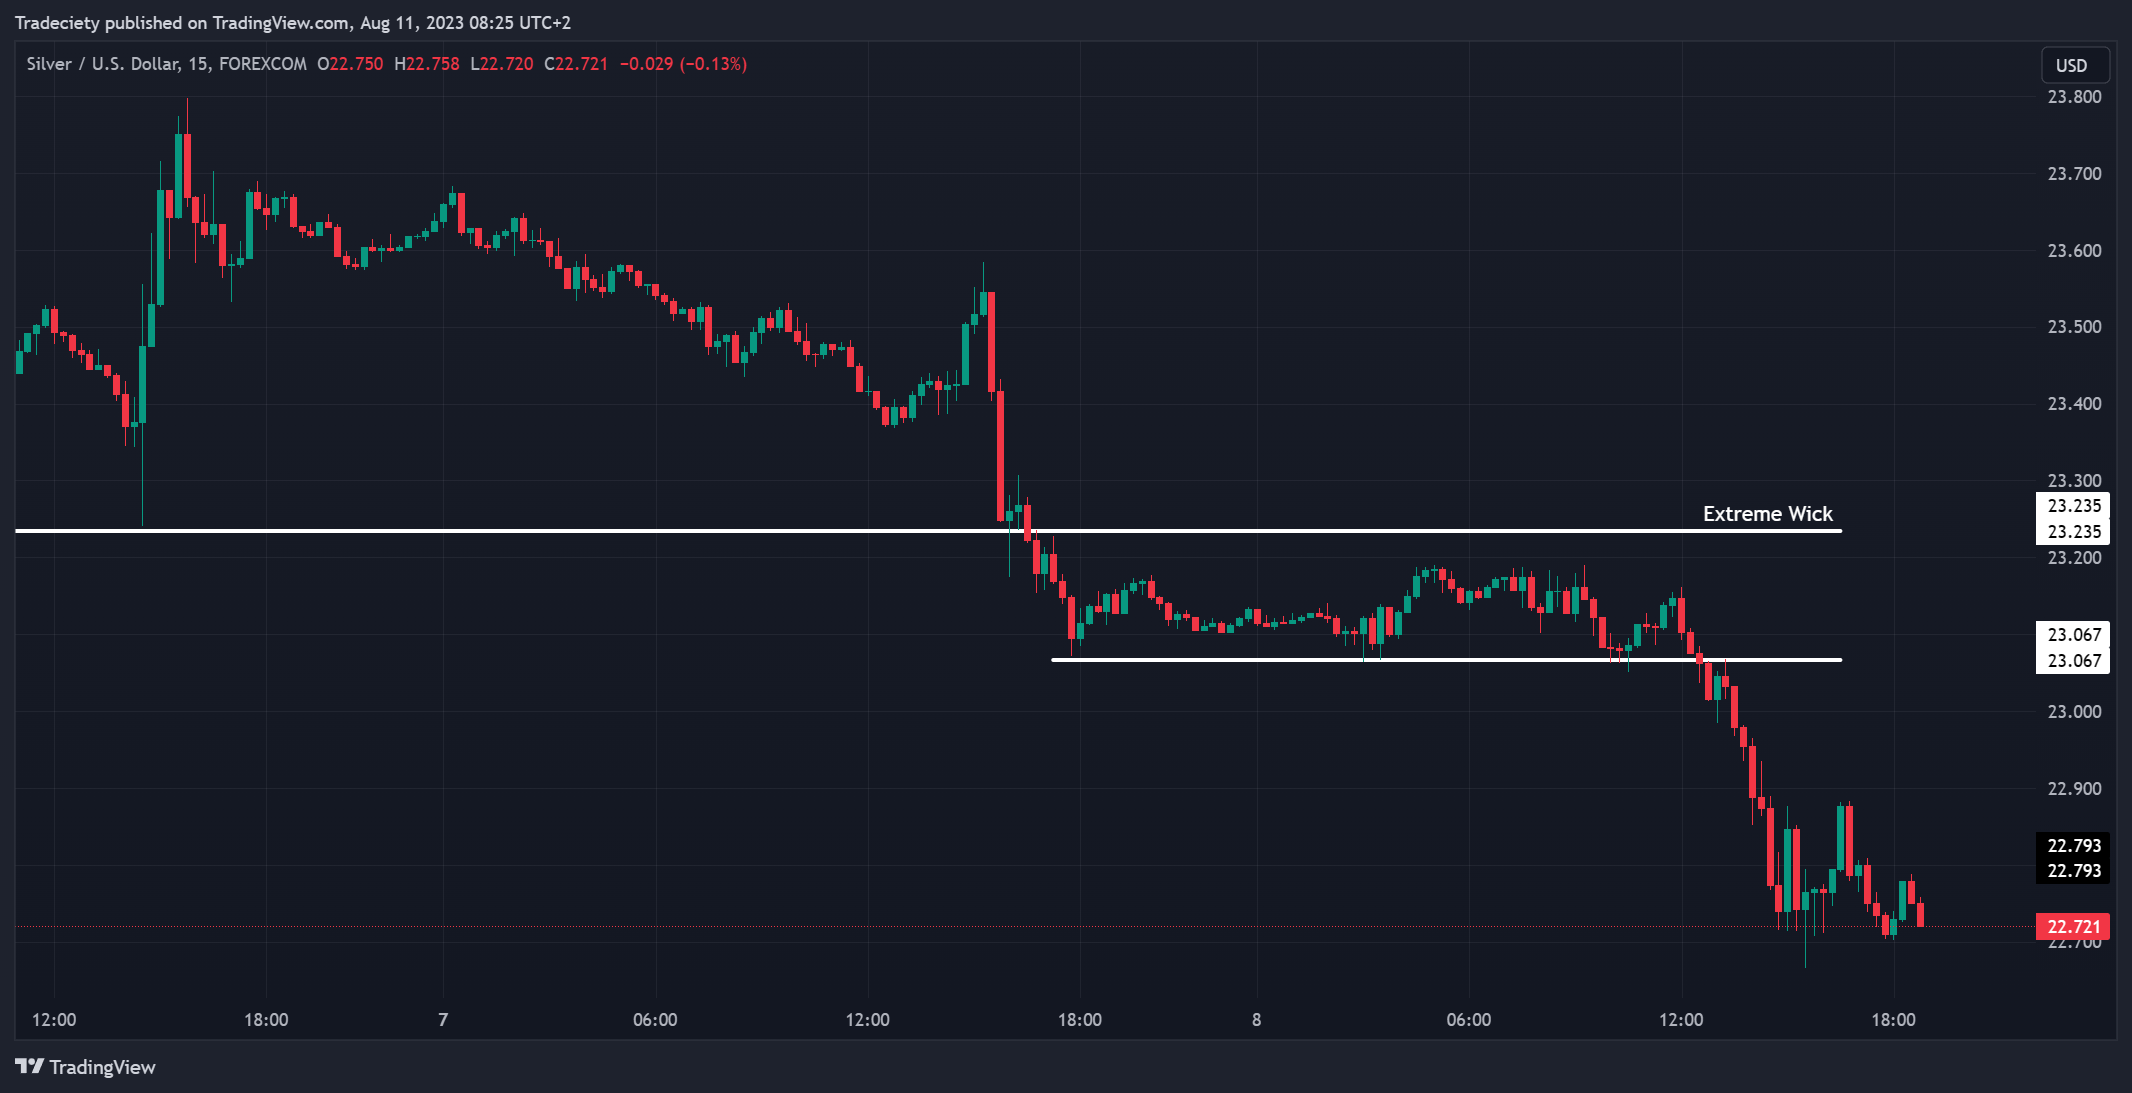
Once the price broke the daily pinbar wick, there was a short consolidation on the lower timeframe. And upon the break of the consolidation support, the downtrend continued.
Looking for pinbars that get taken out can be a great foundation for a trend-following strategy.
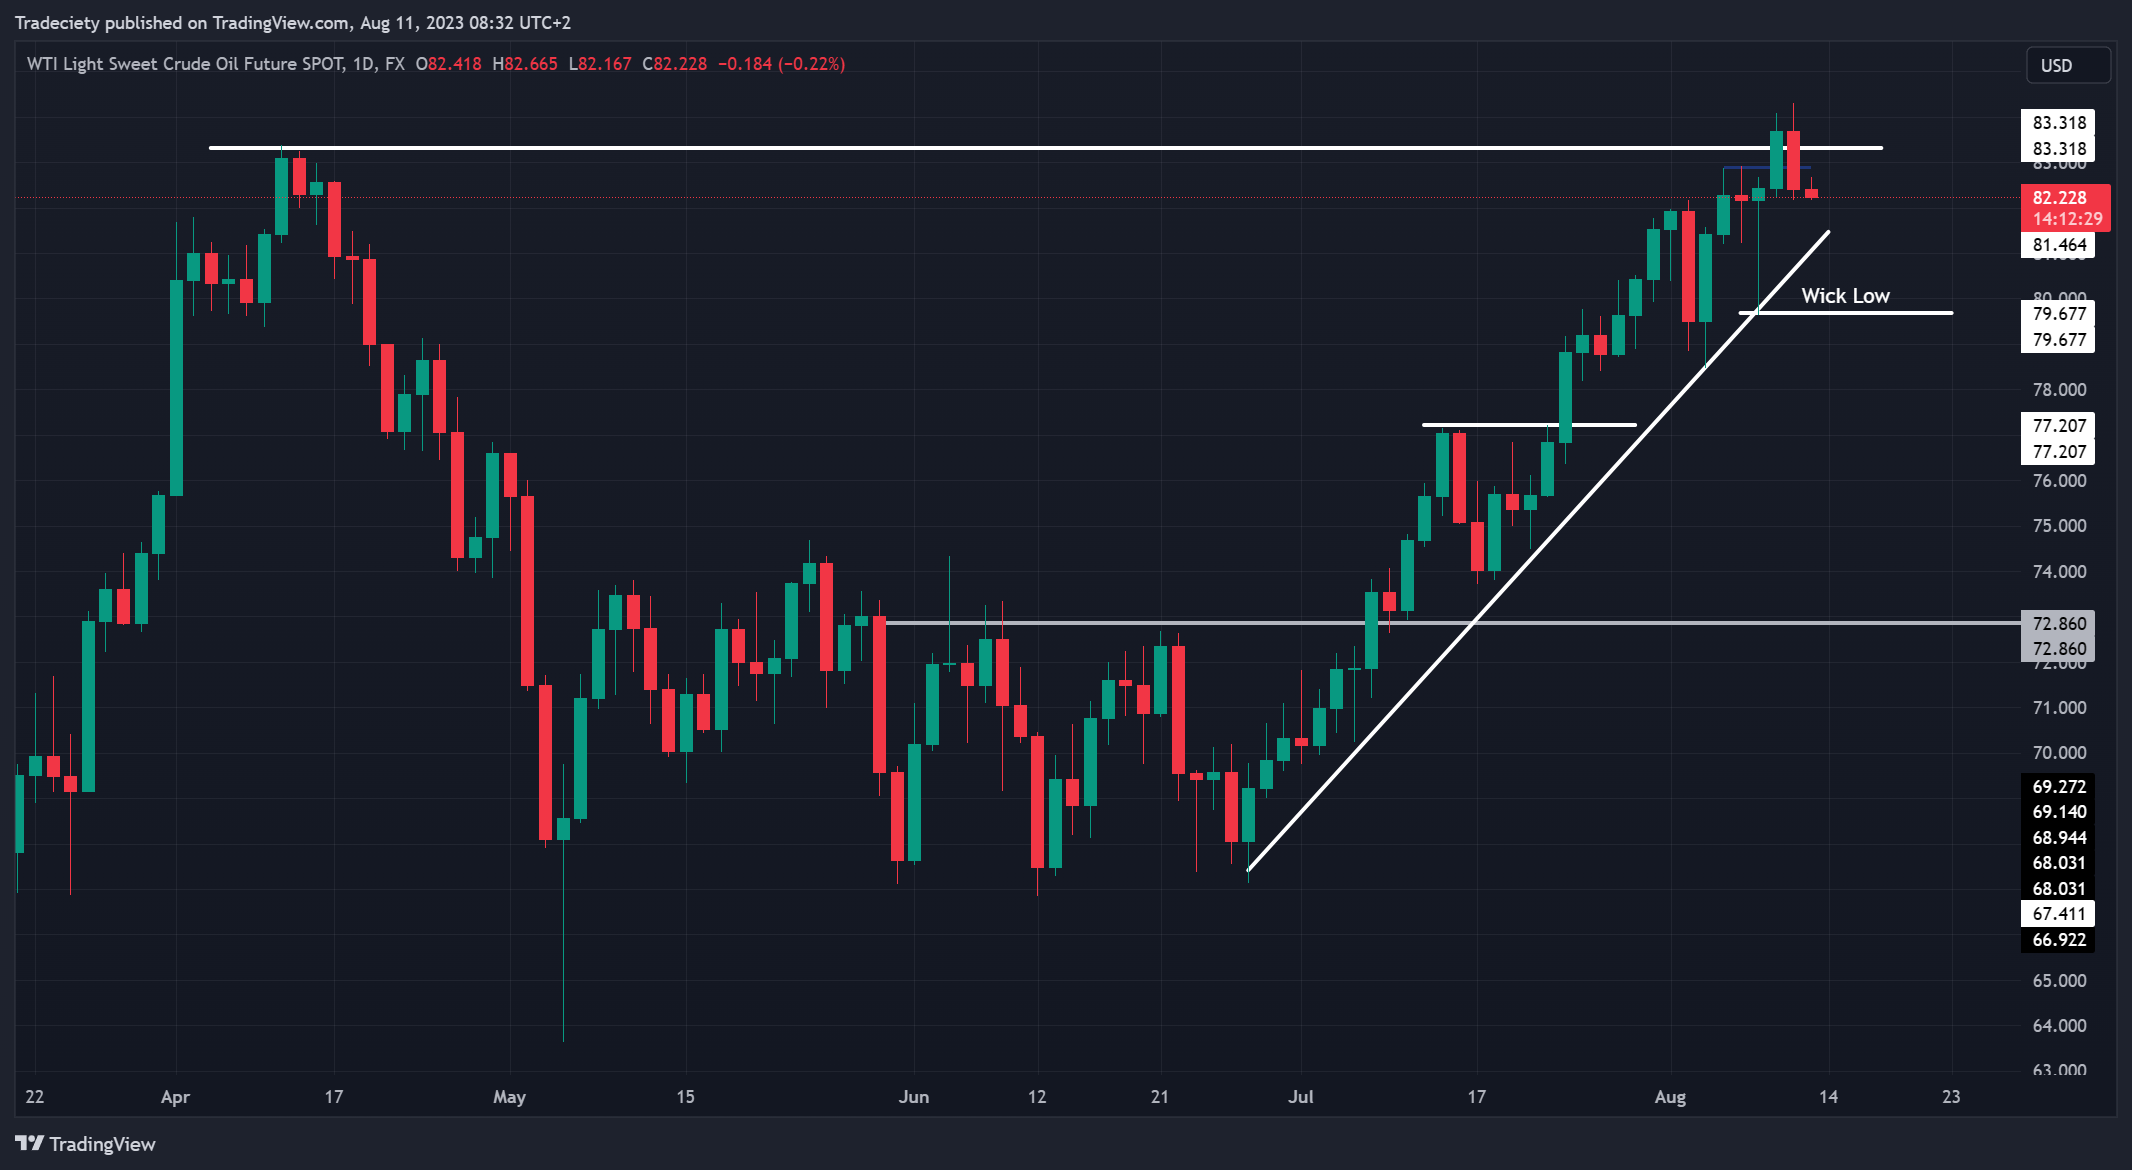
First is oil. The recent bullish trend brought oil back into the resistance at around 83.3. Observing price movements around such key levels is always interesting and might provide trading opportunities as we have seen with the two chart studies above.
At this point, it is impossible to say how the market will react to the resistance. You can create a bullish trading plan and wait for the market to take out the recent high. Or, for a bearish trading plan, you would typically wait for the price to "eat the wick" of the large daily pinbar.
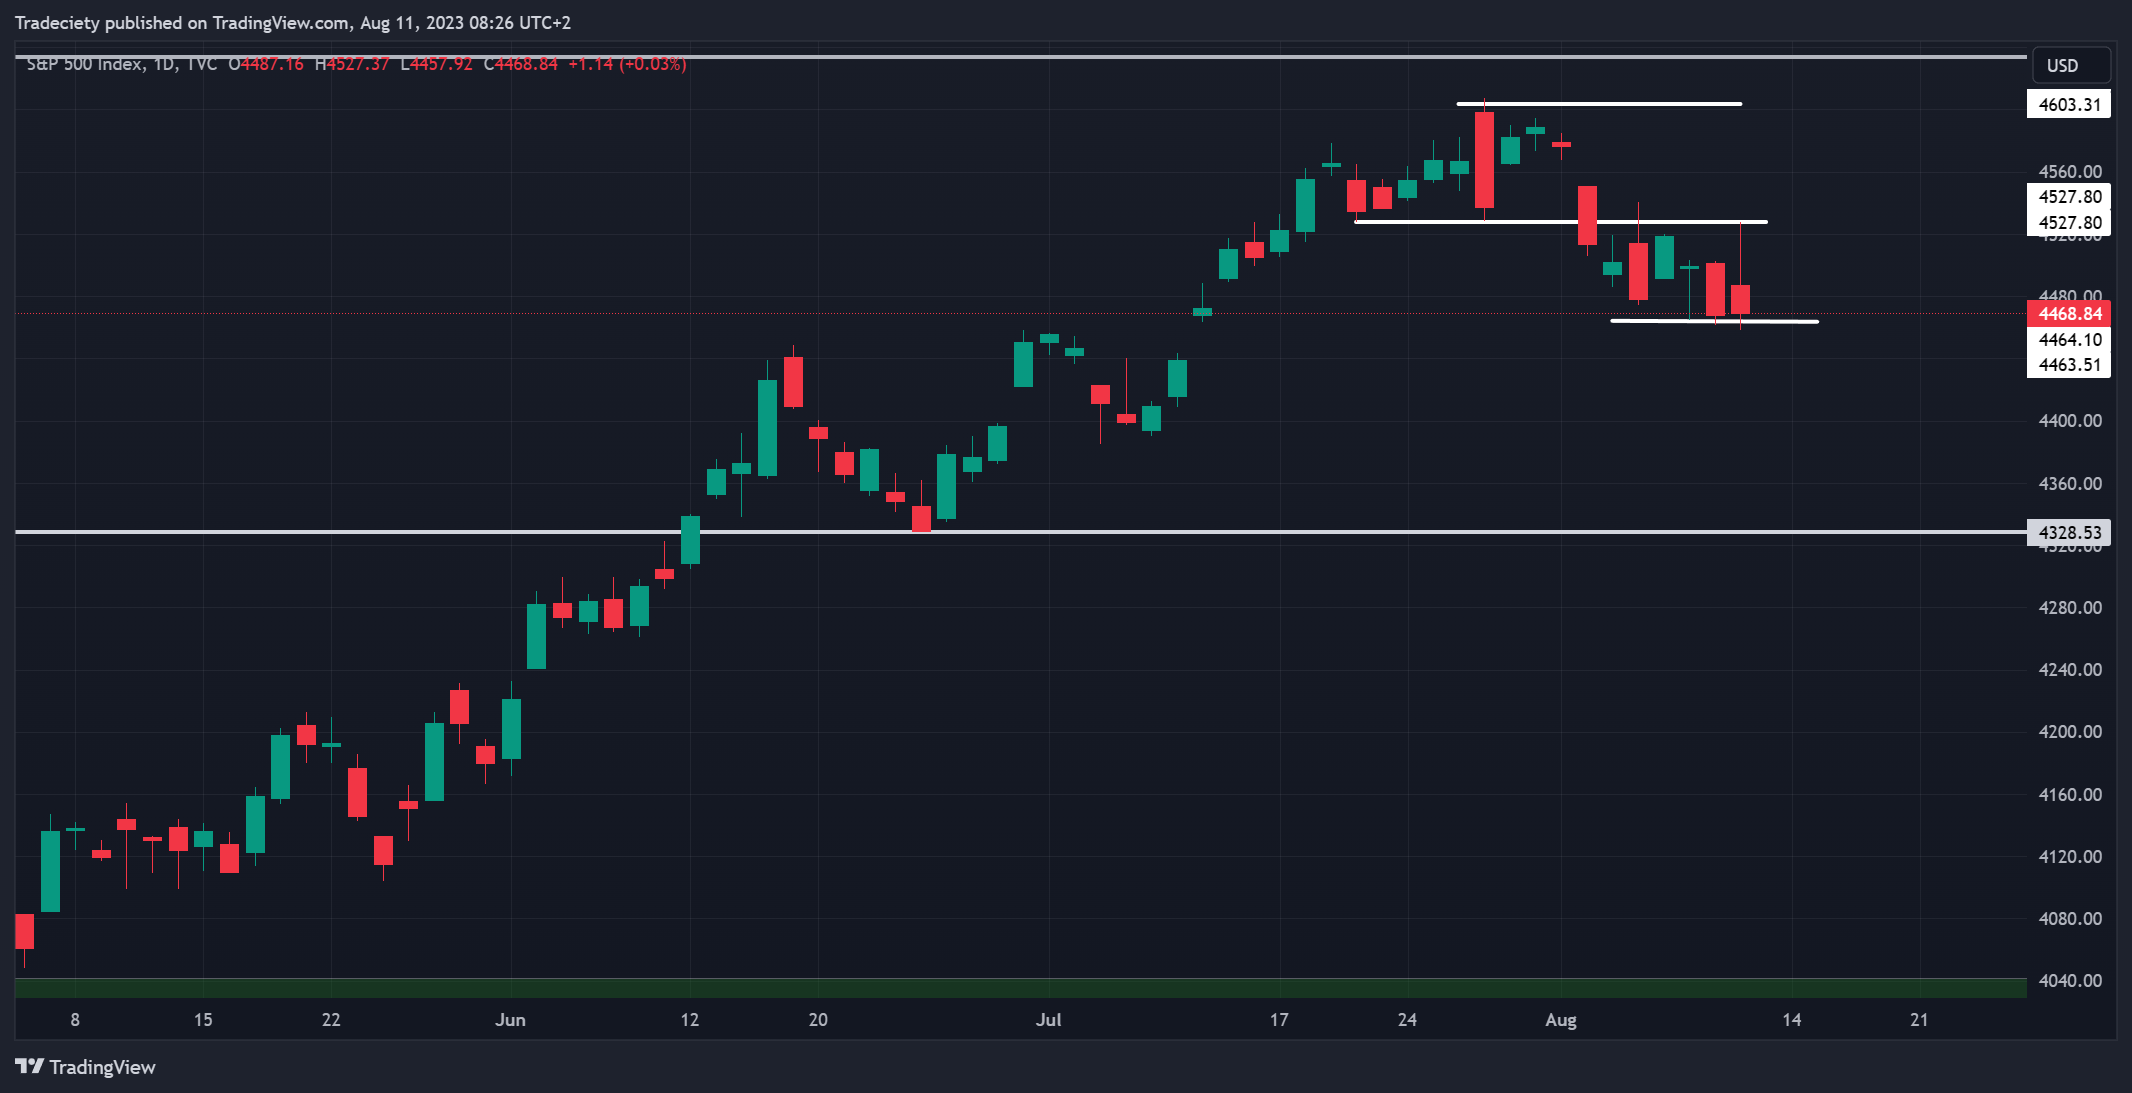
Next is the S&P 500. The price action started to show increasing signs of bearishness over the last two weeks. With lower inflation data, one could have assumed that traders might turn bullish again because of a lower likelihood of additional rate hikes. However, the reaction so far was modest. Bulls are waiting for pullback scenarios and bears are carefully looking at how the price is trading into new lows when support levels are being broken. Indices overall provide very interesting charting situations these days.
Come back next Friday for a new chart of the week article. In the meantime, you can head over to our YouTube channel where I release multiple new trading videos every week: Tradeciety on YouTube
Alternatively, check out our new Best of Tradeciety section with our most popular trading articles: Best of Tradeciety
external link:


We have been trading supply and demand strategies for over ten years, and they have stood the test of time remarkably well. Supply and demand is...

3 min read
Choosing the right trading journal is essential for traders wanting to analyze performance, refine strategies, and improve consistency. In this...

3 min read
“95% of all traders fail” is the most commonly used trading related statistic around the internet. But no research paper exists that proves this...