Supply and Demand Trading in 2026
We have been trading supply and demand strategies for over ten years, and they have stood the test of time remarkably well. Supply and demand is...

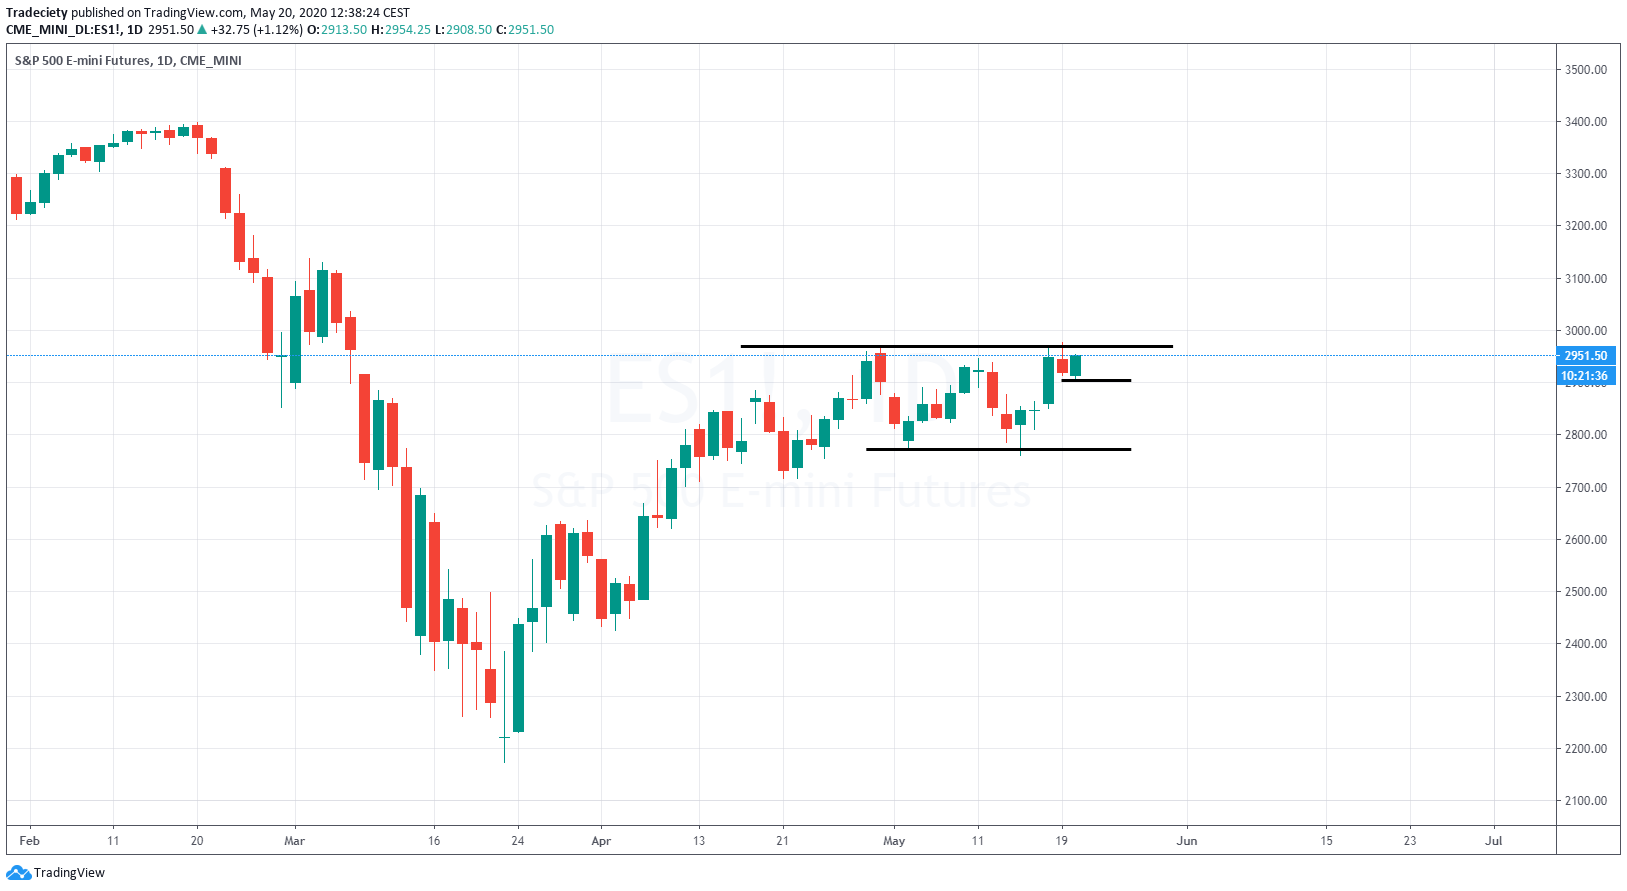
The S&P500 is trading at a key resistance level.
The price initially pushed strongly into 3000 but has failed to gain enough momentum to break through the level.
Monday was a small bearish day and Tuesday showed a small rally after rumors for a potential vaccine came up.
A breakout above the 3000 level will make the current pattern look like a buildup. When the price fails to break higher, the price may see another bearish correction into the range lows.
Sentiment feels more bullish and the Put-Call ratio is currently at a very low level which could further indicate bullishness. Bears certainly have a harder time.

We have been trading supply and demand strategies for over ten years, and they have stood the test of time remarkably well. Supply and demand is...

3 min read
Choosing the right trading journal is essential for traders wanting to analyze performance, refine strategies, and improve consistency. In this...

3 min read
“95% of all traders fail” is the most commonly used trading related statistic around the internet. But no research paper exists that proves this...