3 min read
Scientist Discovered Why Most Traders Lose Money – 24 Surprising Statistics
“95% of all traders fail” is the most commonly used trading related statistic around the internet. But no research paper exists that proves this...

The market you’ve been following just tanked. It’s hit a new low. But now, you see a glimpse of a potential rebound. It looks like a significant decline, but still, there’s no way to guarantee that it’s the bottom you’re looking for. As you know, one of the riskiest things to do is to predict bottoms and tops. Yet getting in on a position near a bottom (going long) or a top (going short) is the only way not to miss out on a significant portion of a trend reversal – or so they believe. In this case, thinking that this might be The Bottom, what might you do?
“Bottom fishing” is a nice metaphor. And in a market context, the fish will devour you if you fall off the boat, proverbially speaking. Another metaphor describing this phenomenon is “catching a falling knife.” You don’t want to do that unless you’re a longer-term investor who doesn’t mind getting nicked here and there amid a dollar-cost-averaging strategy.
But as a trader, you want your long entries to be tight and precise. And that’s what “bottom fishing” is all about. So, that’s what we’ll cover–a sound method for catching a market when it appears to be bottoming out.
The Bottom Fishing method is geared toward the long side of a trade. It works best when the longer-term trend is up, meaning that it can work exceptionally well after pullbacks or major corrections.
When bottom fishing, we’re looking for a certain type of Double Bottom.
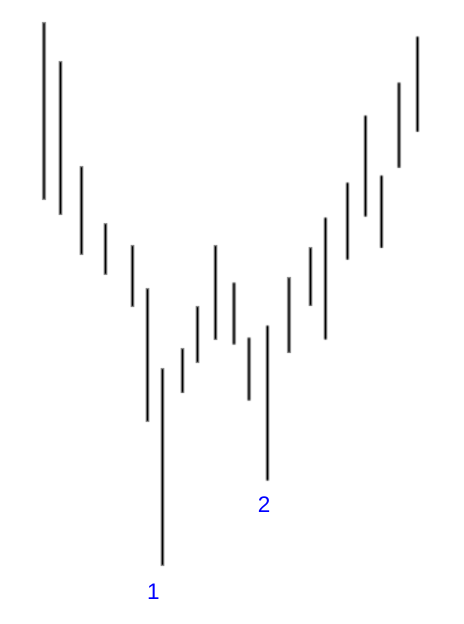
The rationale behind bottom fishing is that the lows in a declining market are failing to break lower. The second “retest” of the low is failing to match the level of the first swing low. So, you end up with a W in which the second low is higher. What it means is that sellers are beginning to drop out, and buyers may be entering the market, possibly reversing the trend.
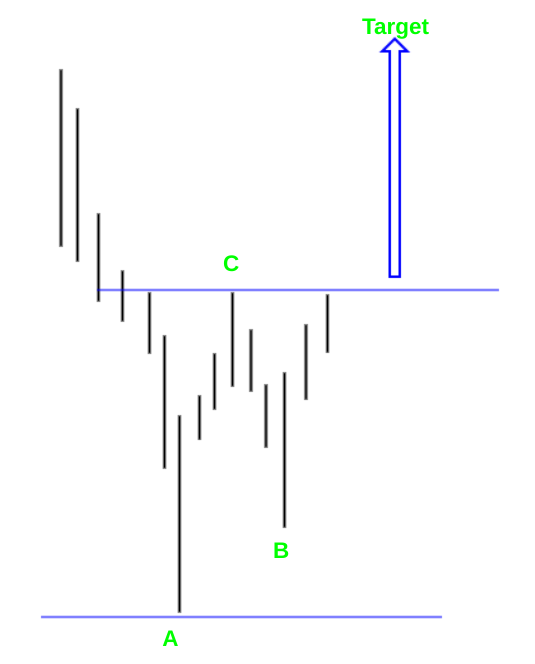
A quick snapshot of what you’re looking for:
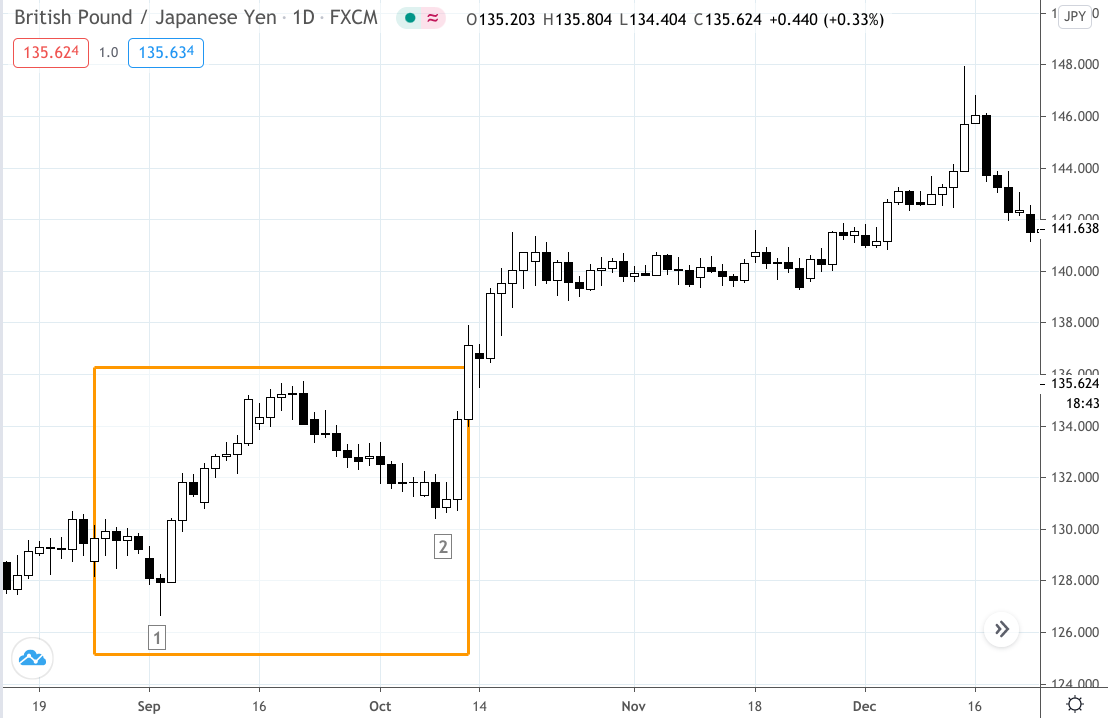
That’s the model. Here’s what it looks like in the live market. Note how reality can vary from the model. This example in the GBPJPY took several days between lows.
GPBJPY Daily August 15 to December 20, 2019
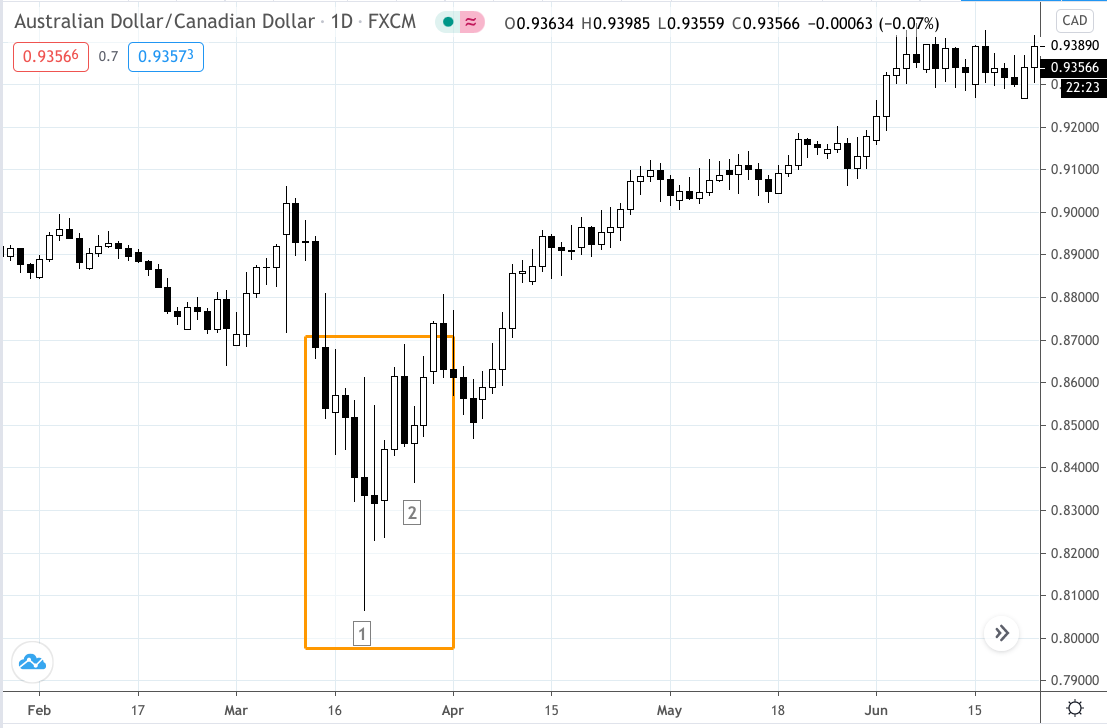
In the AUDCAD, the second low wasn’t very pronounced, and it falls between the categories of a V and W bottom. However, the second low gives you enough room to justify a trade setup.
AUDCAD Daily January to June 2020
CNYUSD Daily August 2019 to January 2020
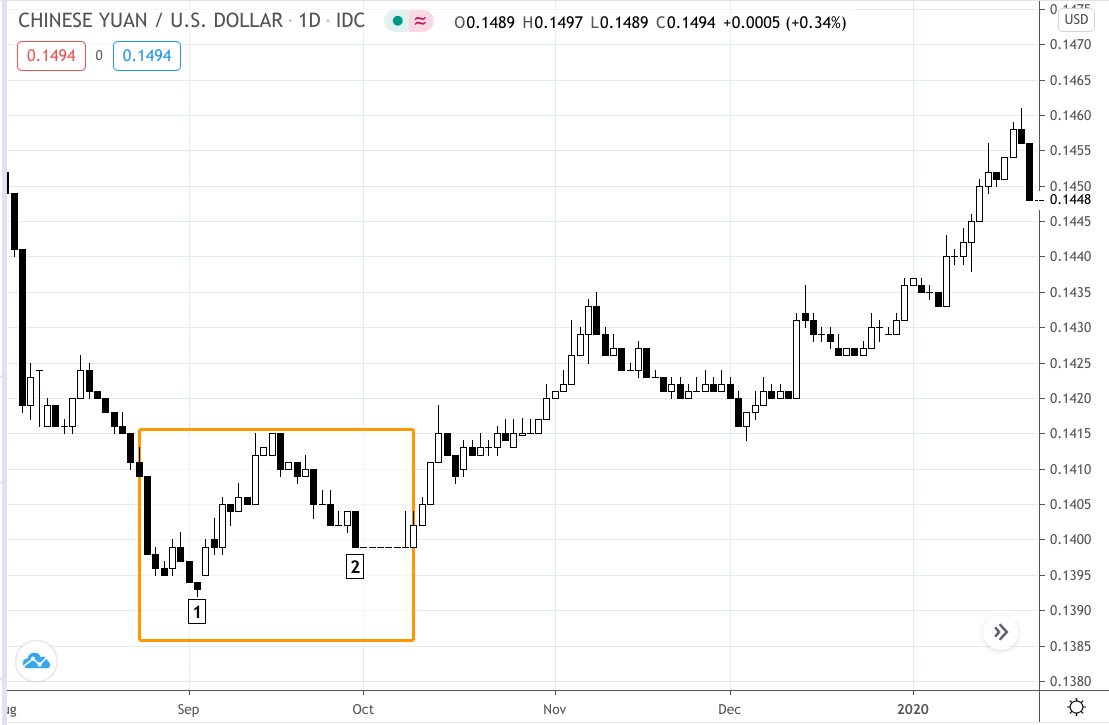
The CNYUSD isn’t a very liquid currency pair to trade. But if you’ve been following the US-China trade tensions, the fundamentals might have given you enough confidence to trade this pattern. The technical setup would’ve made for a nice tactical setup.
Now that you know what to look for, the next thing you probably want to know is how to trade.
We just covered a bunch of them. Let’s use our first example.
Ugly enough? We see one bottom followed by a second. In real-market cases, the bottoms can be closer or further apart. It doesn’t really matter, as long as you can identify two bottoms. The next part is critical with regard to this particular setup.
For the sake of the setup, we’re looking for a second bottom that’s 5% to around 20% than the first. Although the best test results come from this range, in some cases, the second high maybe even greater than 20%. You have to determine this using your own judgment–whether the reward is worth the risk.
What we’re looking for in this second low is an indication that selling pressure is being canceled out (or overpowered) by buying pressure.
Calculate the height between A to C. You have to decide the multiple of this height (75%, 100%, or more) based on the technical or fundamental factors you see before you (resistance ahead, fundamental conditions, etc.) in order to decide which multiple you want to use. In other words, you have to use your discretion to customize your target.
Add your preferred multiple to C to get your price target for the completion of this candlestick pattern.
The last part is pretty easy. Allow your trade to complete itself at a profit or loss. Hopefully, you’re allocated the right percentage of risk to your position, not more or less. If your target is 100% or more the height of the pattern, then you can consider either raising your stop loss to [B], or close to a breakeven point to limit your losses. At this point, you’re on your own, but at least you have several options for managing your trade.
Let’s look at this trade from a real market scenario, using some of our examples above.
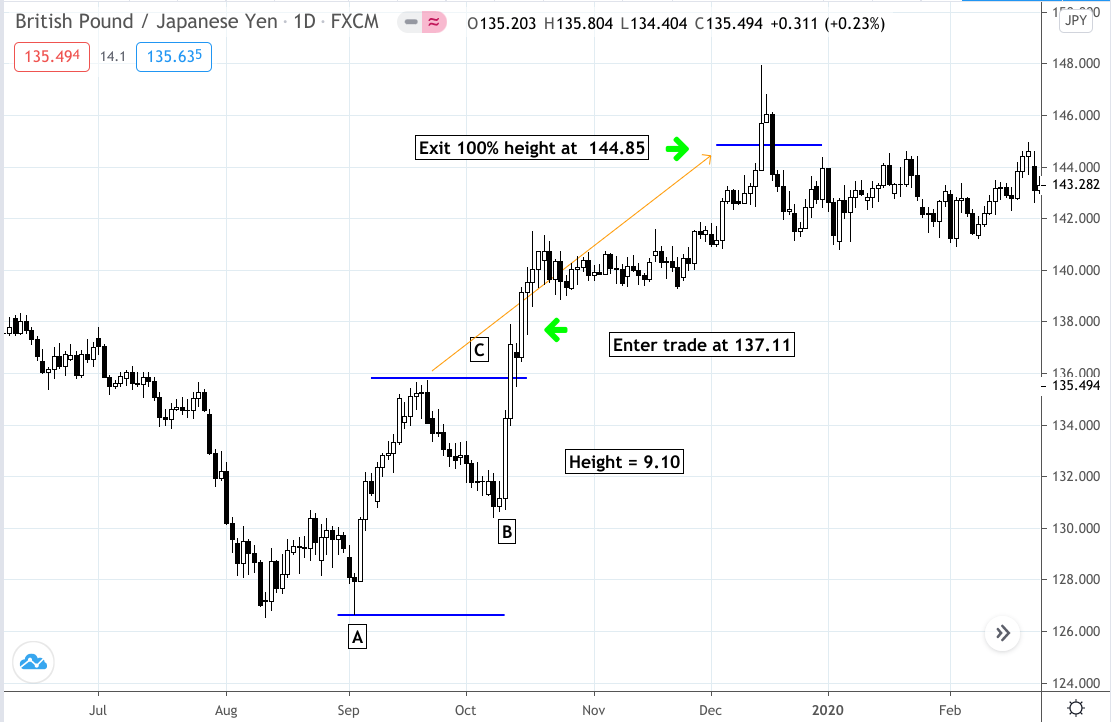
The height of the pattern between [A] and [C] = 9.10 (or 910 pips). You would add this to the top of the pattern at [C], or 135.74, to get a target of 144.85.
You enter a long position at the close of the breakout candle at 137.11. Since your target is 100% of the pattern height, you exit your trade at 144.85 for a profit of 7.74 to 774 pips.
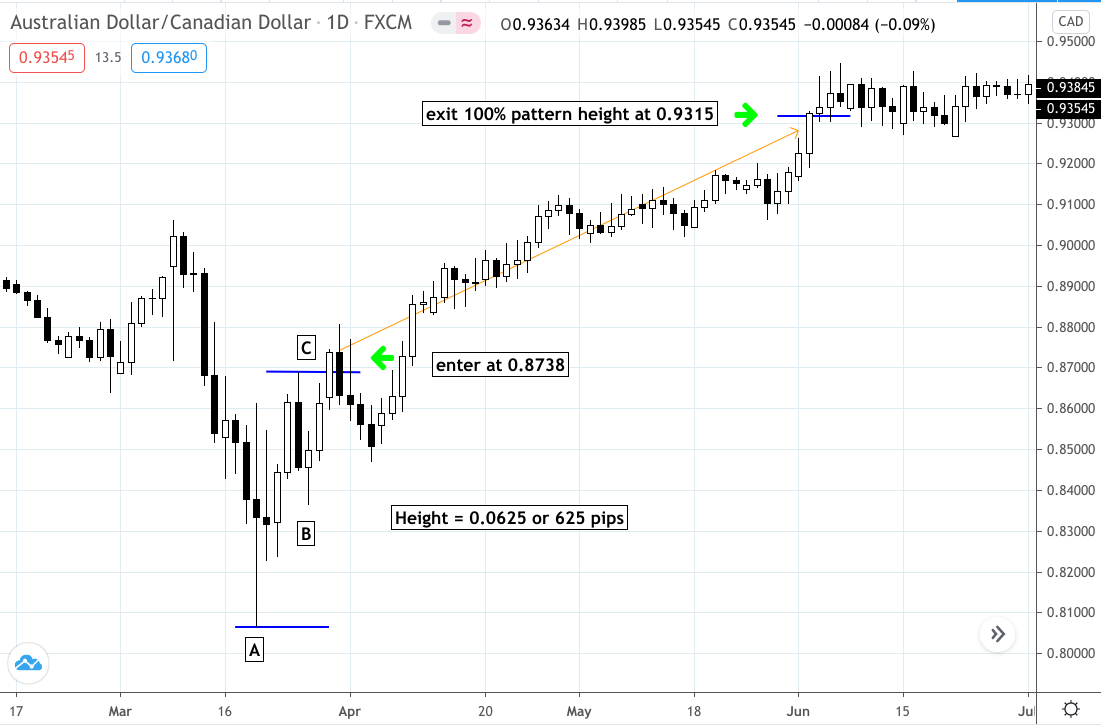
Similar to the example above, you enter the trade at the close of the breakout candle at 0.8718. You exit at 100% of the pattern at 0.9315 for a profit of 597 pips.

By now, you probably get the picture.
Bottom fishing trading is essentially an attempt to time the market. And one thing that’s certain is that most traders and investors are unsuccessful timing the markets. But what matters is not necessarily your win rate, but that your positive payoffs are greater than your losses. In other words, you can lose several times but make back your losses and hopefully more on fewer wins. And although there are many different ways to ‘bottom fish,” this technique is one sound way to keep your setup objective, measurable, and flexible enough for adjustment, should the situation (technical or fundamental) call for it.


external link:


3 min read
“95% of all traders fail” is the most commonly used trading related statistic around the internet. But no research paper exists that proves this...

3 min read
Trendlines can be great trading tools if used correctly and in this post, I am going to share three powerful trendline strategies with you.

3 min read
Choosing the right trading journal is essential for traders wanting to analyze performance, refine strategies, and improve consistency. In this...