3 min read
Scientist Discovered Why Most Traders Lose Money – 24 Surprising Statistics
“95% of all traders fail” is the most commonly used trading related statistic around the internet. But no research paper exists that proves this...
Most traders struggle because they continuously fight some of the most essential trading principles. At the top of the list is trying to call tops and bottoms and predicting price movements – instead of anticipating price movements. We have talked about the problem of calling tops and bottoms before and today we are exploring a new trading principle which can make a big shift in your trading.
For a lack of better words, we are just going to call this price and trading principle the “Boom and Bust” pattern. I discovered it first several years ago in a book about technical analysis and ever since it has been a big part of my trading. But it is much more than just another price action pattern – it’s an ‘immutable law’ of how traders move the market and how (mass) psychology manifests in price movements.
As the name implies, the pattern consists of two parts: the boom and the bust. The best use for this pattern is when it comes to identifying the end of a trend or if you are looking for a trend reversal opportunity.
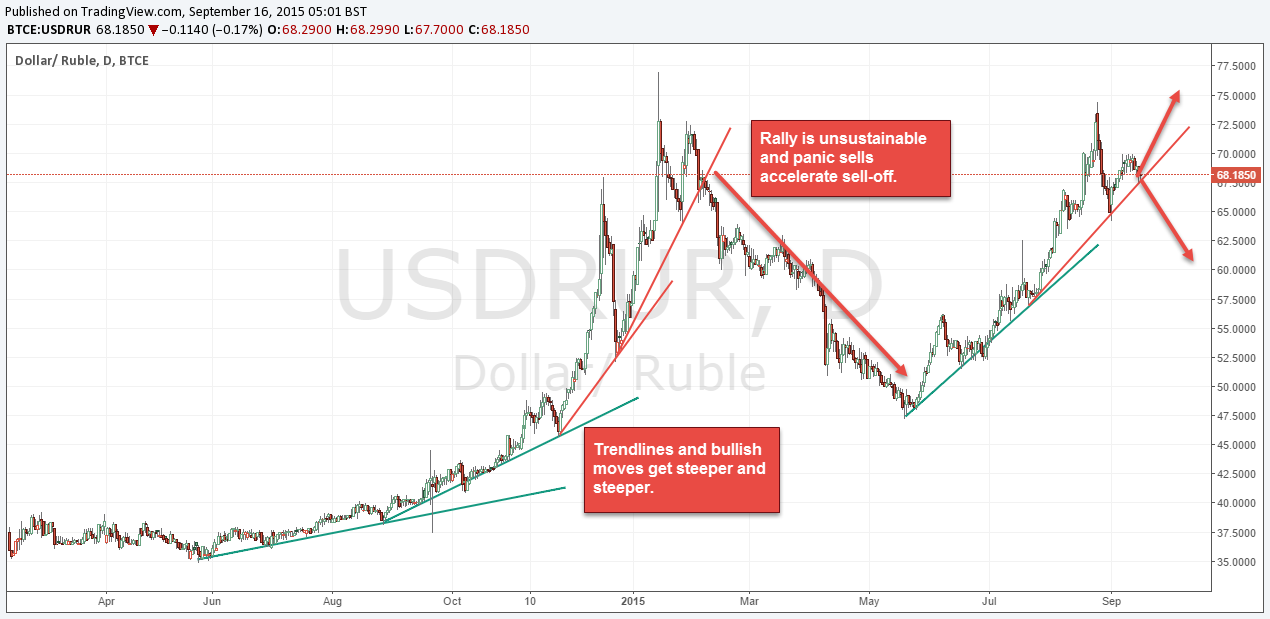
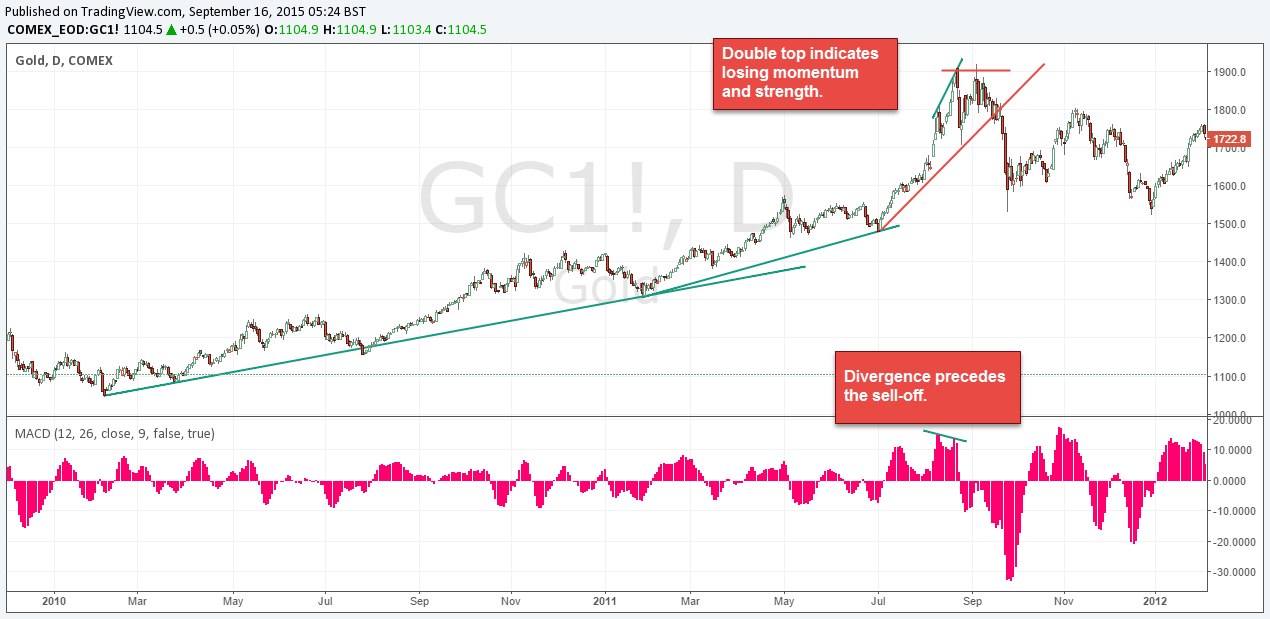
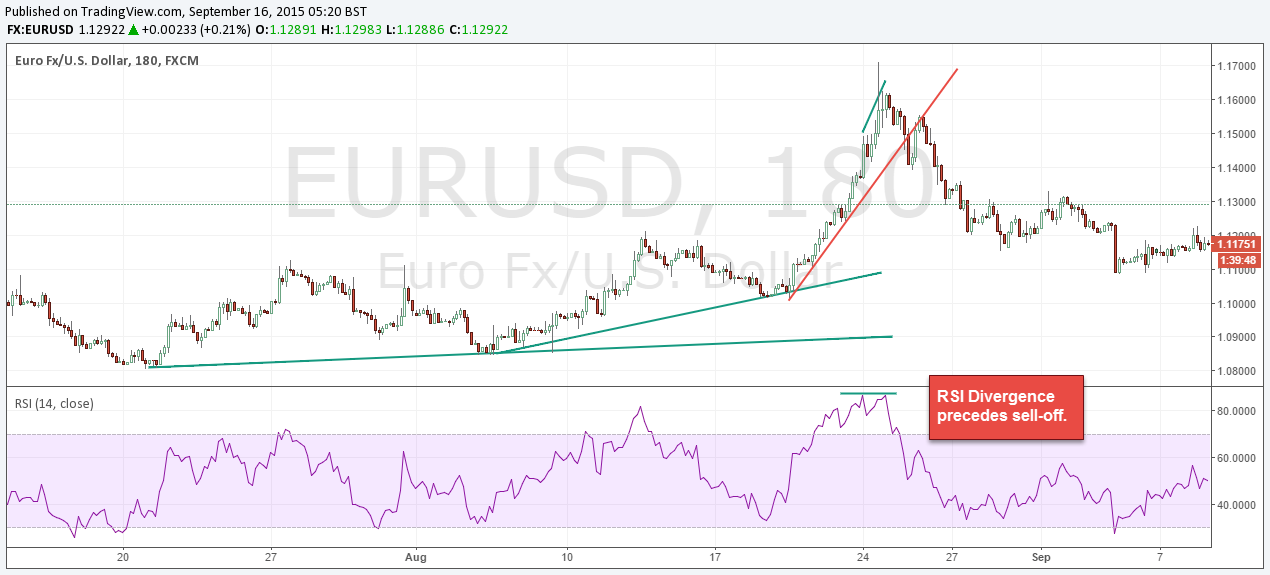
The screenshot below shows the ideal “Boom and Bust” pattern. In the initial stage you have a slow and moderate trend (green trendlines). Then, suddenly, the momentum picks up and the trend accelerates until the trendlines have a very steep angle (red trendlines). Afterwards, you usually get some kind of price action pattern (a double top and a failed breakout in this case) or your indicators turn (in the form of divergences, as we will see later) signaling the end of the boom. Finally, the bust happens and price reverses sharply.
This is the ideal scenario and we will now take a look why this pattern works so well.
It has long been known that price moves very differently during uptrends and downtrends. Whereas, traders treat rallies and sell-offs usually the same, the professionals know that it is necessary to know the current market environment and to adjust their trading approach accordingly – you can’t use the same trading methodology during uptrends and downtrends.
The “Boom and Bust” pattern works best in an uptrend, as described above. The reason is that almost all bubbles start slow and then gain momentum on the way up. Furthermore, the panic after a bubble is greatest after a rally and countless empirical research has confirmed that price movements are much faster during falling markets. Thus, there is less resistance and price travels faster on the way down.
We urge you to start looking at your trading and trading methodology with an open mind. Can you really use your system and trade it both long and short or should there be different rules and methods for buy and sell trades, and for uptrend or downtrend periods?
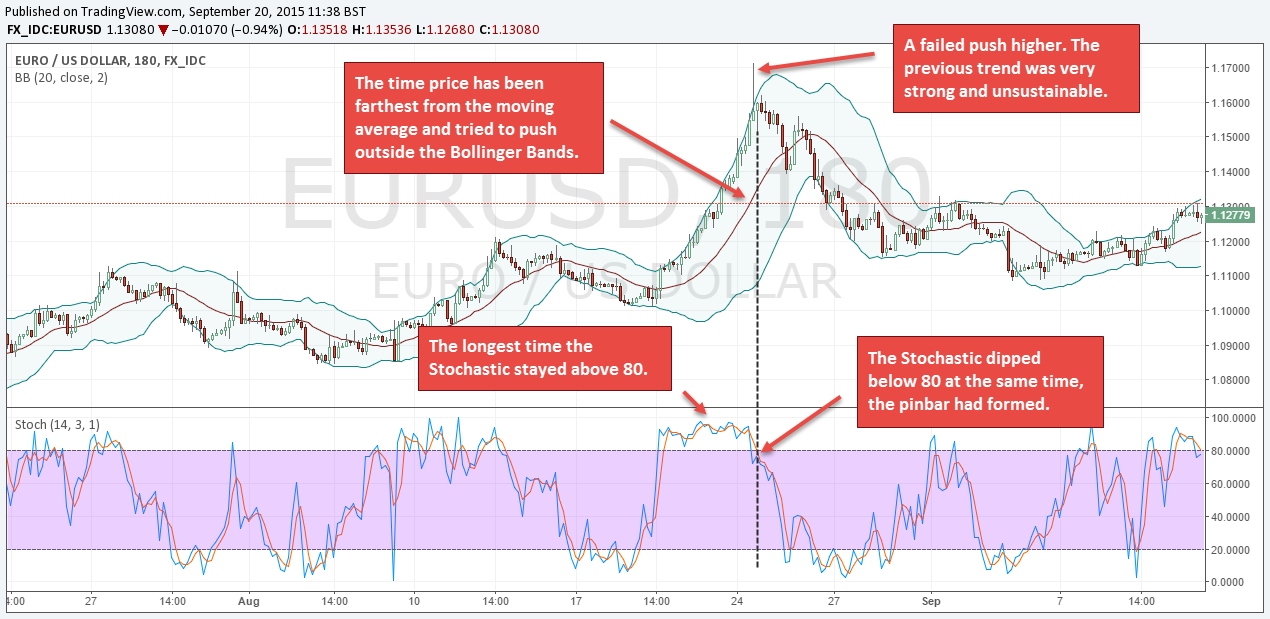
To identify a boom period, you don’t necessarily need trendlines. The distance price has traveled away from his moving average can give a first indication of recent price action. Furthermore, Bollinger Bands® can help you measure the degree of over-extendedness of trends and determine how strong the boom-period is. If price has been trading outside of the outer Bollinger Bands and the trend has a lot of momentum (large candles and a high Stochastics value), it often classifies as a boom-scenario.

The problem with this pattern is that the rallies during Boom-periods can last for a very long time and go much further than logic would suggest. Thus, shorting into the extreme bubbles and Boom-periods has to be avoided! Although, sooner or later every bubble will burst, as a trader you have to find the scenarios where your edge is greatest and stay away from uncertain or unmanageable setups.
Here are the 5 most important trading principles to mastering the “Boom and Bust” pattern:
1) Stay away from the big bubbles!
You can find smaller boom and bust patterns on the lower time-frames – especially the 4H time-frame is a good compromise between the bigger “Boom and Bust” moves on higher time-frames and meaningless and short-lived trends on lower time-frames.
2) Don’t predict. Wait for clear reversal signs
We have said before that trying to predict a market top usually results in a disaster. The professional trader waits for clear reversal signs and only enters a trade once price have started falling already. Just as in trend-following (the term ‘following’ is key!), a trader has to adopt the mindset of reversal-following – instead of predicting. The first and the last part of a price move is the most difficult to catch and traders do well by trying to focus on getting the ‘safe’ portion in between and not be too greedy.
3) Use confirmation tools
There are many tools a trader can choose from when it comes to identifying slowing momentum and a change in market sentiment. We have talked about divergences, double-divergences and mean reversion trading on Tradeciety before. In addition, price pattern confirmation such as double tops and failed breakouts can also provide important clues. As mentioned before, Bollinger Bands® and moving averages are great tools to measure how strong the boom-period is.
4) Don’t hold too long. “Buying the dip” can often stop prices from falling during a sell-off
The “buying the dip” strategy can be deadly for reversal traders because it often results in short-lived reversals. Trend-following traders who desperately buy dips during a sell-off can eliminate reversal opportunities fast. Thus, be quick to grab profits and know when to get out of your position when it turns on you.
5) Pick your spots!
You have to know what your edge is, especially as a reversal trader. Where do you look for trends that look like a “boom” pattern? How do you define a “boom” scenario? Which tools are you consulting to identify scenarios where a reversal is likely? How do you time entries? How do you choose your targets and when you do exit a trade ahead of target?
Reversal trading can be a lucrative trading style, but, at the same time, it can also end in a disaster very quickly if you are not 100% certain about your edge. Thus, reversal trading should be avoided by amateurs and emotionally unstable traders.
Image source: tradingview.com


external link:


3 min read
“95% of all traders fail” is the most commonly used trading related statistic around the internet. But no research paper exists that proves this...

3 min read
Trendlines can be great trading tools if used correctly and in this post, I am going to share three powerful trendline strategies with you.

3 min read
Choosing the right trading journal is essential for traders wanting to analyze performance, refine strategies, and improve consistency. In this...