Supply and Demand Trading in 2026
We have been trading supply and demand strategies for over ten years, and they have stood the test of time remarkably well. Supply and demand is...
The debate about whether indicators or pure price action is more effective is probably as old as trading itself.
The one and only answer, though, should be: BOTH!
As you will see, there is virtually no difference between indicator and price action trading and both approaches are based on the same data. In the end, you will get the same results regardless of which approach you chose. It only comes down to what a trader’s preferences are. This holds true for anything trading related.
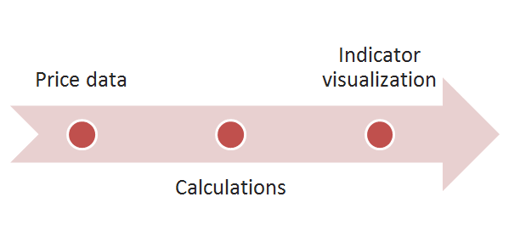
Indicators are tools that take price and/or volume information, apply a formula to it and then transform it into visual information such as graphs or oscillators. By analyzing and crunching price data, indicators provide information about the strength of a trend, momentum, potential turning points and possible reversals.
Indicators do not add or subtract anything from the price information. Thus, a well-trained trader will always get the same information from his/her indicator as from pure price action data.
Problems arise when traders are ignorant and do not spend time understanding indicators. A trader who has never looked at the formula of an indicator will, of course, draw the wrong conclusions. If you want to see what it really takes to understand how an indicator works, I recommend reading our STOCHASTIC guide. This guide demonstrates why indicators are usually misunderstood and used in the wrong context.
Further reading: Indicators work. But you don’t know how to use them
An indicator uses the candlestick high, the lows, range size, the open and the close – among other data points. Therefore, an indicator can even show more accurate and conclusive data than just pure price action because traders generally do not know how to relate price data into meaningful relationships. It is, thus, critical for a trader to stay open-minded or he might miss valuable information.
While we are at it, let’s discuss the 3 most common indicator myths and by the end, you will be able to see why the majority of traders is usually wrong about indicator trading.
Indicators fall into two major groups: the first one can be used within established trends, the second one provides information during range-bound markets. The range indicators are called oscillators which move back and forth between fixed values. The other group which contains trending and other indicators are not bound by fixed boundaries.
Although there are indicators that don’t fall into these two categories, in the following we focus on the most commonly used indicators and provide an overview, the features and what to be aware of when it comes to using indicators effectively.
Indicators used in trending markets come, in contrast to range-bound indicators, in different forms. Whereas some are plotted directly on the charts, such as moving averages or Bollinger Bands, others visual price information in the regular ‘indicator’ area below the price chart.
Trend indicators are mainly used to identify the beginning of a trend, the strength of a trend or to spot trend reversals by analyzing declining momentum or identifying divergences. The most common used trend indicators that we will analyze in the following sections are:
MACD – Finding and analyzing momentum
ADX – The strength of a trend
Bollinger Bands® – Volatility and strength indicator
Moving Averages – Directional information, strength and also as support/resistance
Indicators used in ranging markets are called oscillators, although some trend following indicators are oscillators as well, between they oscillate between 0 and 100 back and forth, whereas the upper and lower end of oscillators are also referred to as overbought or oversold. The oscillators we analyze in our coming sections are:
Independent from range or trend environment, indicators who analyze volatility can be used in combination with other indicators, tools and price action concepts to gather more information about market conditions. The 3 most common indicators that measure volatility are:
Bollinger Bands – Bollinger Bands show the standard deviation (a measure of volatility) around a moving average.
Standard Deviation – The standard deviation is a measurement of volatility levels. Whereas the Bollinger Bands are directly plotted on the price chart, the Standard Deviation indicator goes below price charts.
ATR indicator – Calculates the average range in over the past X periods. A high ATR indicates that recent volatility was large, compared to low ATR readings.
Parabolic SAR – This indicator is diverse and can be used for different purposes. It can be a trend-following indicator, but it’s also commonly used as a trailing stop methodology.
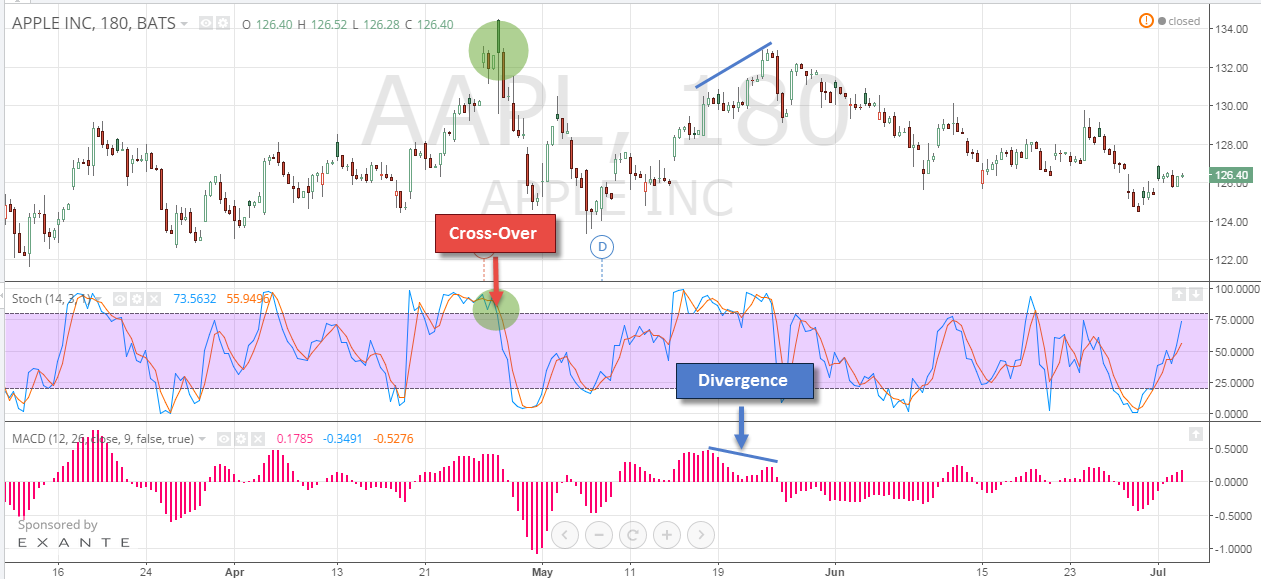
The general signal of an indicator comes in one of three forms.
 Example of divergence and cross-over signal
The period settings are crucial for how indicators calculate and display data. And, even more important, the period settings of the indicators are responsible for how often and signals are generated and how sensitive the indicator responds to changes in price movements. Thus, choosing the right setting for the specific purpose is essential, but mostly overlooked by traders.
A slow setting indicator includes more past periods and observations into the calculations and, therefore, new price information do not have a great impact. Slow settings on an indicator mean that it takes more time for the indicator to turn around if price changes; the indicator moves more smoothly and is not very sensitive to new changes in price.
An indicator with a faster setting (fewer periods) moves more erratic and is more sensitive to new price changes.
Choosing the correct indicator setting is, therefore, of great importance when it comes to making sense out of the data. Whereas a slower setting can potentially filter out more noise, a trader will also get valid signals later. On the other hand, faster settings produce more signals and also more noise for the trader. The balance and the right objectives are important for choosing the optimal period length.
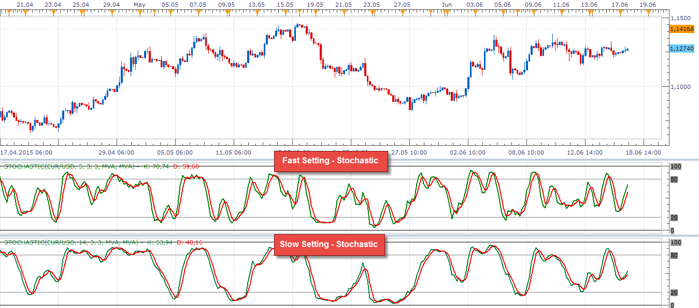
Fast vs. Slow period setting
The discussion about whether to use indicators or price action is as old as trading. However, once a trader understands that there are no differences between price action and indicators, traders can avoid the typical ignorant mindset and combine tools and concepts in a better and more professional way.
Indicators just take price information and the data you see on your charts and perform a calculation in order to transform it into a visual output. Thus, whether you look at a head and shoulders pattern or a divergence on your indicator, a trader can gather the same information from both concepts; both methodologies are based on the exact same information available.
external link:


We have been trading supply and demand strategies for over ten years, and they have stood the test of time remarkably well. Supply and demand is...

3 min read
Choosing the right trading journal is essential for traders wanting to analyze performance, refine strategies, and improve consistency. In this...

3 min read
“95% of all traders fail” is the most commonly used trading related statistic around the internet. But no research paper exists that proves this...