3 min read
Scientist Discovered Why Most Traders Lose Money – 24 Surprising Statistics
“95% of all traders fail” is the most commonly used trading related statistic around the internet. But no research paper exists that proves this...

When it comes to finding better trade entries, there are certain concepts that can be used by any trader and with any trading method. The methods and tips discused in this article are universally applicable to any timeframe and to any market.
Let’s start with the best entry filter right away. Location means that you only take trades at or around key price levels. Such location points are usually support and resistance, supply/demand, moving averages, Fibonacci levels or swing highs/lows.
However, the hardest thing for the amateur trader is skipping good trade signals if they don’t occur at such price levels. They always feel like they are missing out because besides the missing location-criteria, everything else looks good about the trade.
Over the long term, only taking trades which actually happen at those key price levels can make a huge impact on your trading because it often increases the quality of the signal and can help boost your performance.
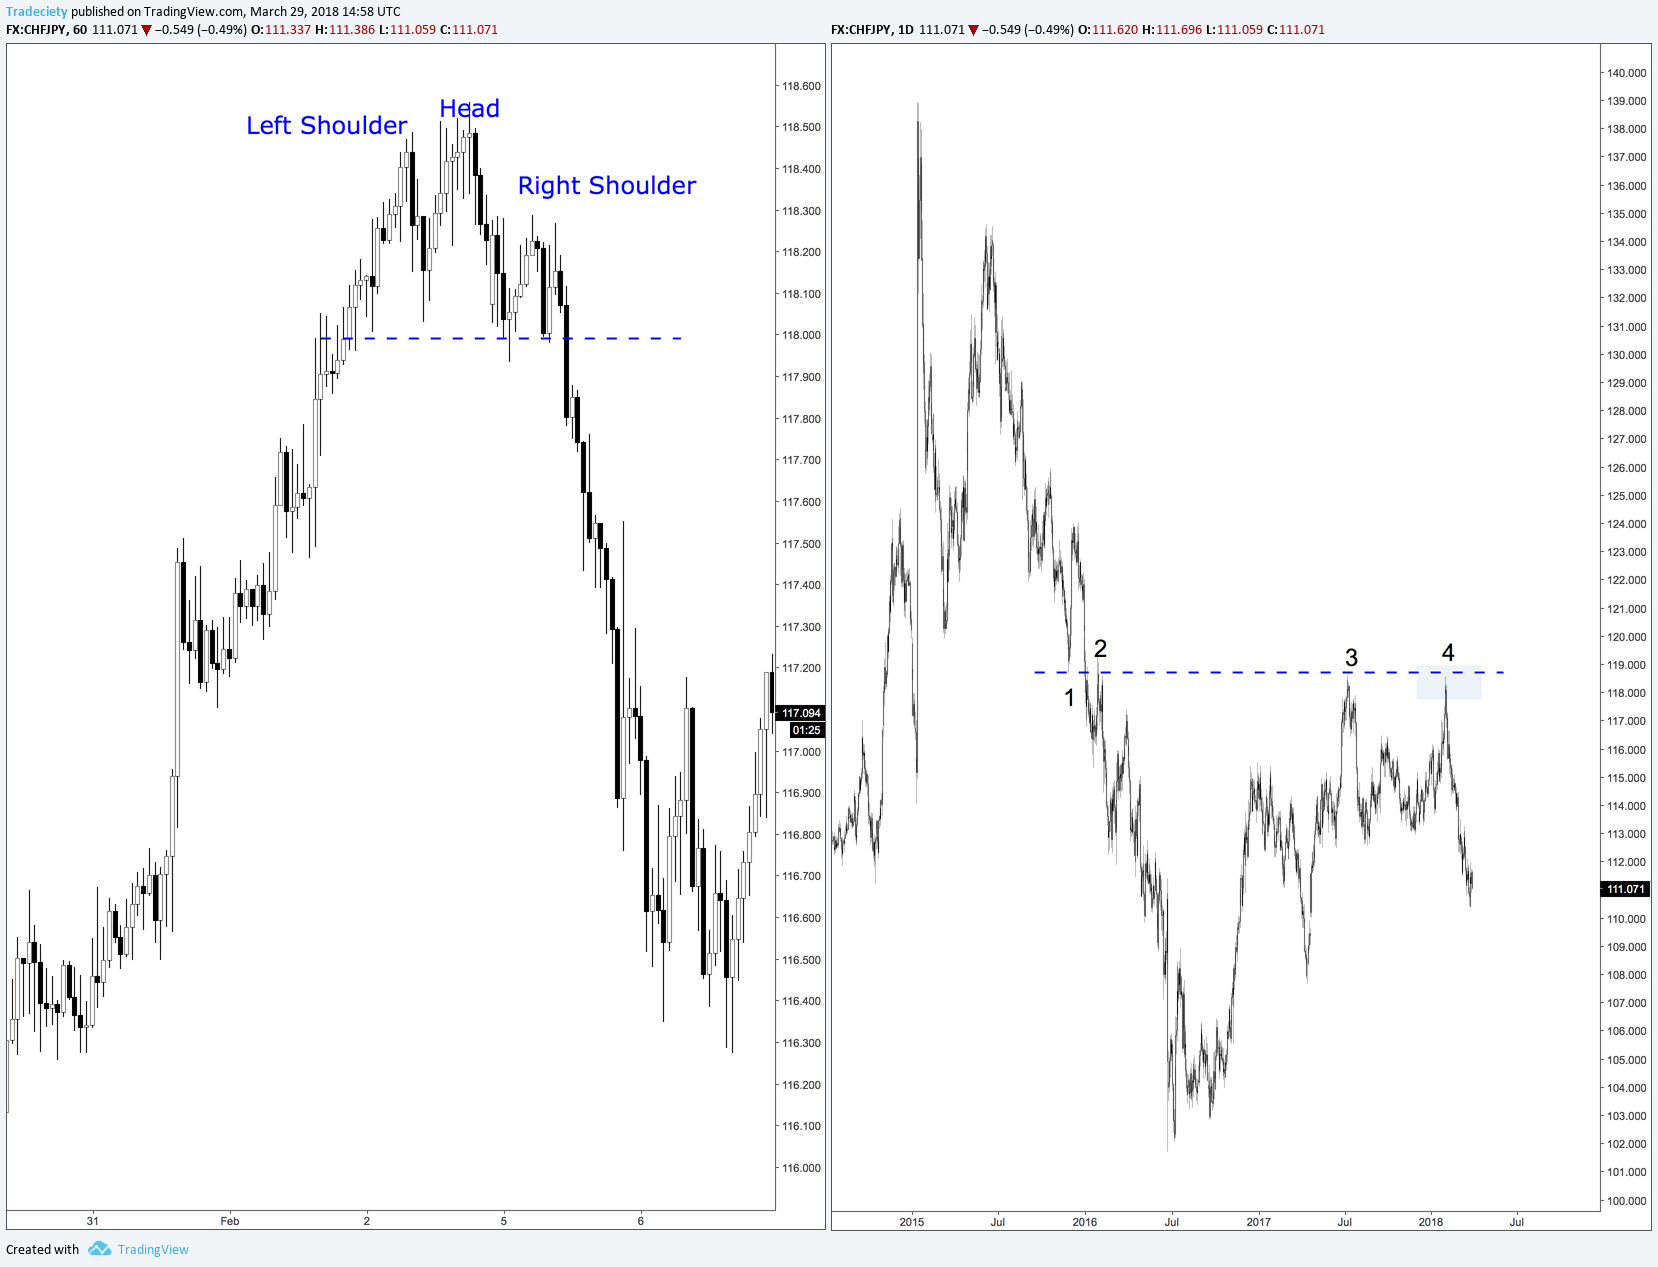
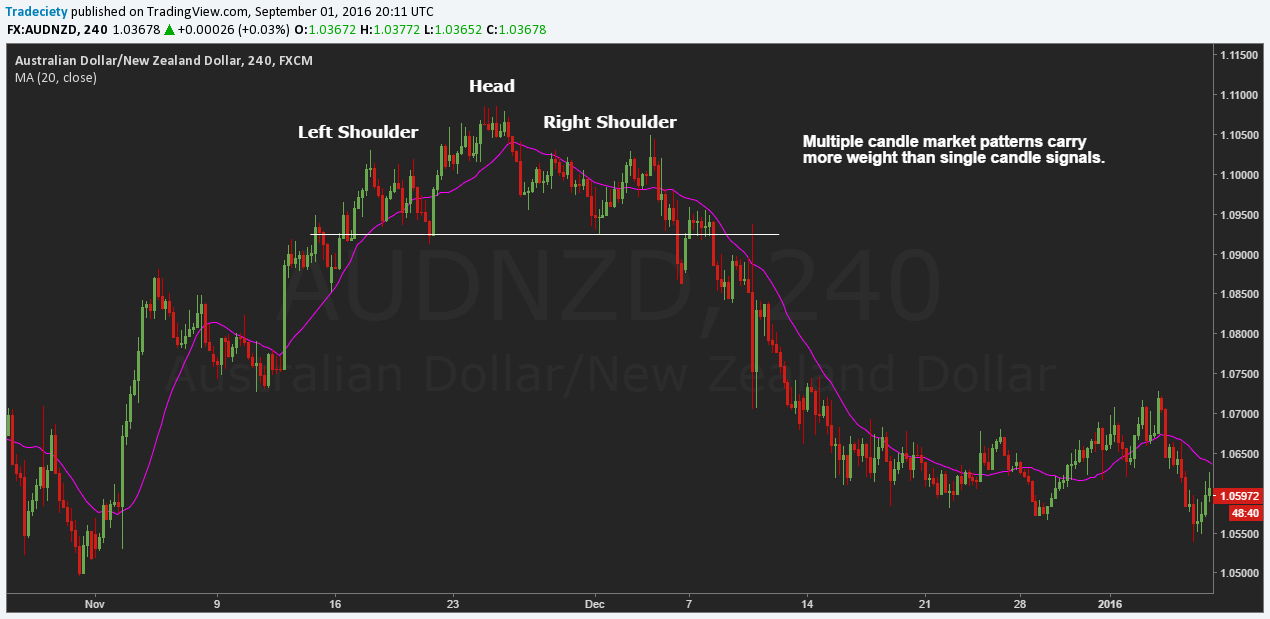
The left Head & Shoulders happened right at the major resistance level we see on the right.
I recently said that multi-timeframe analysis is flawed and not working. I stand by that, but people often put it into wrong context.
I do not believe that you must align two random timeframes in order to find good sifgnals. Mostly, this is very confusing and traders have a hard time applying multi-timeframe analysis.
Let’s step back and ask ourselves what it is that we want to do with multi timeframe analysis? We want to get a bigger picture, we want to see where price currently is in relation to the long term trend, if any big levels are closeby and we want to make sure that we get a different perspective.
This all can be done by simply zooming out on the actual timeframe we want to trade. When I trade the 4H timeframe, I do not go to the Daily timeframe to find a trade. I stay on the 4H timeframe but I zoom way out. This helps me get an accurate picture of the current situation. Too often, the timeframe we are on is very narrow and we miss important clues.
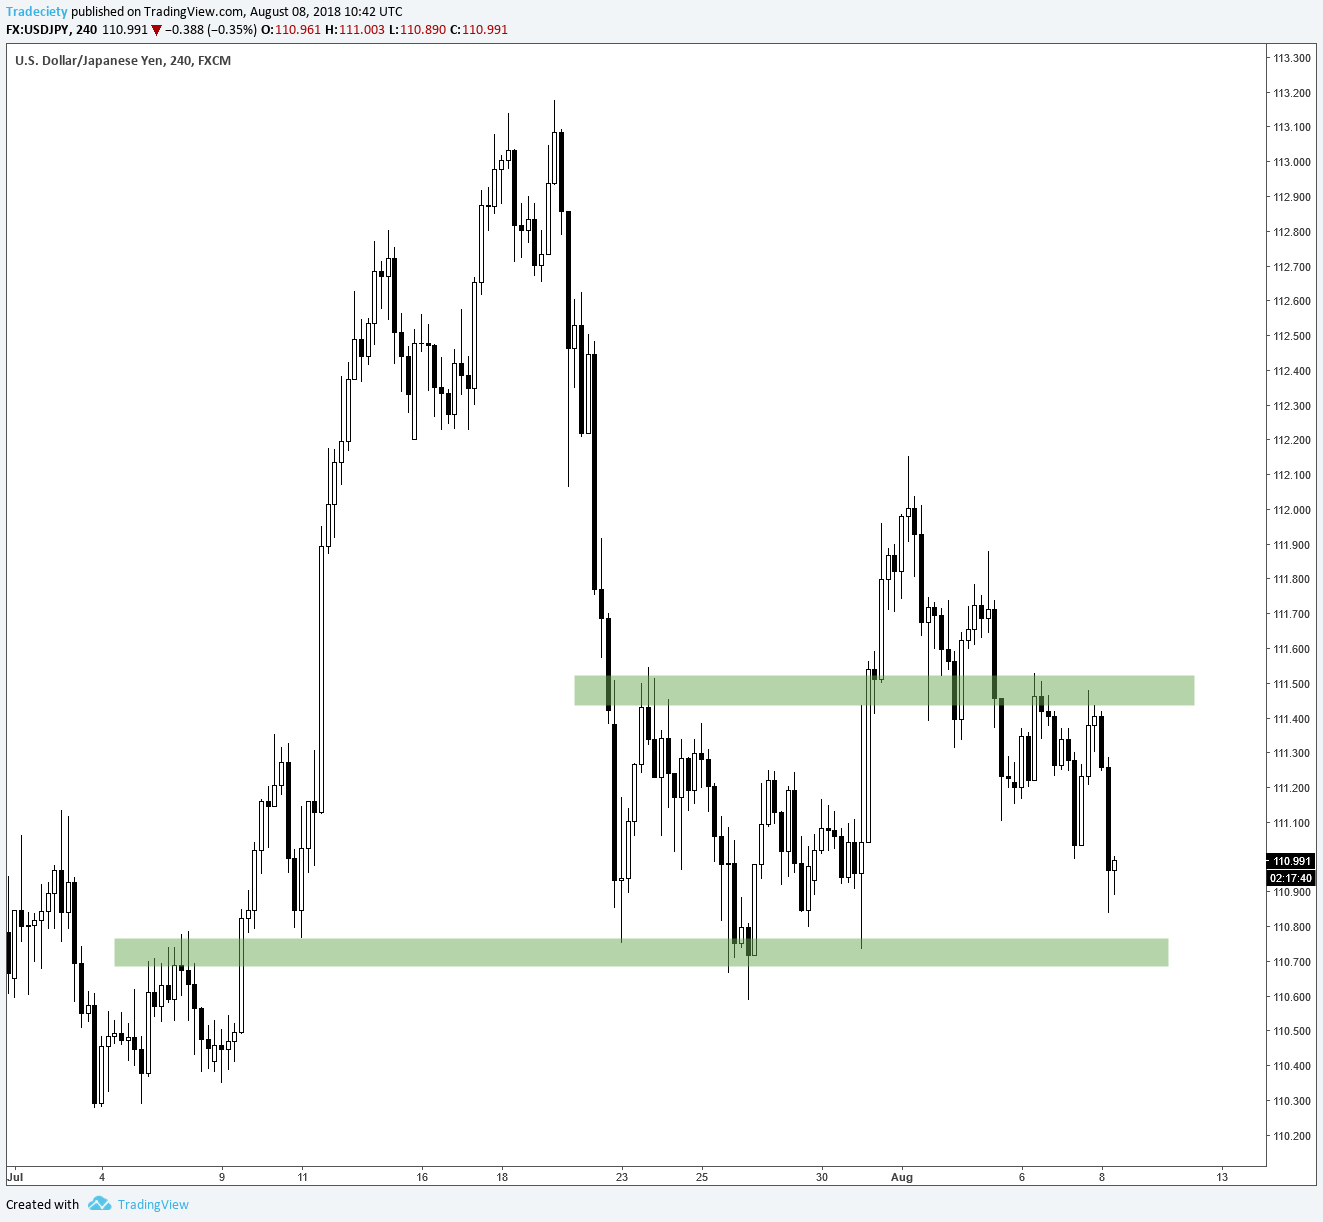
Persepctive is a totally overlooked topic. Most traders stay on their one timeframe zoomed in and then interpret their charts completely wrong. Below you see a chart the way many traders will follow it. It looks like the price is at the lower area of the screen and right at a support level, ready to bounce higher…
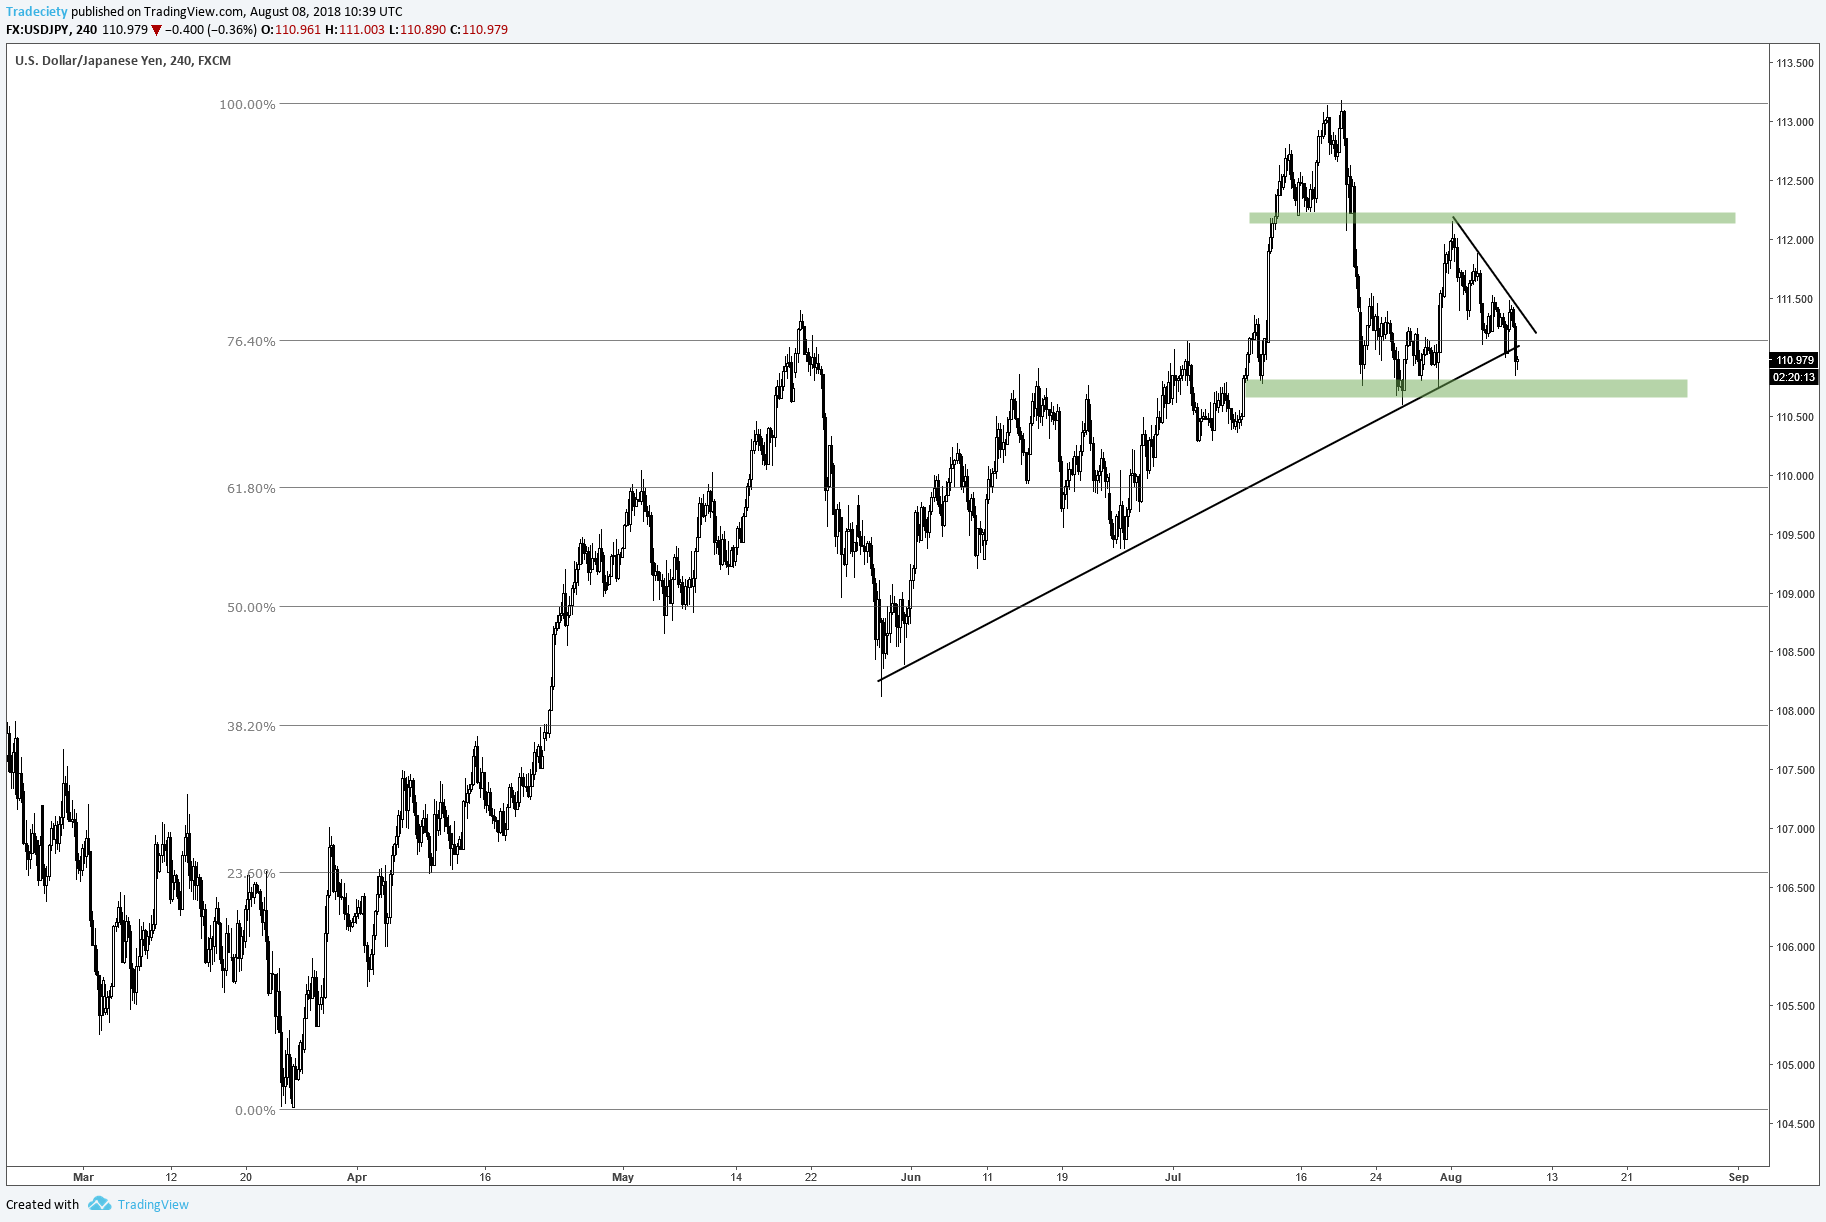
But when we zoom out on the same timeframe, it looks like the price has been in a strong uptrend for a long time and it has just started to shift with a lower high and increased selling. There is actually a lot of room to the downside and the range we saw on the screenshot above is the top when we zoom out.
My tip is: zoom out, scale charts differently, try different zoom levels and you will understand your charts in a much different way.
This third point is something not many traders follow, either – or are even aware of.
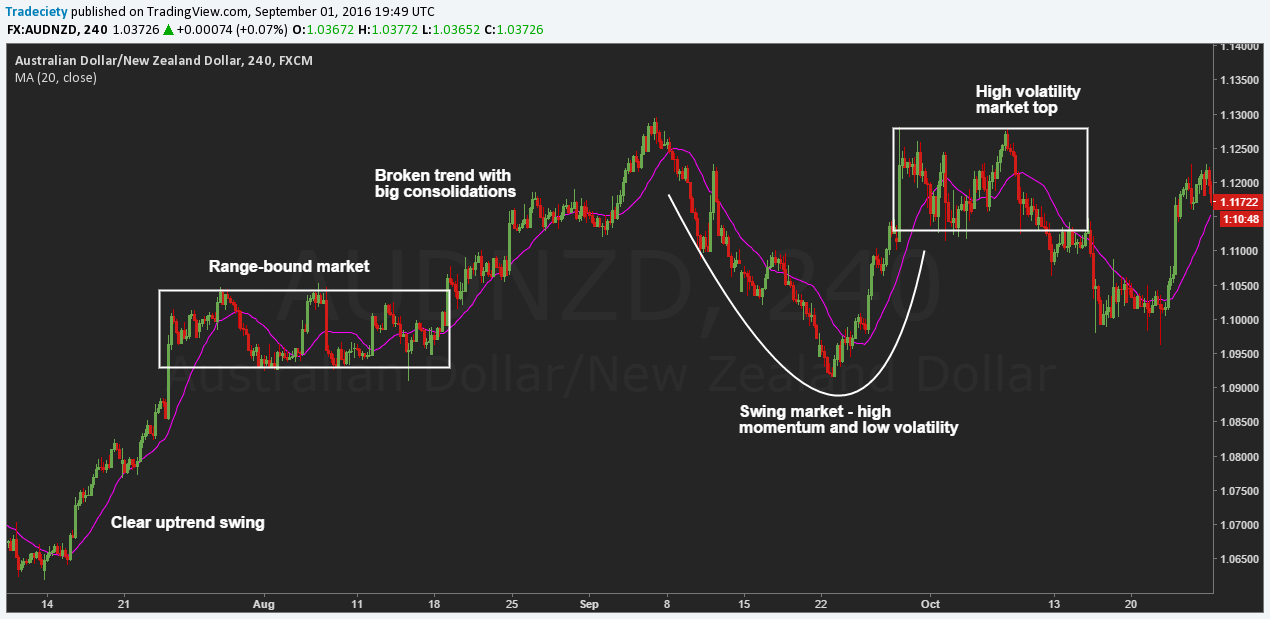
It is vital as a trader that you know (1) under which market conditions your trading method performs best and then (2) pick the markets that are in such a phase.
Trend traders often get caught up in range-bound or low momentum markets. Reversal traders get burned in strongly trending phases. And range traders run into problems trading breakouts.
Market selection and knowing which market conditions your method performs best in is a completely overlooked field in retail trading.
Right now, you should grab screenshots of your 10 best trades, find the similarities and write down the market conditions the trades took place in and then improve your market selecion process.
Long-term chart patterns which consist of multiple candles usually have a much higher predictive value than single candlestick signals. I can already see all the people who don’t agree here and believe that single pinbars are a way to make a ‘killing’ in the markets, but even research has confirmed that multi-candle patterns have a higher predictive value.
In my own trading, I look for long-term patterns which can easily include 30-50 candlesticks at a time, just like in the Head and Shoulders example below. Those longer term patterns provide much better context and they can tell you a whole story about what is happening between buyers and sellers and how powers are shifting between the two parties.
I take it even one step further and I do not only look at the pattern itself but also at what has happened before the pattern was formes. How did the trend look like leading into the pattern? How did the candles behave and what is the general momentum and volatility level.
This point is a continuation of the previous one. Just like making trading decisions based on more candles is usually more effective, trading with more confluence factors can also improve the quality of your trades.
Always let the charts tell you a story and listen carefully. The more confluence factors you have that support your trade idea, the better usually the signal.
If you have a trading journal – and no trader should trade without a good journal – you can track how the amount of confluence factors impacts the accuracy of your signals and your overall winrate. I look for at least 3 confluence factors before I will consider a trade which are, in my case, “Location”, higher timeframe confirmation and a multi-candle pattern.
Of course, the type of confluence factors can vary with your trading method, but the underlying idea works for all types of traders.
Before I enter a trade, I ask myself: do I love this trade? I sit back, pause for a few seconds and then make a decision.
I have been trading for over 12 years and I have taken thousands of trades. If there is one thing that I have learned is that it hurts much more to lose money by taking a bad trade you know you should not be in, than it hurts when you miss a trade that you were not sure about to begin with.
There will always be a next trade but you cannot get the money back when you made a bad call.
If a trade doesn’t scream “amazing” and you have to think about wether it’s worth taking it or not, you are usually better off skipping it.
Stay patient!


external link:


3 min read
“95% of all traders fail” is the most commonly used trading related statistic around the internet. But no research paper exists that proves this...

3 min read
Trendlines can be great trading tools if used correctly and in this post, I am going to share three powerful trendline strategies with you.

3 min read
Choosing the right trading journal is essential for traders wanting to analyze performance, refine strategies, and improve consistency. In this...