Supply and Demand Trading in 2026
We have been trading supply and demand strategies for over ten years, and they have stood the test of time remarkably well. Supply and demand is...
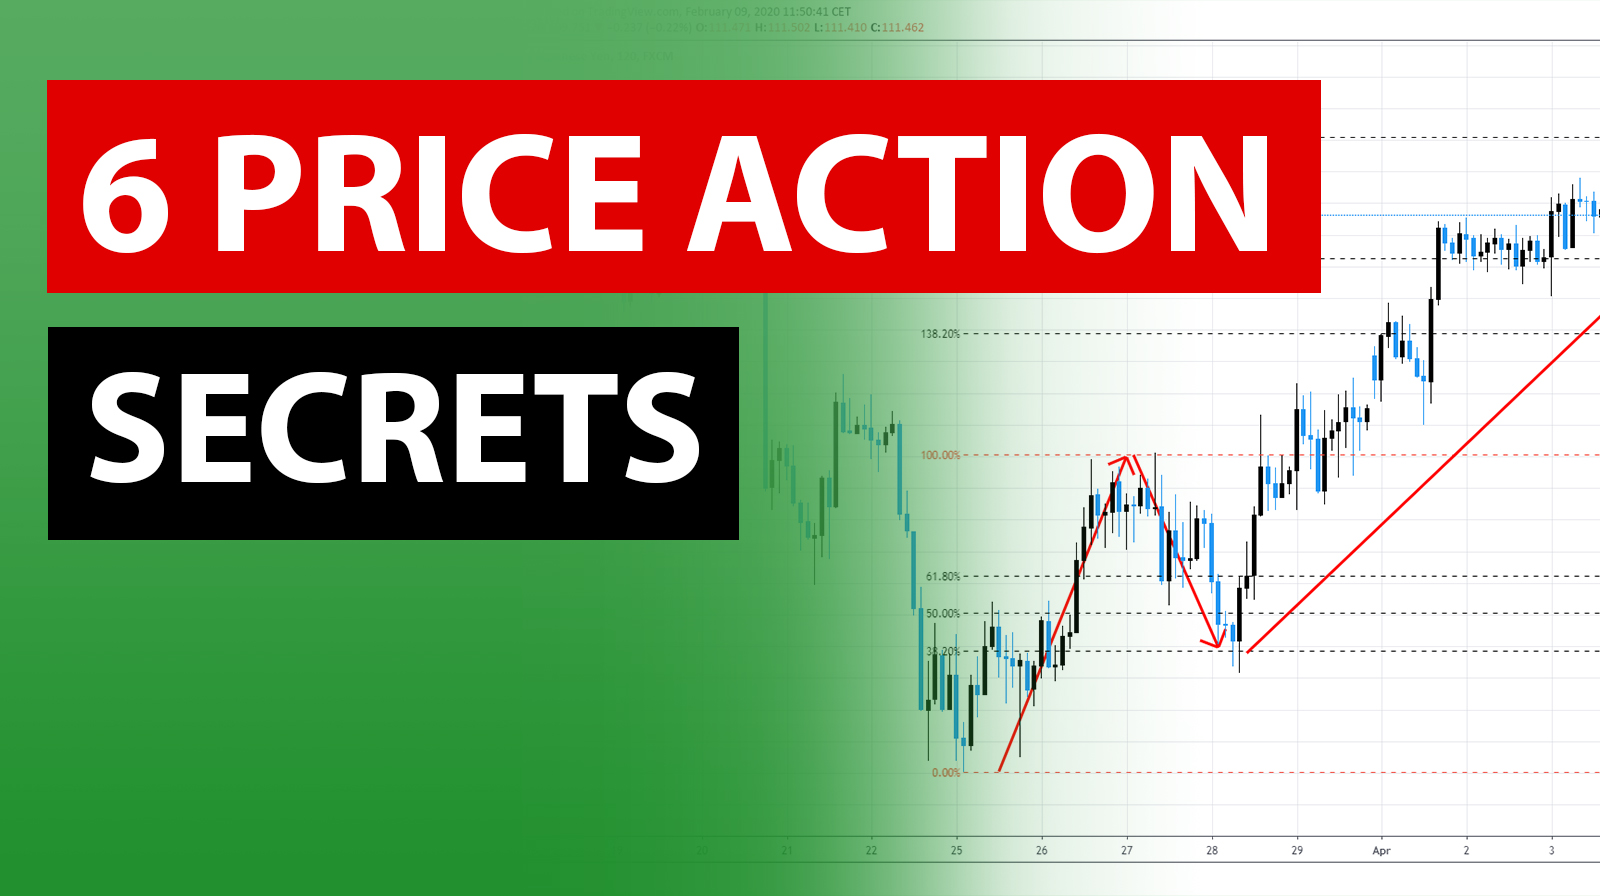
After the huge success of our first article covering price action secrets, I have compiled a new special trading article with 5 new price action tips that work. This time, we go even deeper and we look at a very advanced price action tips that will help you understand price charts in a completely new light.
Acceleration and deceleration is an advanced momentum trading concept that analyzes the speed of price movements.
We can see the deceleration in the circled areas in the screenshot below. The deceleration usually happens after extended trending periods.
Whereas the price pushes fast during trending markets – the majority of long bullish candles during uptrends and the absence of bearish candles show the trend strength – the candles slow down when the trend is about to end.
It does pay off to look at the distribution between bullish and bearish candles during trending markets. When you see that the ratio is changing and the price prints more bearish candles during an uptrend, it shows deceleration. And when the market breaks out into a new direction, you can see acceleration at play when the candles start pushing into the new trend direction with a strong force.
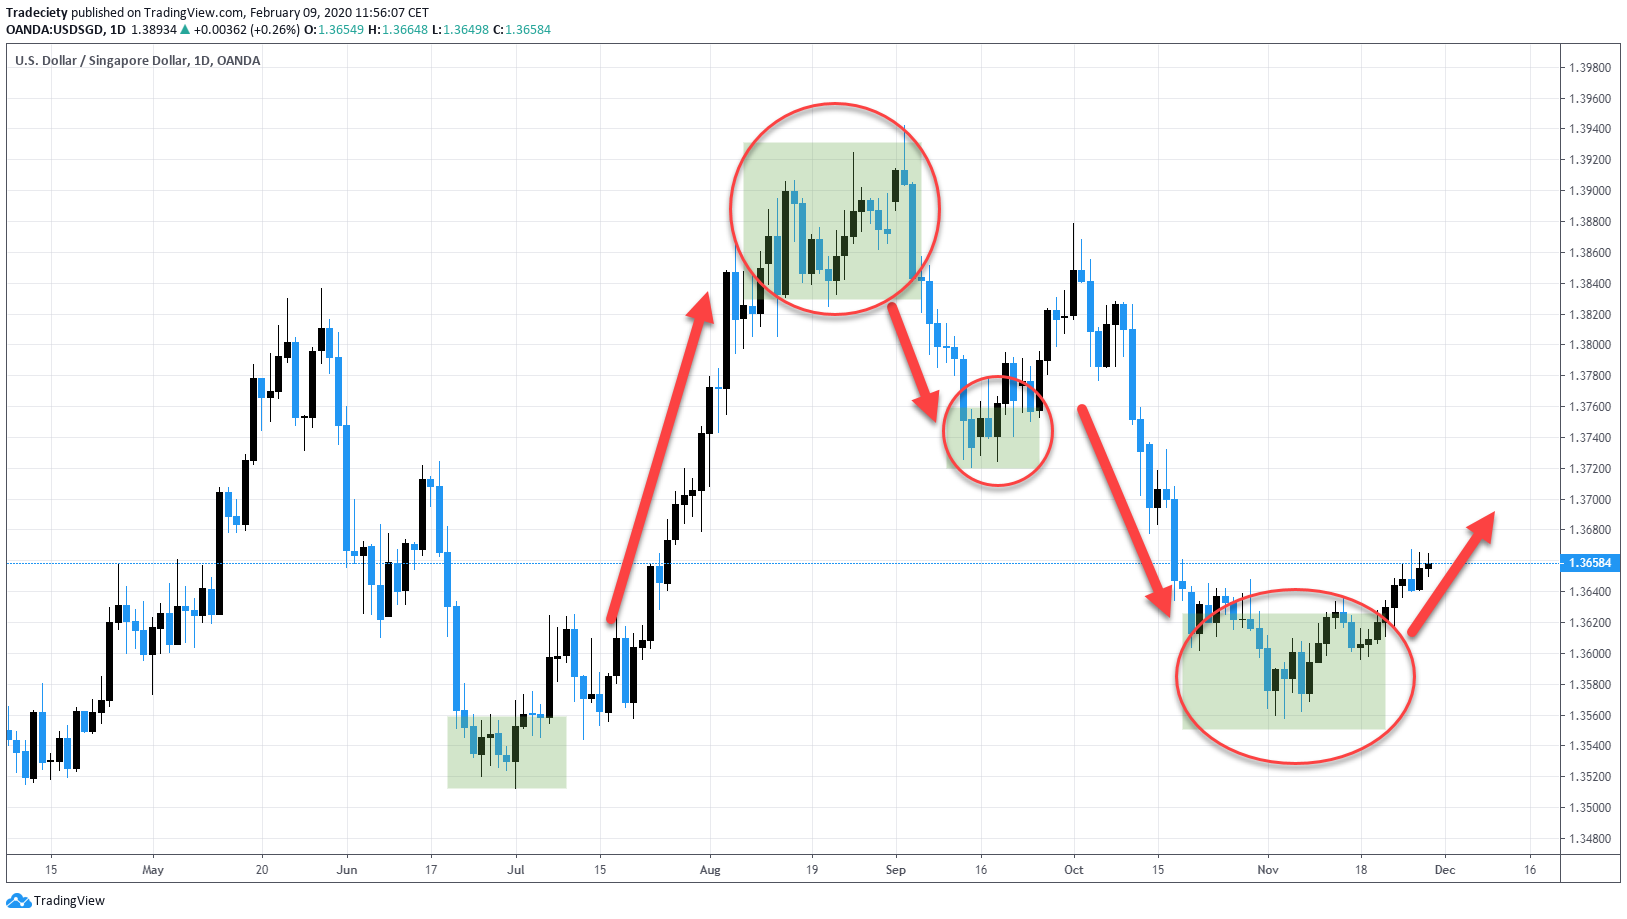
On the left, the price shows acceleration during the uptrend. We can only find bullish candles and the size increases as the trend evolves. Then, the candles become smaller and we can witness more bearish candles as well. This is deceleration at play. We can clearly observe how the market slowly rolled over from a bullish to a bearish market. The bearish trend slowly accelerated and on the right, the price started making larger bearish candles.
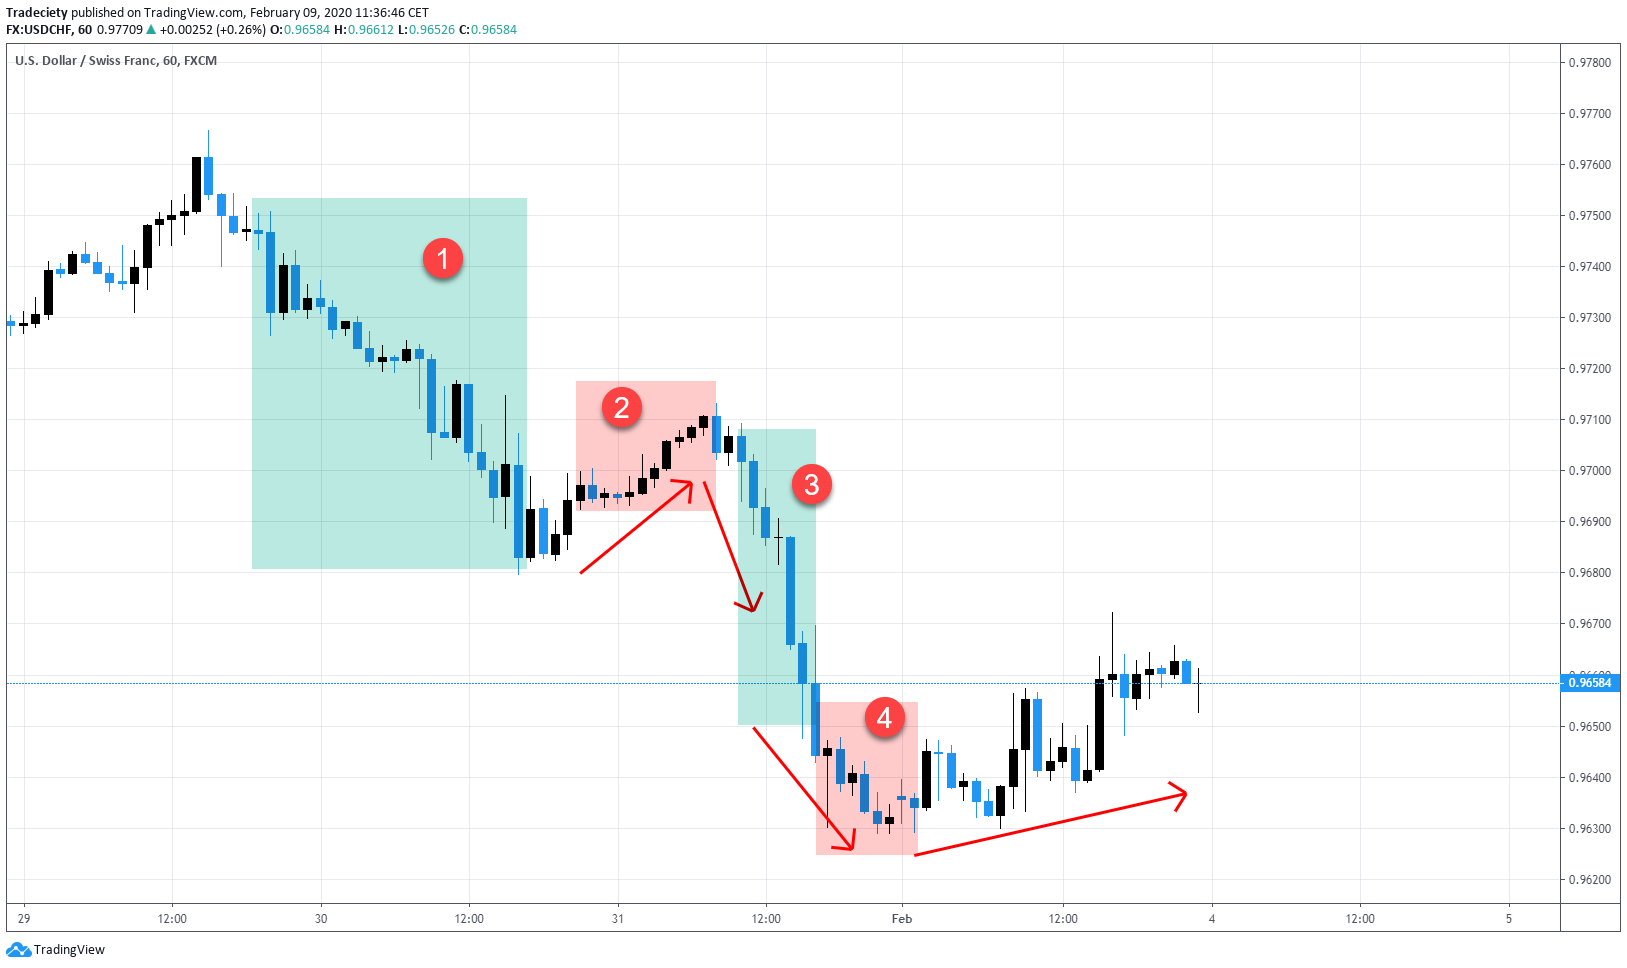
Candle size and the distribution between bullish and bearish candles are concepts that most traders brush over. But although it is one of the most basic ways of analyzing price, it tells you everything you need to know.
During phase (1), the price was in a strong downtrend and we can see many more bearish candles that are also significantly larger than the bullish candles. During phase (2), the price tried to start an uptrend but the candles were relatively small, compared to the previous downtrend. This price behavior does not look convincing at all and the bearish powers quickly took over the market and we can see the concept of acceleration during phase (3). As the downtrend continued, the market eventually slowed down and we can see the concept of deceleration during phase (4).
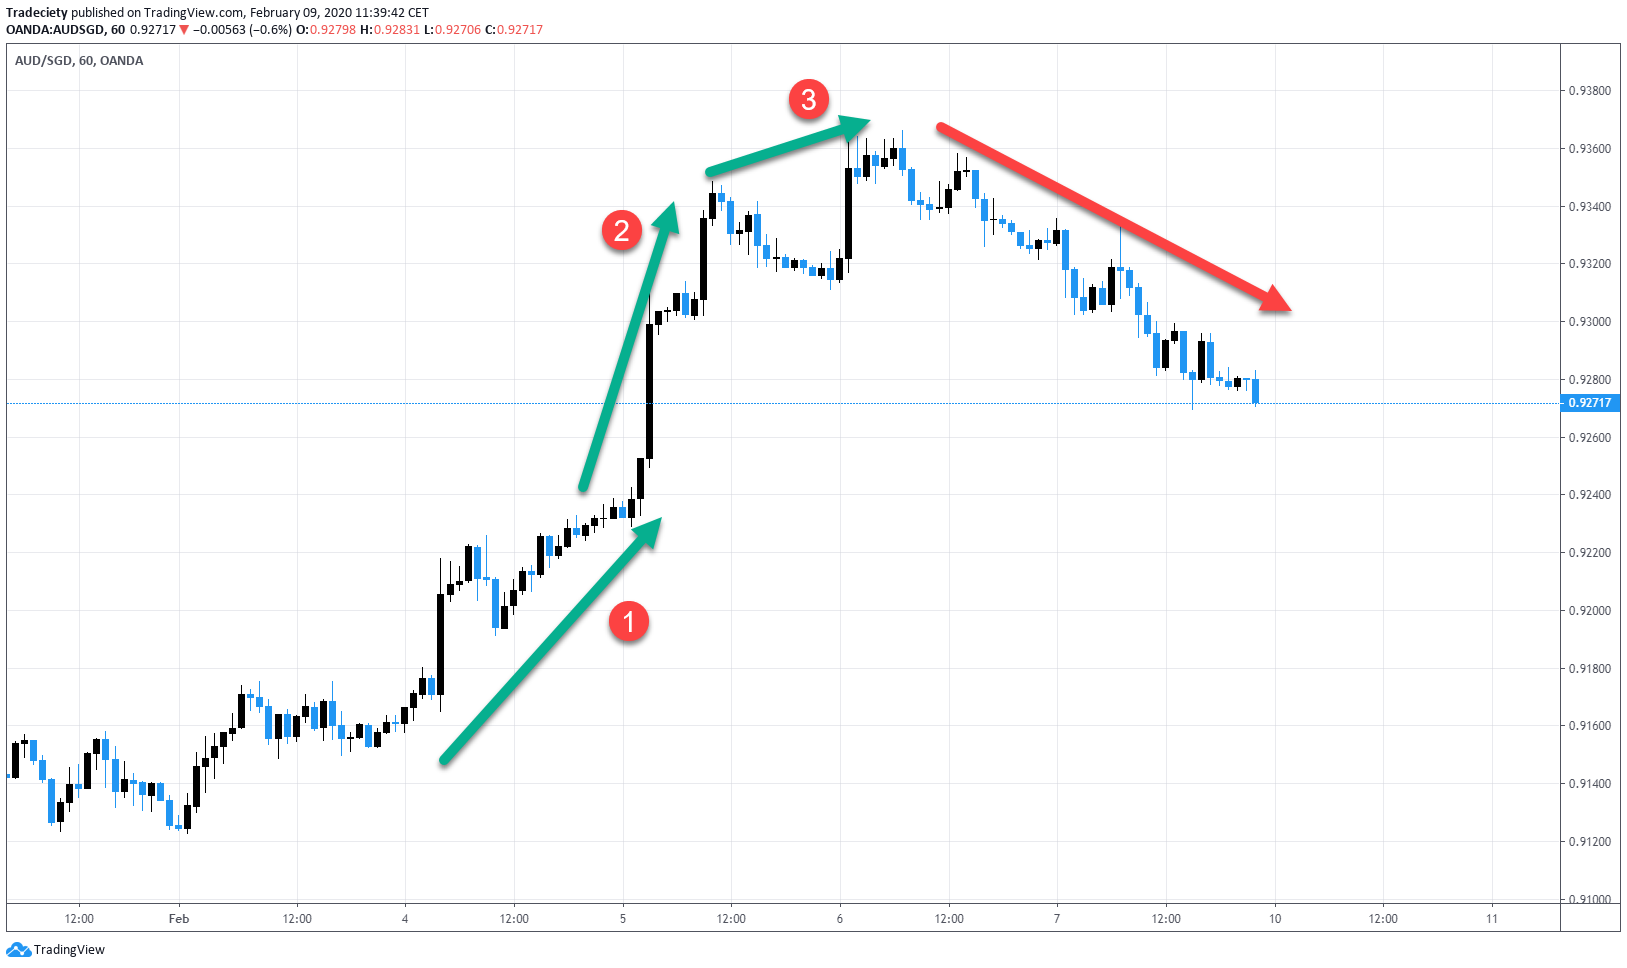
When looking at price divergences, we look at price waves and especially at the length of price waves and how easily new trend waves push into new highs and lows.
We can see the concept of a price divergence in the scenario below. Whereas the price pushed higher with a steep uptrend at price waves (1) and (2), the price showed significant weaknesses during wave (3). Price wave (3) is much shorter and also the price wasn’t able to make a significantly higher high. This loss of momentum indicates that the uptrend may be over soon. In this case, the market completely rolled over and started a new downtrend.
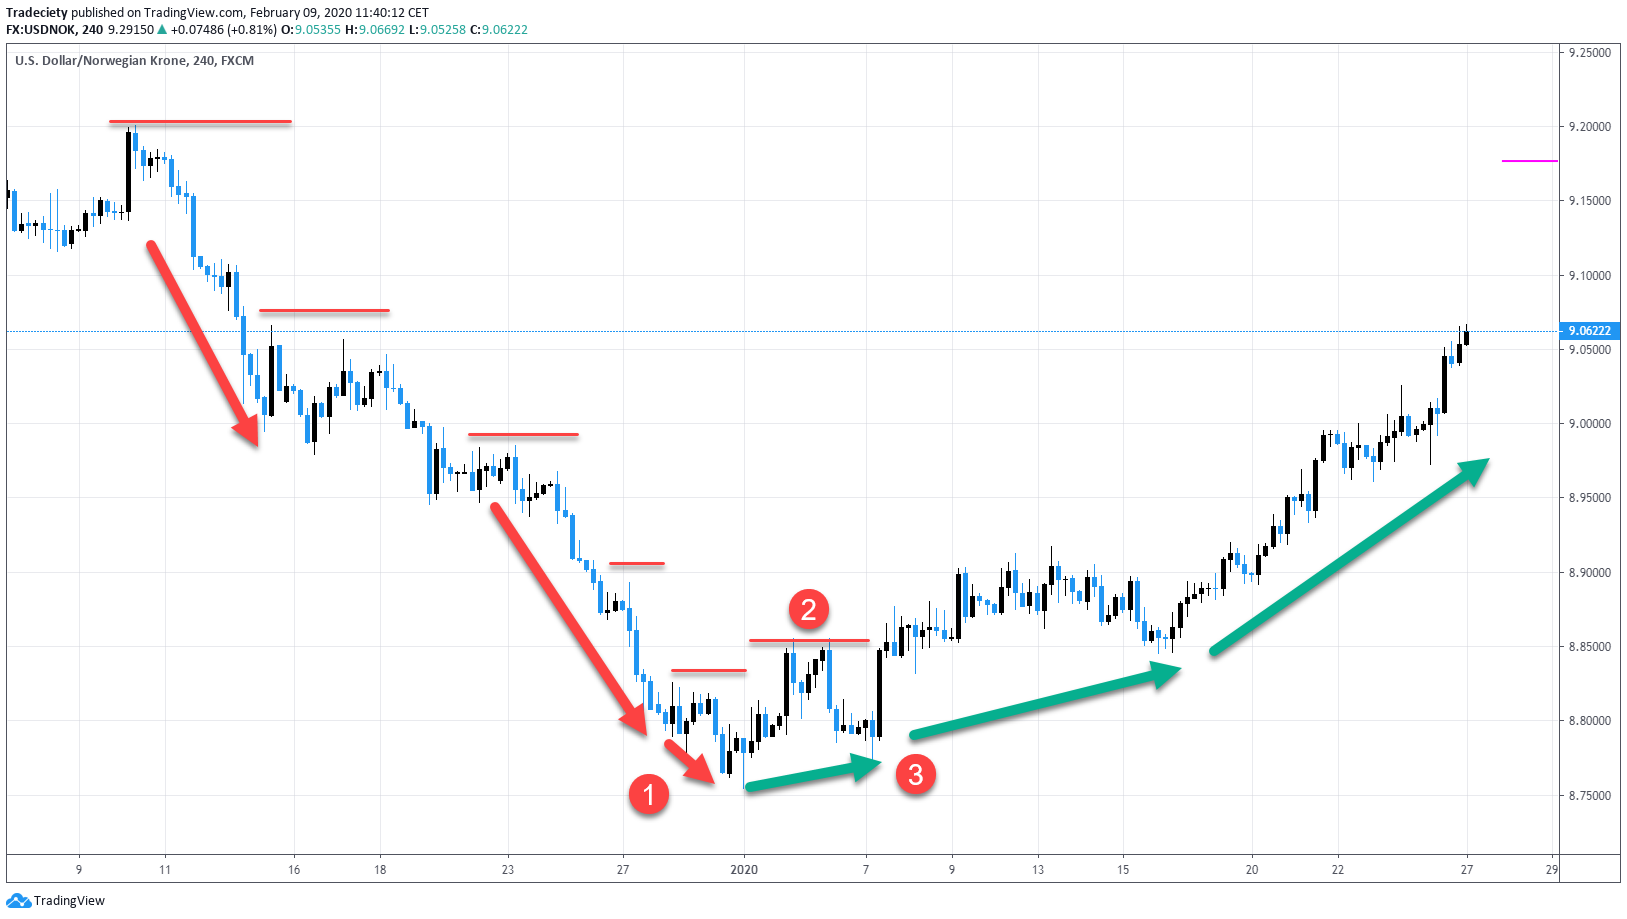
On the left, we can follow the downtrend. At all times did the price make lower highs as indicated by the thin red horizontal lines. When we look at the price waves, we can see that the price first slowed down at point (1). The final bearish trend wave was very short and just barely made a new lower low. This is a clear sign of a loss in momentum. The price made its first higher high at point (2) and, therefore, broke the previous downtrend structure. The new uptrend was further confirmed at point (3) when the price made its first higher high.
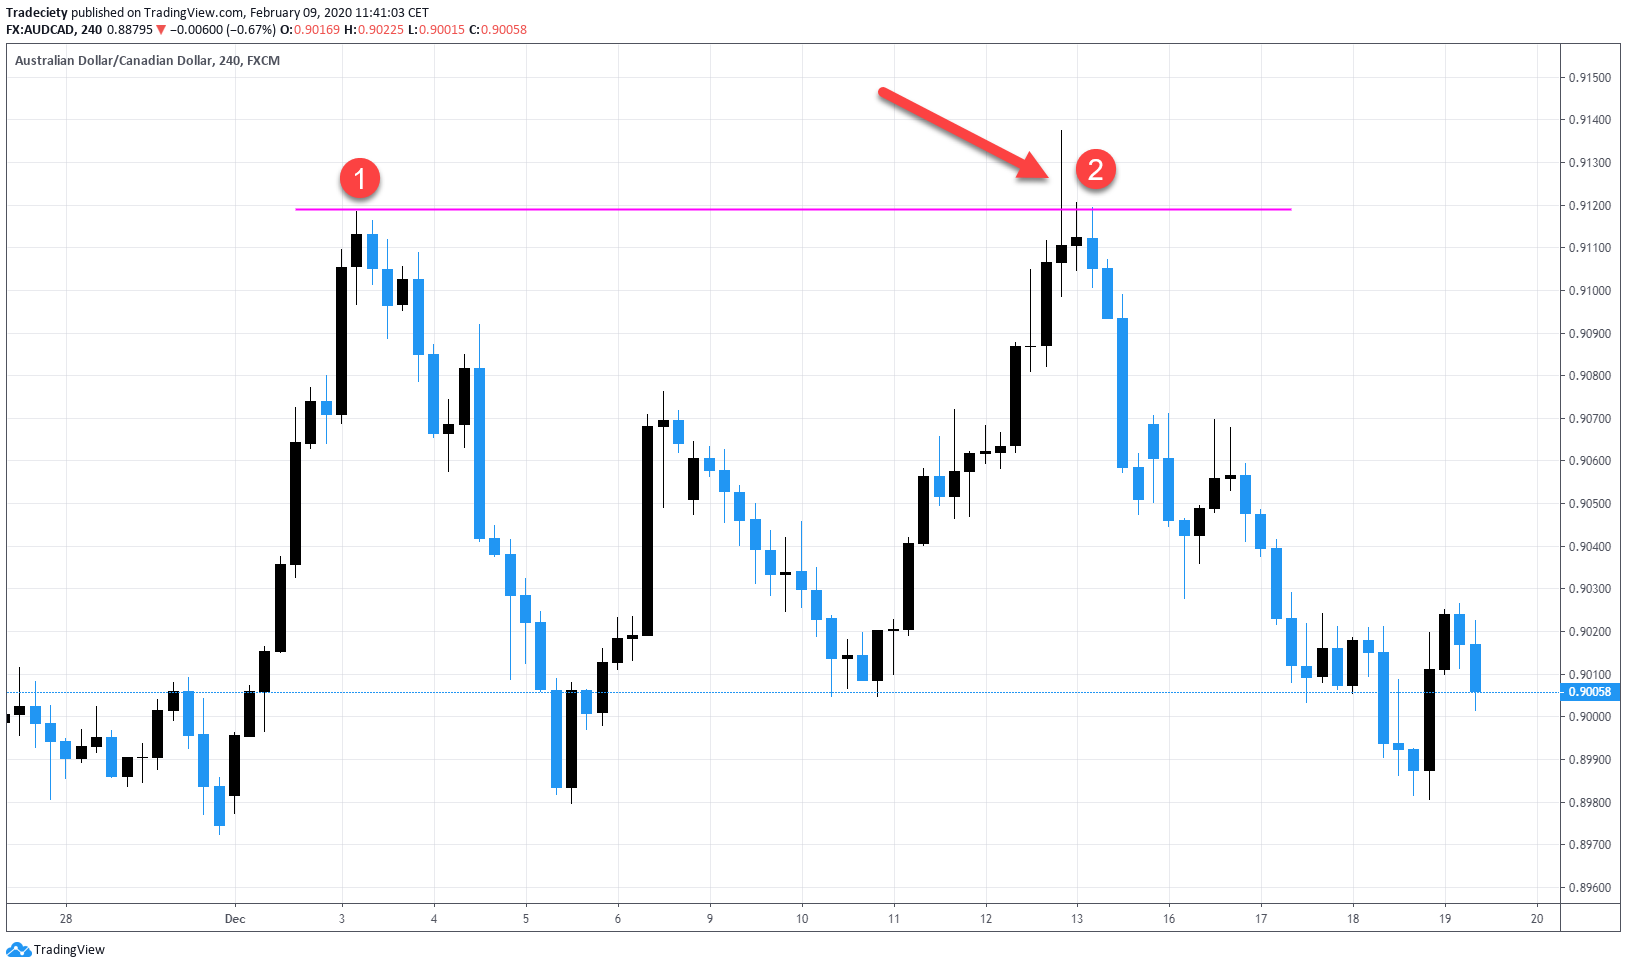
When looking for fake breakouts and fakeouts, we want to first identify major price turning points. Only looking for fakeouts at major turning points in the past can significantly increase the odds of a profitable trade.
In the screenshot below, the price first printed a very strong turning point at (1). The market reversed from a strong uptrend into a strong downtrend on the spot. Now, we wait for the price to get back to the level and if we get a fakeout, we could start looking for bearish opportunities. The pinbar at point (2) took out the previous high. It is very important that you only trade fakeouts where the previous high has been taken out by a significant margin and not just with a short push above the high.
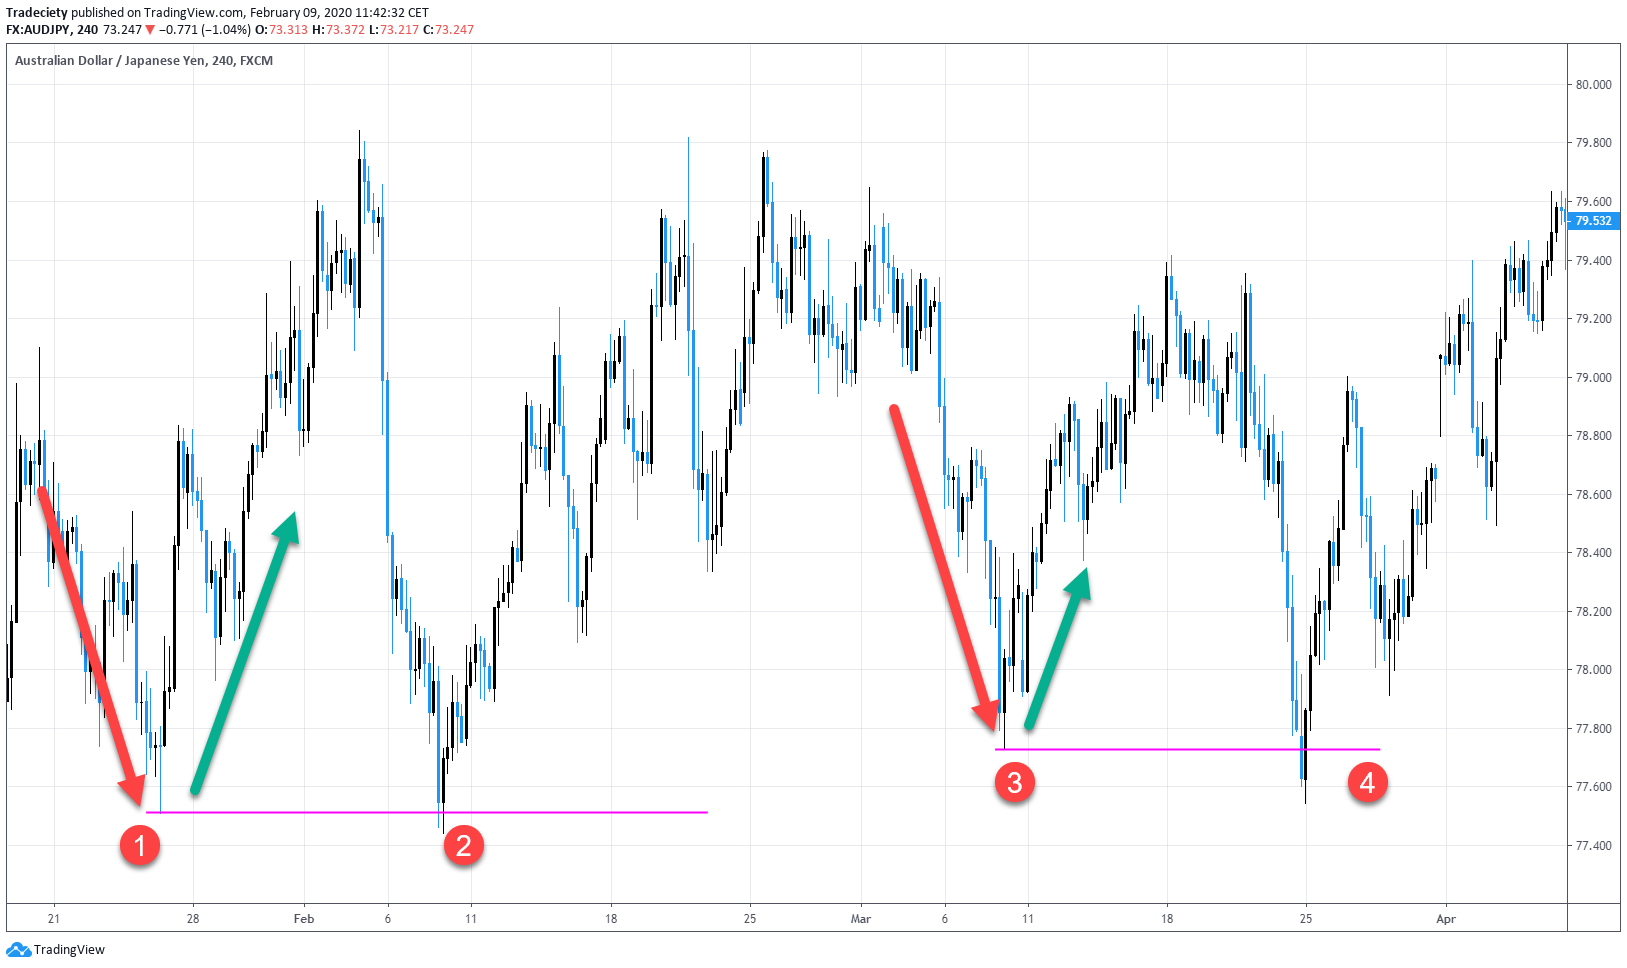
The market provided two significant turning points in the scenario below. At point (1) and (3) did the market reverse from a strong downtrend into a strong uptrend. Start paying attention to those strong turning points as they provide great areas of value on your charts. Both times when the market traded back into the previous turning points overshot the price the lows and immediately fell back above the low, confirming the breakout.
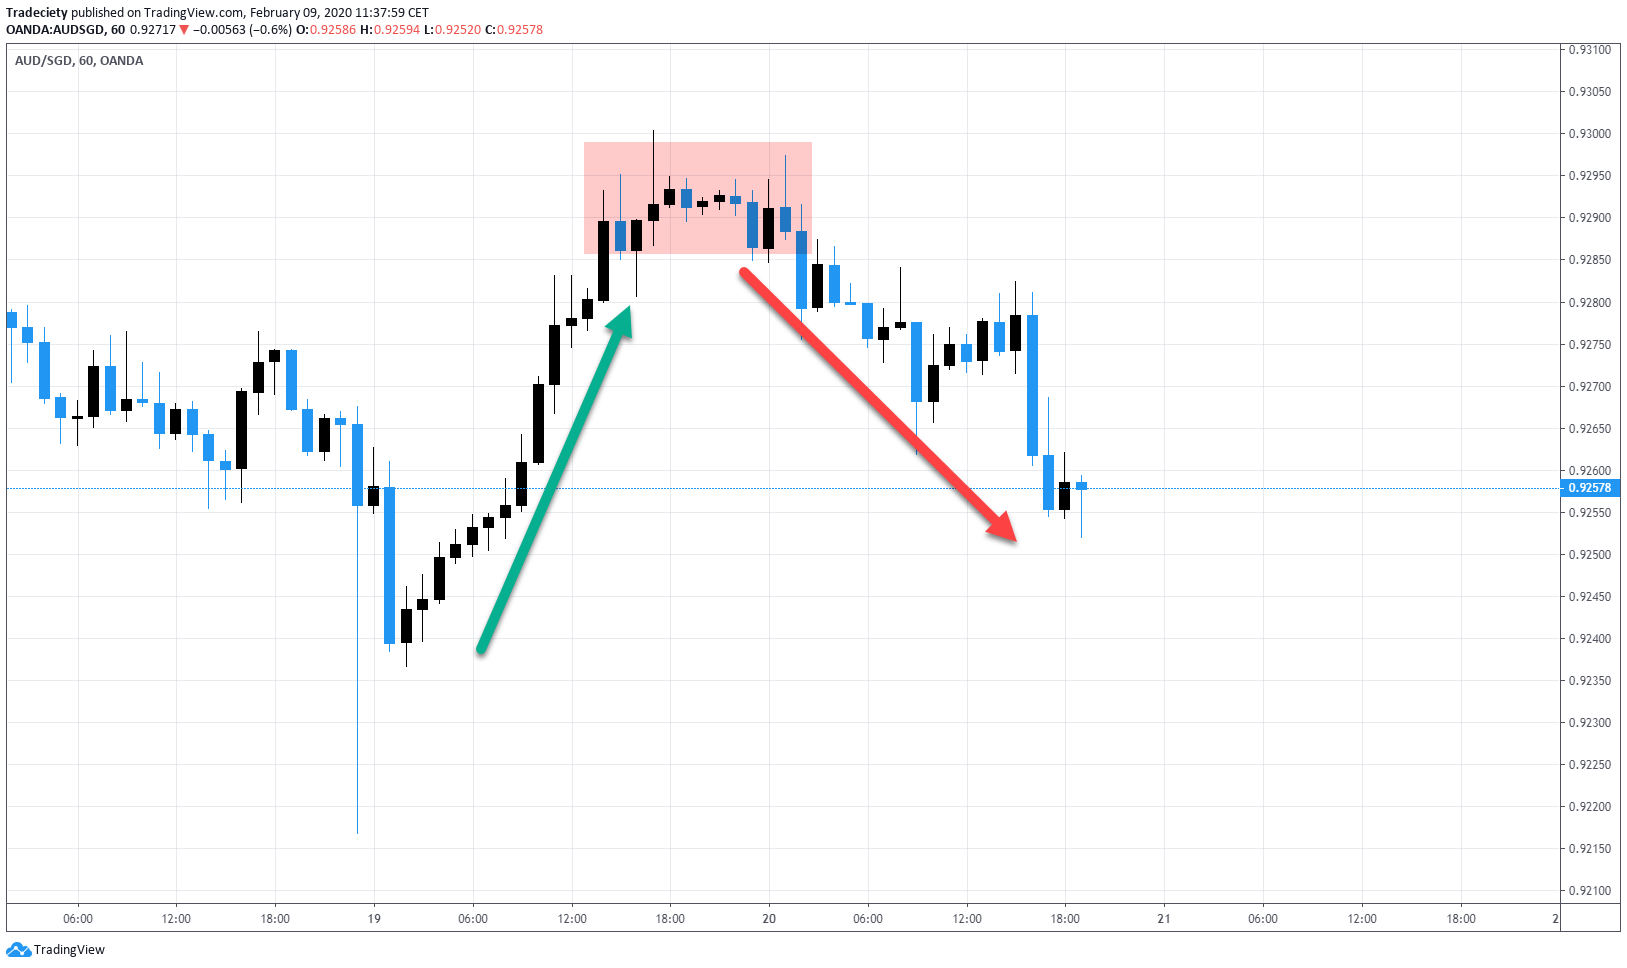
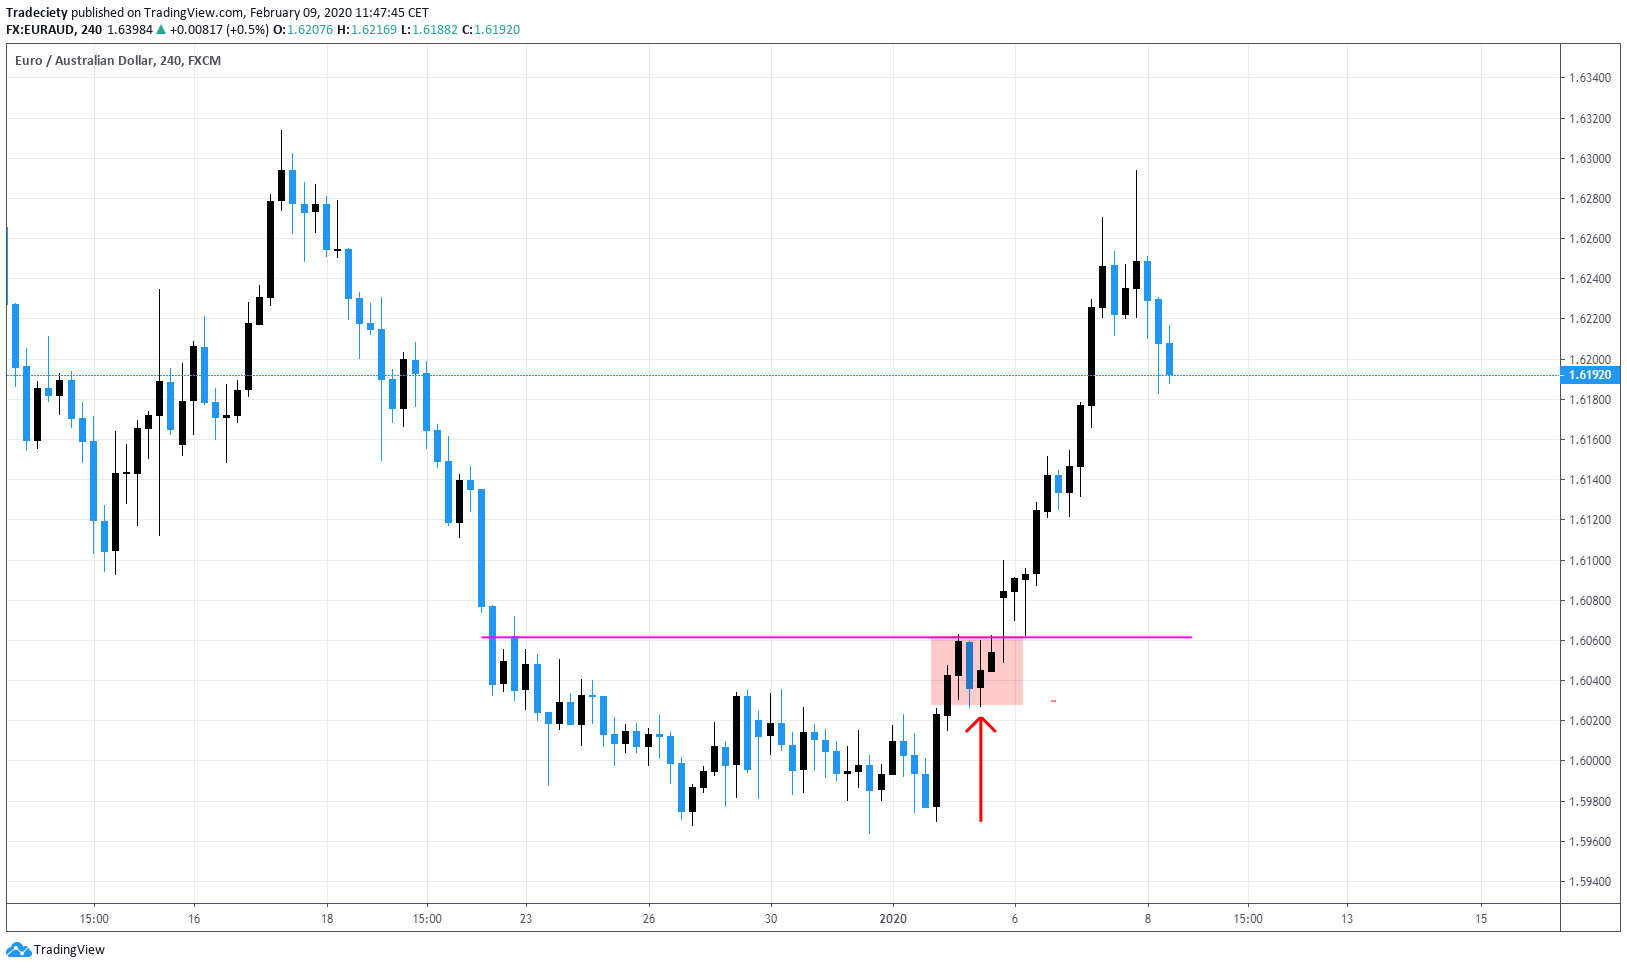
The pre-breakout buildup is one of my favorite trading patterns and it can foreshadow a strong breakout in advance.
Once you have identified a trend that has flattened out, like in the screenshot below, you wait for the price to reach the breakout level. The pre-breakout buildup is then the small retracement before the breakout. This pattern often comes as an inside bar candlestick. Of course, you will never know if a breakout will occur after an inside bar, but if you see a successful breakout that happened after a buildup pattern it can increase the odds for a follow-through.
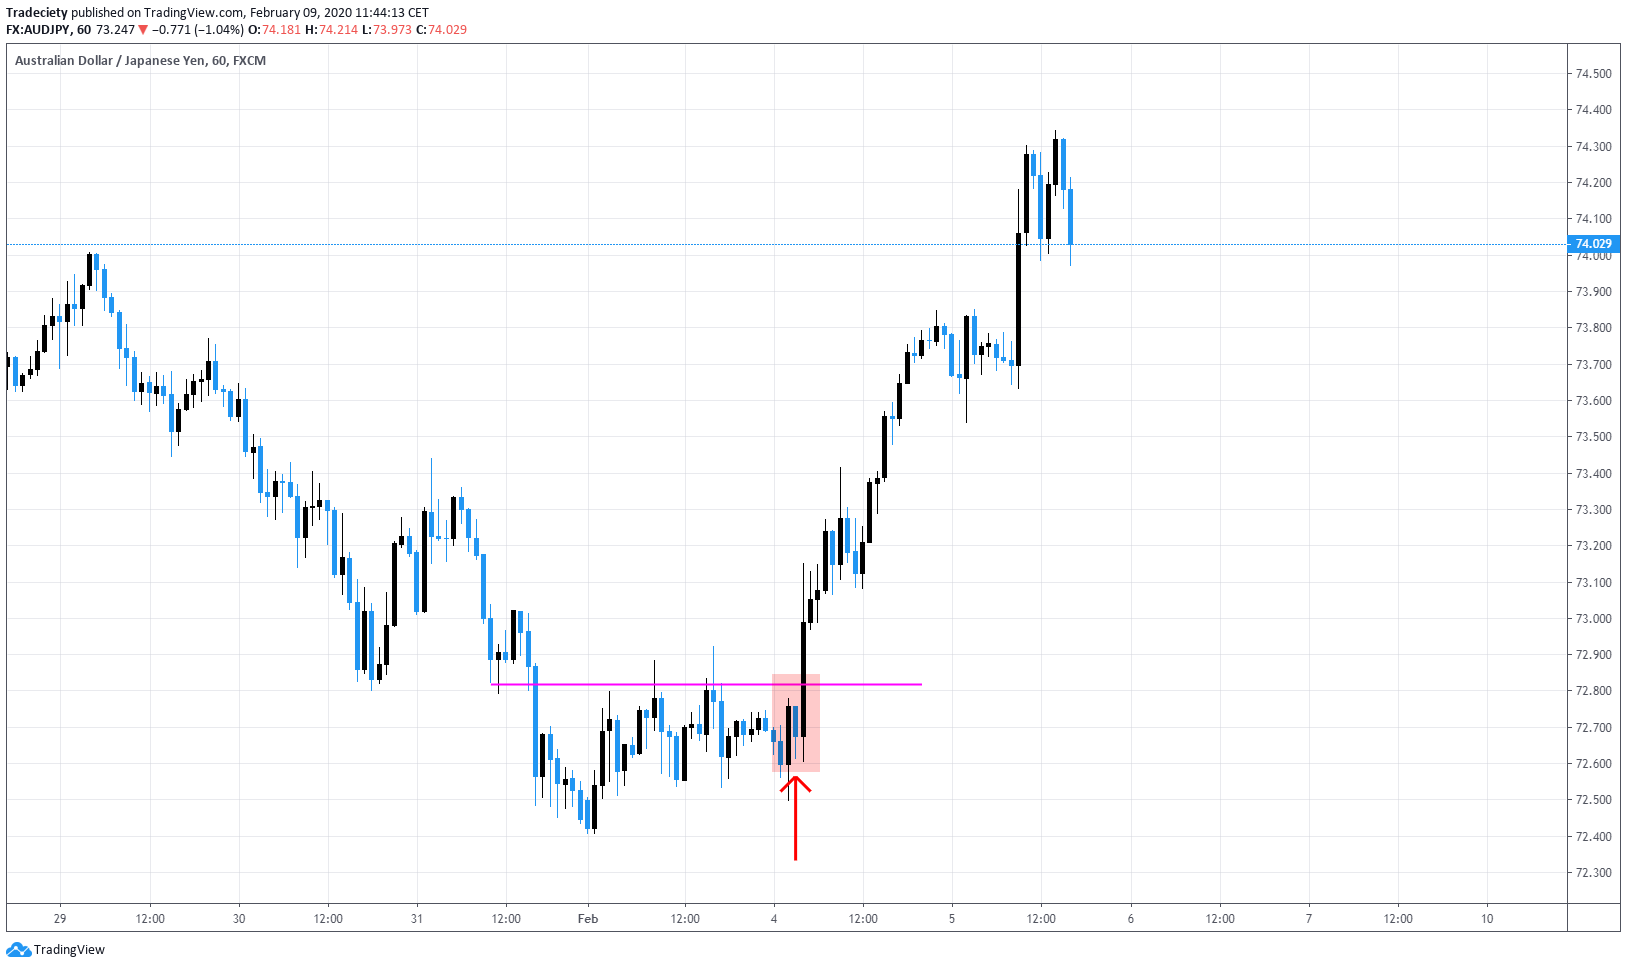
We can see another great example below. And when the price reached the breakout level, there was just a small pullback and the last bearish candle before the breakout was an inside candle that acts as a buildup pattern. The breakout candle was huge and confirmed that the bulls had taken over.
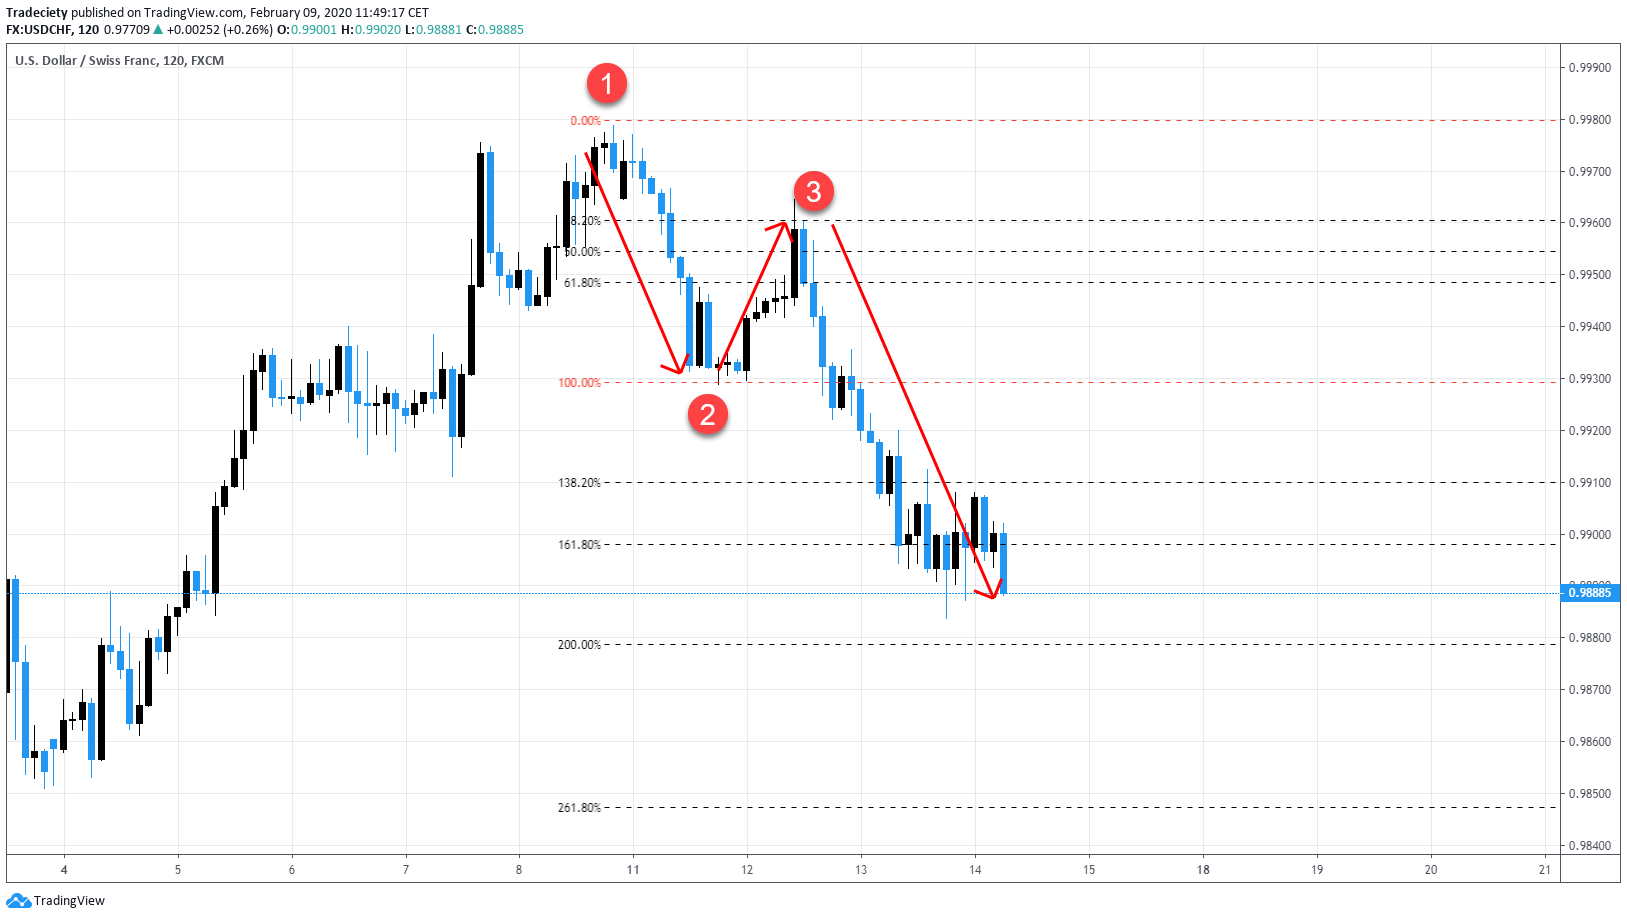
Not just a single price action tip but almost a complete trading strategy by itself, the 1-2-3 pattern is a great setup that we have covered before as well.
The idea is that you look for a trend that is reversing and you then draw your Fibonacci tool on the first trend wave into the new trend direction. So in the screenshot below, the uptrend on the left reversed and when the price made its first downtrend wave with a lower high and a lower you, you draw your Fibonacci tool from point 1 to point 2. The Fibonacci retracement provides a clear lower high at point 3. The idea of this setup that that if the price breaks below the 100 Fib level, there is a high likelihood of seeing a follow-through for the price to reach the 161 or 200 Fib level when the new trend continues.
We can see the 1-2-3 at work in the scenario below as well. The downtrend on the left reversed and when the price made its first higher low (point 2) and lower high (point 3), we draw our Fibonacci to see if the levels line up. We get a clear Fibonacci retracement to point (3) and after the price broke the 100 level, the trend easily continued until the 161 Fibonacci extensions.

Now it is up to you. You can combine different trading tips to form a complete trading strategy. Add to that our tips for stop loss placement and you almost have a robust trading strategy that can be applied to any market and to any timeframe.

external link:


We have been trading supply and demand strategies for over ten years, and they have stood the test of time remarkably well. Supply and demand is...

3 min read
Choosing the right trading journal is essential for traders wanting to analyze performance, refine strategies, and improve consistency. In this...

3 min read
“95% of all traders fail” is the most commonly used trading related statistic around the internet. But no research paper exists that proves this...