Supply and Demand Trading in 2026
We have been trading supply and demand strategies for over ten years, and they have stood the test of time remarkably well. Supply and demand is...

It’s a fine line between using too many things on your charts and having charts that are too empty. Obviously, if you use too many indicators or signals, you will struggle because of “paralysis by analysis” and getting into trades becomes increasingly hard. But trading with completely “naked” price action charts should be avoided too because you need reference points and something that you can use for confirmation and confluence.
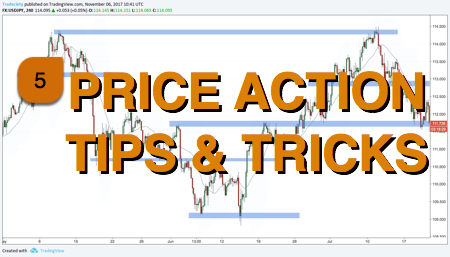
In this article, I want to show you 5 simple and SUPER powerful price action tips how you can analyze, understand and trade every price action chart. In my own trading, I keep things very simple and I focus only on what is absolutely necessary so that I can make the best possible decisions fast and correctly.
Every good price analysis should start by analyzing the trend structure. For that, we can follow the classic Dow Theory which states:
An uptrend is intact as long as price keeps making higher highs and higher lows (and vice versa for a downtrend).
It does sound very simple and maybe even too simple you might say but I challenge you to try it out. Strip down your charts and start following the Dow Theory principles of trend structure.
As a trend following trader you can keep looking for entries into the direction of the trend and when the trend structure is broken, it’s time to get out and look for a new trend.
Buying dips during the uptrend might be an option here. Or, in my trading, I look for reversal signals into the new trend and then ride new trends from the beginning on when the trend turns.
Being able to read momentum from your price action charts can be very helpful and many indicators use momentum information as well (RSI, MACD, CCI, Stochastic, etc). So being able to understand momentum without having to look at indicators can give you an edge when you can find the signals early.
When we talk about momentum, we mean the trend strength. For that we look at candle size, the ratio between candle wicks and bodies and the ratio between bullish and bearish candles. A few points that will help you understand momentum:
Below we can see that during the first half of the chart, the bulls were in control. Candles were mostly green and the bullish candles were also much larger. At the top things shifted and we suddenly started to see strong bearish candles.
Finding confluence areas on our charts can be very helpful when looking for turning points or breakouts into new trends. In my trading, I mainly use support/resistance or supply/demand to identify such high impact areas.
I look for obvious swing highs and lows and multi-touch support and resistance. Then, I use my own setups and signals to time trades according to my strategy.
I just drew a few support and resistance zones into the price chart below and you can see how those help us make much more sense of charts. We can clearly see how price struggles at the same areas and how breakouts can lead to great new trades.
It’s important that you don’t let your charts become too messy and I always recommend to only look at the most recent price action and only focus on the biggest levels. Many amateurs use too many zones and go back way too long.
There are dozens of price action structures and patterns out there but I focus only on a handful. For me, one of the most important ones is the Head and Shoulders and I have talked about this pattern many times here on our blog.
It’s among the most powerful signals and it really pays off to study this pattern in depth. By analyzing different head and shoulder patterns you will learn so much about price action and how the markets move.
Here is where everything comes together and rejections are a combination of everything that we have learned so far:
In my own trading, one pattern is based off rejections completely and they can be great trading signals.
You can see, each point by itself sounds very simple and you have probably heard about the price action tips before. But by combining all the clues together, you can form strong trading signals and find great trades.
Price action analysis then becomes quite simple and the best trades will jump at you right away.
So, my challenge for you is that you should audit your trading and check where you can simplify your approach, add a few of the principles which I explained here and then create your own simple and powerful trading strategy.

We have been trading supply and demand strategies for over ten years, and they have stood the test of time remarkably well. Supply and demand is...

3 min read
Choosing the right trading journal is essential for traders wanting to analyze performance, refine strategies, and improve consistency. In this...

3 min read
“95% of all traders fail” is the most commonly used trading related statistic around the internet. But no research paper exists that proves this...