Supply and Demand Trading in 2026
We have been trading supply and demand strategies for over ten years, and they have stood the test of time remarkably well. Supply and demand is...

When it comes to trading and technical analysis, Oscillator indicators are considered to be a cornerstone for evaluating a currency pair or any other asset class. Oscillators, as the name suggests, oscillate between two fixed values in relation to the actual asset price and help traders gauge the directional movement as well as the strength or momentum. Hence, by using an oscillator indicator, you can figure out if an asset price is going up or down as well as how fast it is going in that direction.
Market analysts have developed a number of popular oscillating indicators. But, not all indicators are created equally and they all have different functions to provide a varied level of information to traders. Some indicators were developed to interpret trending markets and others were meant to identify trading opportunities in a range-bound market condition. Knowing, which indicator to use, and under what circumstances, makes all the difference that separate the successful Forex traders from the rest.
If you are wondering what are some of the best oscillator indicators available and which one would help you yield the best results, then read on. We have compiled a list of the top 5 indicators that you should try out.
The Stochastics indicator measures the relationship between an asset’s closing price and its price range during a particular period since the closing price of the asset would likely stay at the higher end of a day’s range during an uptrend.
Similarly, it would be near the low during a downtrend.
Keeping this principle in mind, the Stochastics indicator measures if the asset price has been trending, losing momentum, or simply trading in a range.
Any experienced trader can figure out a market’s directional movement just by looking at a chart. However, the Stochastics oscillator makes it much easier to interpret the price action.
The Stochastics oscillates between two fixed values, 0 and 100.
When it trades above the 80 level, some traders believe that it indicates that the bullish trend is likely to lose momentum. However, a look into the Stochastic formula confirms that a high Stochastic shows, in fact, a likely continuation.
So, the best way to find a market entry with the Stochastics indicator is looking for long entries after a temporary bearish retracement during an uptrend and a short entry after a bullish retracement during a downtrend. It may sound too complicated at first. Especially, if you are new to technical analysis and have little experience with trading divergences. But let’s take a look at an example and you will realize it is a rather straightforward concept to grasp.
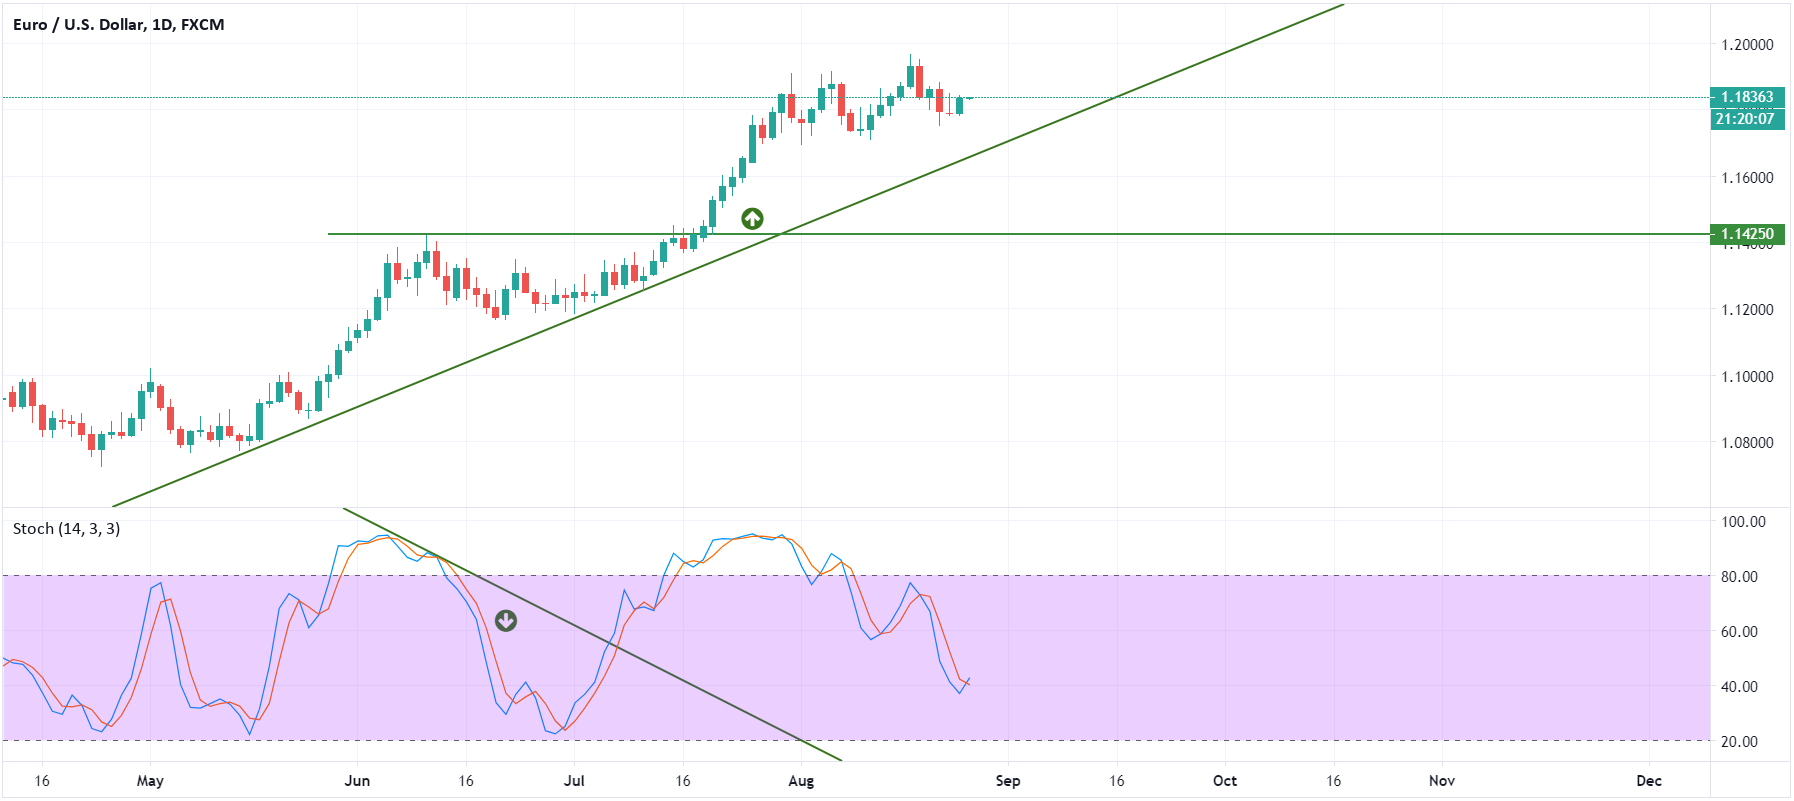
Figure 1: Stochastics Bullish Divergence
In figure 1, we can see that the EURUSD has remained in a sustained uptrend and respected a trend line. But, from the second week of June 2020 till the end of the month, the bullish momentum faded and the price gradually drifted lower towards the trendline. At the same time, the Stochastics indicator was going down and the reading reached as low as 22 by the end of June. This constituted a perfect bullish divergence and a buying opportunity as a pullback trade.
Just like the Stochastics, the Relative Strength Index (RSI) oscillates between the 0 and 100 values. However, the overbought and oversold level are usually set at 70 during an uptrend and 30 during a downtrend. Besides this, the way to interpret the Stochastics is almost identical to the Stochastics indicator.
While both Stochastics and RSI are considered to be momentum oscillators, the RSI works best during a trending market as a reading above 50 signals an overall uptrend and vice-versa.
The trick with the RSI is to look for potential support and resistance level first and then finding market entry opportunities. To do so, instead of focusing on level 50, we can draw two additional lines, 40 and 60 on the RSI window.
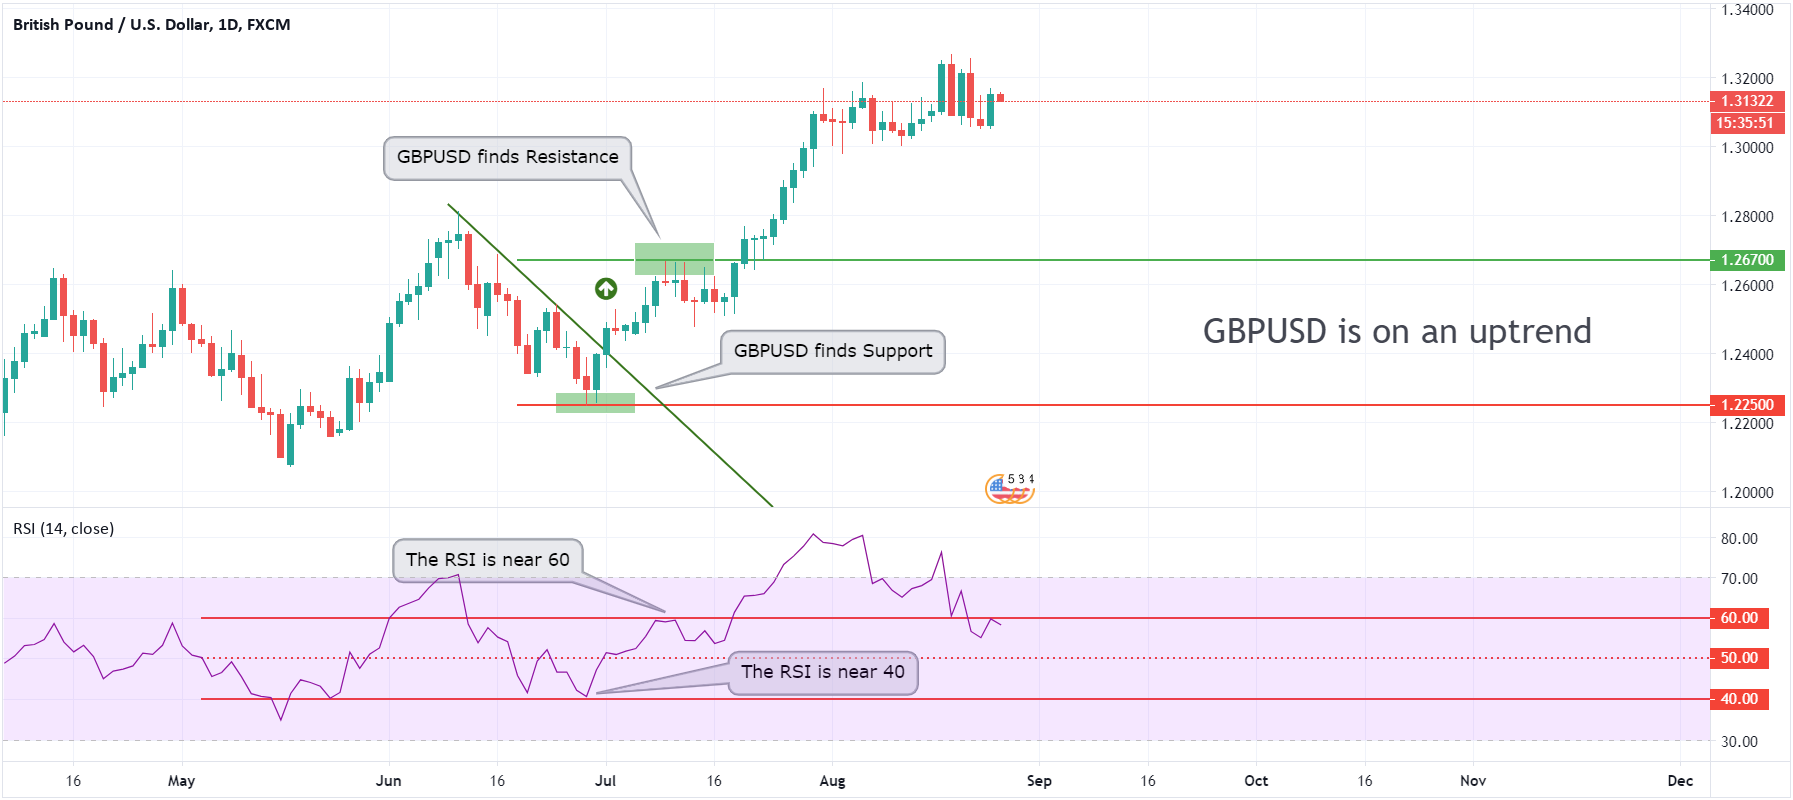
Figure 2: RSI Finds Support and Resistance Near the 40 and 60 Levels
In figure 2, we can see that the GBPUSD found support and resistance when the RSI reading reached near the 40 and 60 levels, respectively. If you did not know where the support and resistance levels will likely form, watching price action when an asset’s RSI readings are near these levels can help you confirm a change in the existing direction of the price. Armed with this information, you can either watch for Candlestick patterns or trendline breakouts to find a market entry.
The Commodity Channel Index (CCI) has the look and feel of the RSI indicator. But, the underlying mathematical formula, as well as the application is completely different.
While the RSI oscillates between 0 and 100, the CCI has no upper or lower limit.
Instead, the indicator, under normal market conditions, fluctuates between -100 and +100 levels. When it remains within this normal range, it signifies that there is a lack of a strong trend in the market and signals that the asset price will likely remain range-bound.
By contrast, a reading above +100 indicates a strong uptrend and when it goes below the -100 level, it signals a strong downtrend.
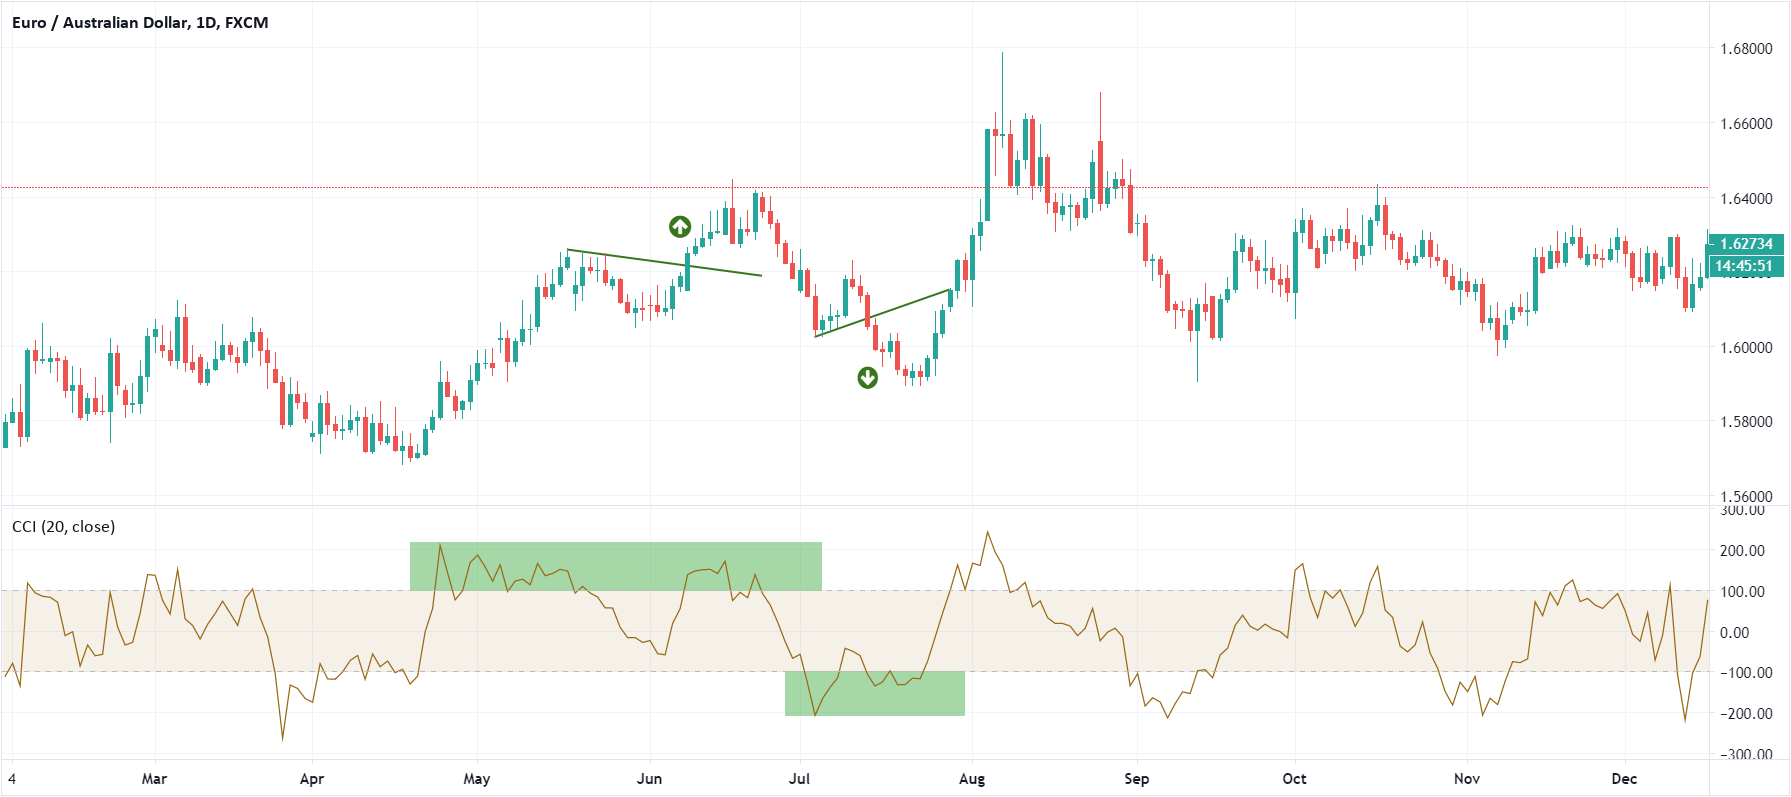
Figure 3: Trend Identification with the CCI Oscillator and Market Entry with Trend Line Breakout
The easiest way to find market entry opportunities with the CCI would be combining it with price action based technical analysis, such as trendline breakouts.
In figure 3, you can see that when the EURAUD CCI readings went above and below the +100 and -100 levels, it signaled strong trends. In both cases, the CCI eventually moved back in the normal range between -100 and +100. However, when the trends resumed and broke the respective trend lines, it yielded some handsome profits.
To further refine this strategy, you can also combine it with multiple timeframe analysis that would help you identify entry opportunities much earlier.
The first three oscillators we discussed all use line charts to represent the reading. But the Moving Average Convergence Divergence (MACD) indicator is a completely different beast as it combines two Moving Average Crossover with Histogram to gauge the strength of the momentum.
The two lines of the MACD represent a 12-period EMA and a 26-period Exponential Moving Average (EMA). When the shorter period EMA crosses the longer period EMA, it signals a change in trend, just like a typical MA crossover. But, what makes MACD truly standout is the histogram that measures the distance between these two EMAs. When the histogram is above the 0 line and increasing, it signals an uptrend that is gaining momentum. On the other hand, when the histogram is below the 0 line, it signifies that the downtrend is gathering strength.
Unlike the Stochastics, RSI, or CCI, there are no predetermined overbought or oversold levels in the MACD oscillator. However, the trick is to compare the highs and lows in MACD to price action in relation to previous high and lows. In doing so, you can easily find convergence and divergence.
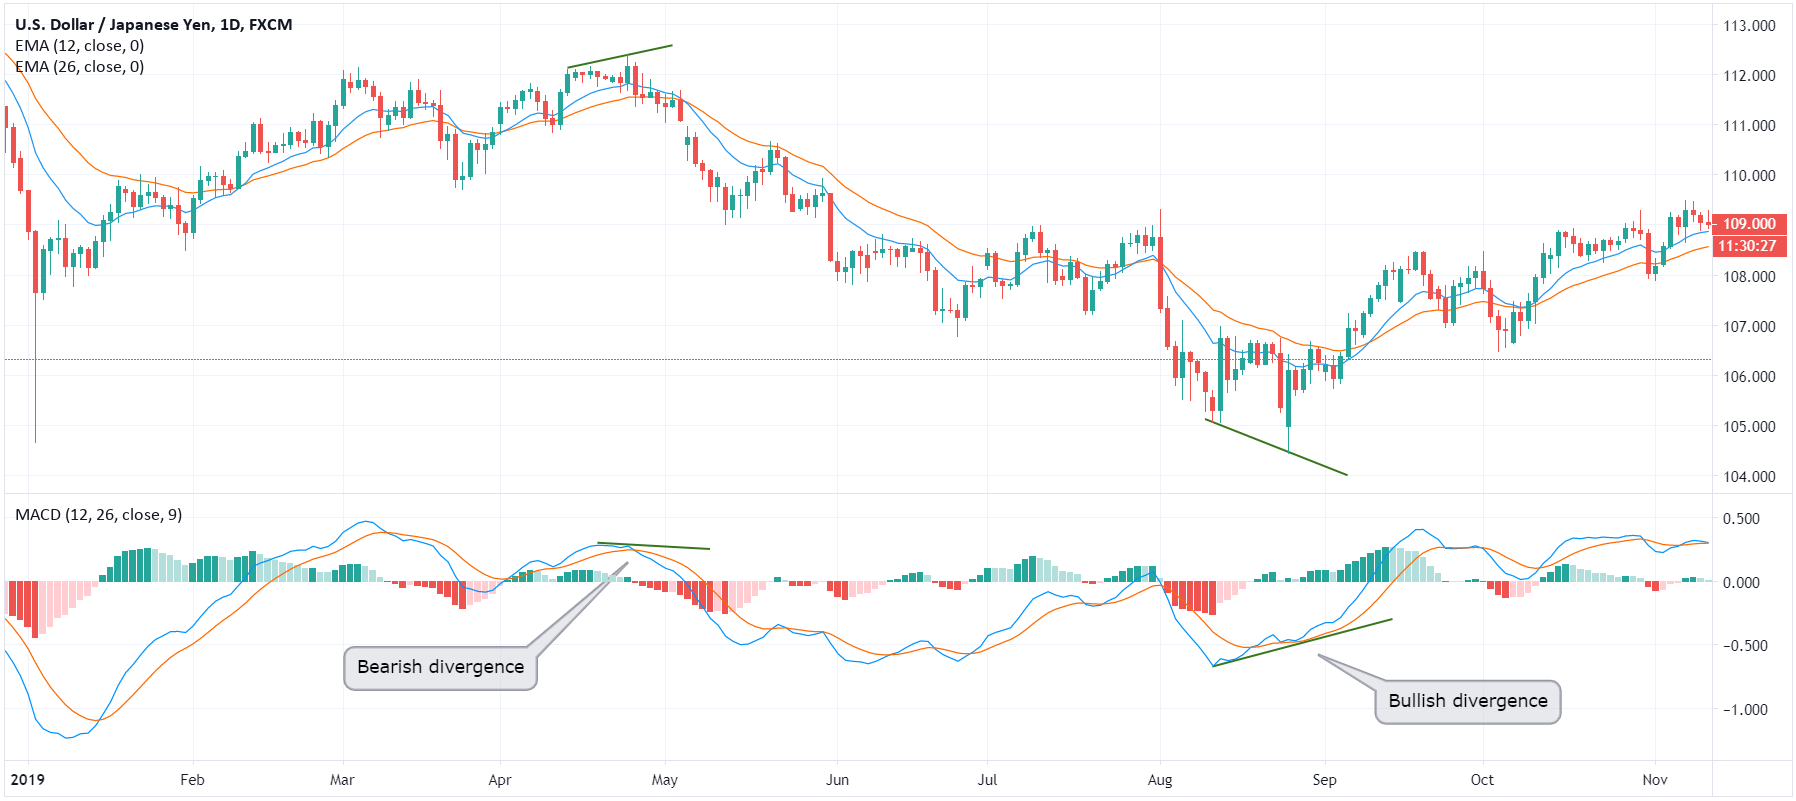
Figure 4: MACD Contrarian Divergence Market Entries
The best way to use the MACD to find a market entry opportunity is to be a contrarian. It means looking for long opportunities when the MACD signal line is way below the 0 level and produces a buy signal. By contrast, you should look for a sell signal when the MACD signal line is trading far away above the 0 level. And, if you find a divergence, it will only improve the chance of a windfall, as demonstrated in figure 4.
The Awesome Oscillator (AO) was created by the famous trader Bill Williams to measure the difference between the latest 5 periods Simple Moving Average (SMA) and 34 periods SMA. It is plotted as a histogram, like the MACD. Simply put, when the histogram is above the zero line and increasing, it signals that bullish momentum is increasing. When the histogram is below the 0 line and decreasing, it signals that bearish momentum is increasing.
Most traders use the AO zero line crossover when the histogram goes above or below the 0 line from the other side, as a signal for change in predominant trend. But if you use the AO as a standalone indicator this way, you will likely find many false signals. The best way to use the AO indicator is called the Twin Peak strategy, which is a fancy term that basically describes trading divergence.
The important thing to remember that bearish Twin Peaks occur above the 0 line and bullish Twin Peaks occur below it.
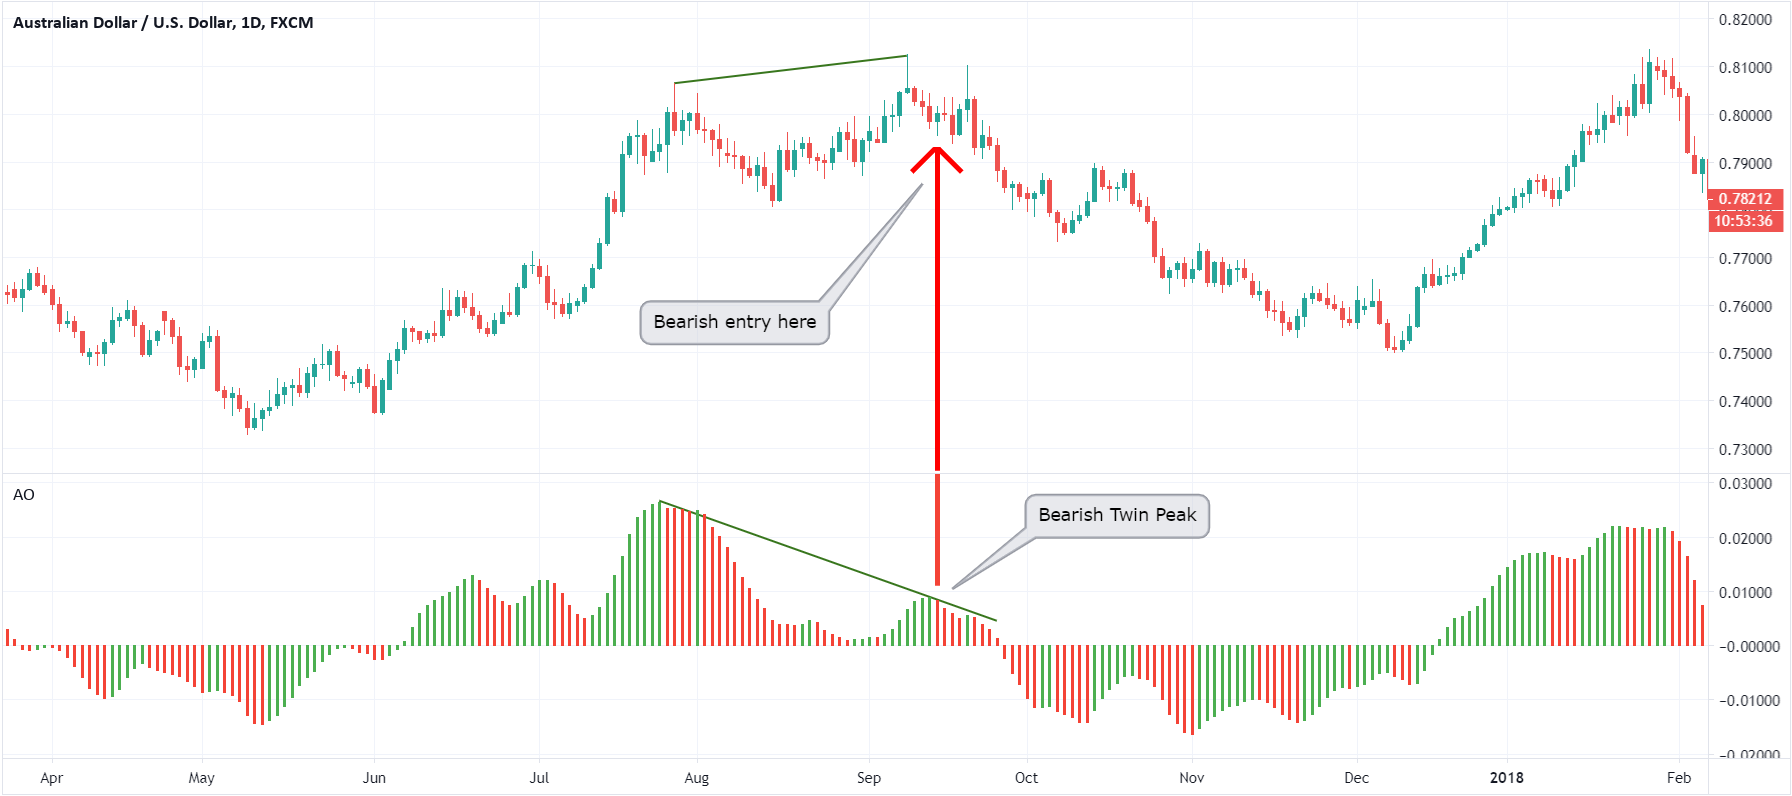
Figure 5: Awesome Oscillator Bearish Twin Peak Market Entry
To enter the market with a bearish AO Twin Peak, you need to wait for two consecutive peaks to form above the zero line, where the second peak is lower than the first one. As we can see in figure 5, place a short order when a red line on the histogram appears. By contrast, to trade a bullish AO Twin Peak, you need to wait for two consecutive peaks to occur below the 0 line. On this occasion, the second peak must be higher than the first one. Then, when the first green bar appears on the histogram, enter the market with a long order.
Oscillator indicators are great at finding direction and measuring the momentum of the directional movement of asset prices. But using a single oscillator to find market entries would be too aggressive for even the most experienced technical traders. Instead, we recommend that you combine one of the top 5 oscillators we discussed above with price action, either breakouts or candlestick patterns, to confirm before placing any orders.
external link:


We have been trading supply and demand strategies for over ten years, and they have stood the test of time remarkably well. Supply and demand is...

3 min read
Choosing the right trading journal is essential for traders wanting to analyze performance, refine strategies, and improve consistency. In this...

3 min read
“95% of all traders fail” is the most commonly used trading related statistic around the internet. But no research paper exists that proves this...