Supply and Demand Trading in 2026
We have been trading supply and demand strategies for over ten years, and they have stood the test of time remarkably well. Supply and demand is...
(the transcript has been created automatically via an algorithm – please excuse typos and potential errors in the text)
(01:14):
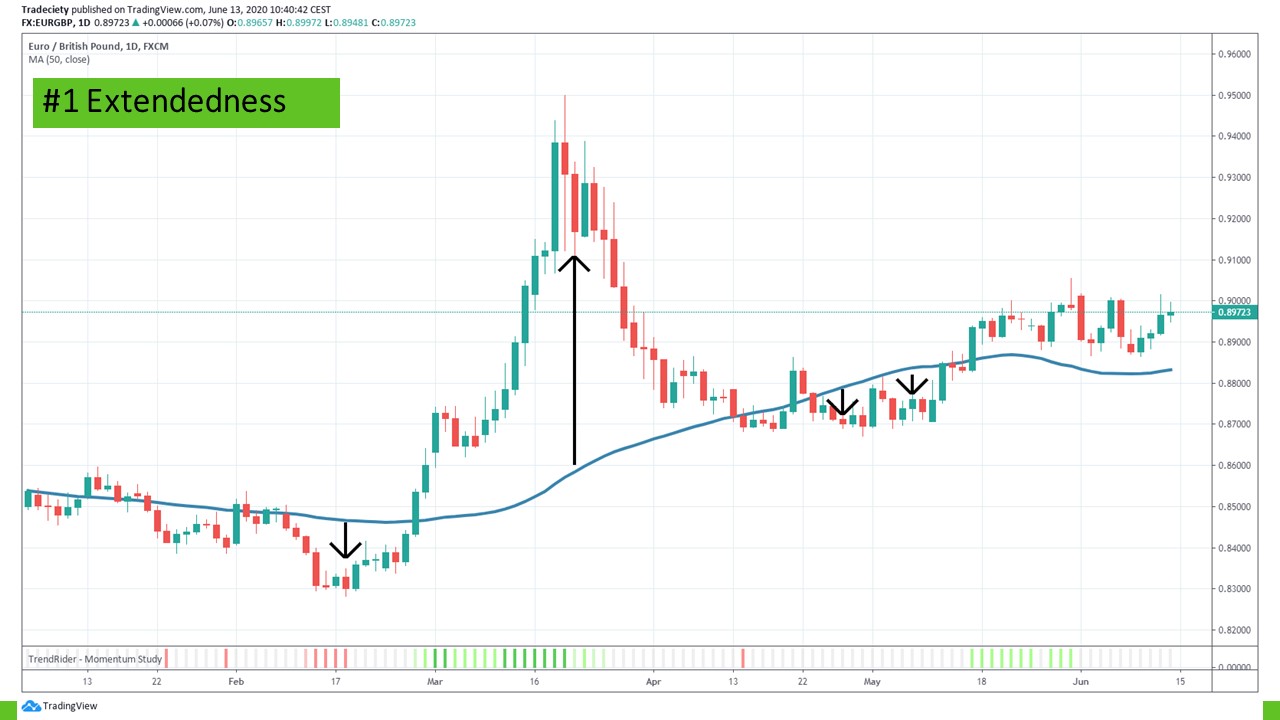
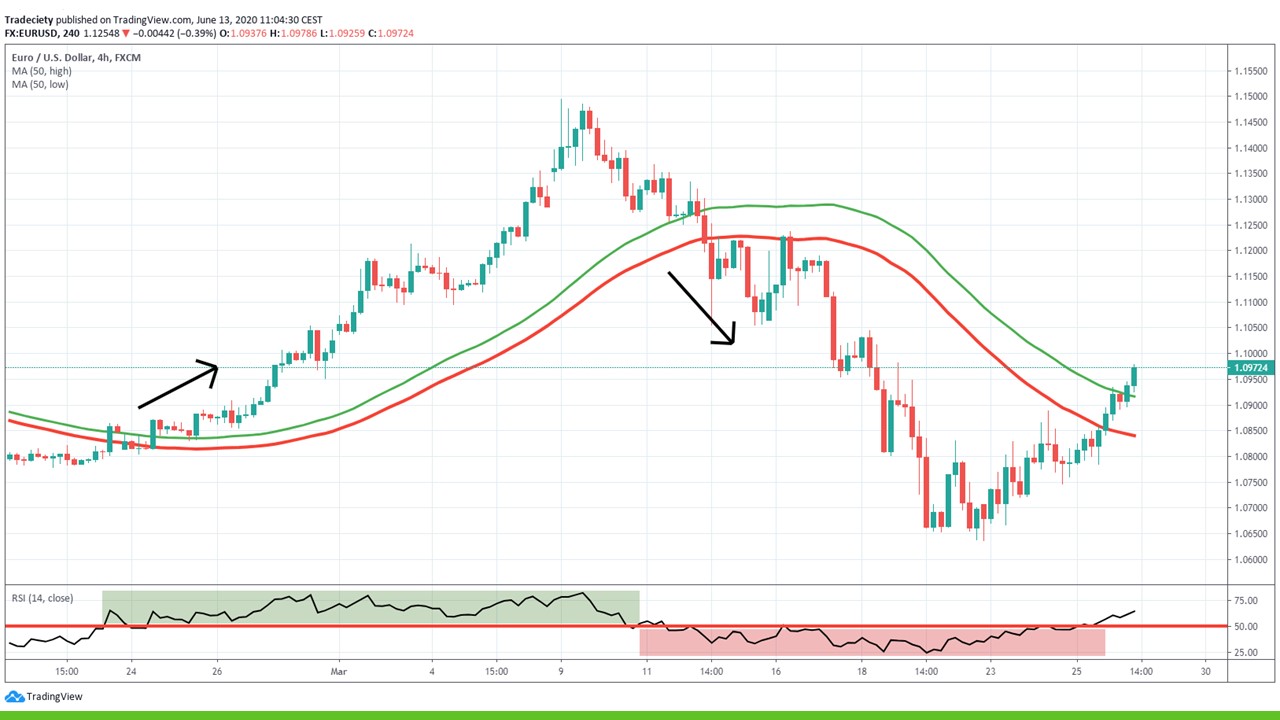
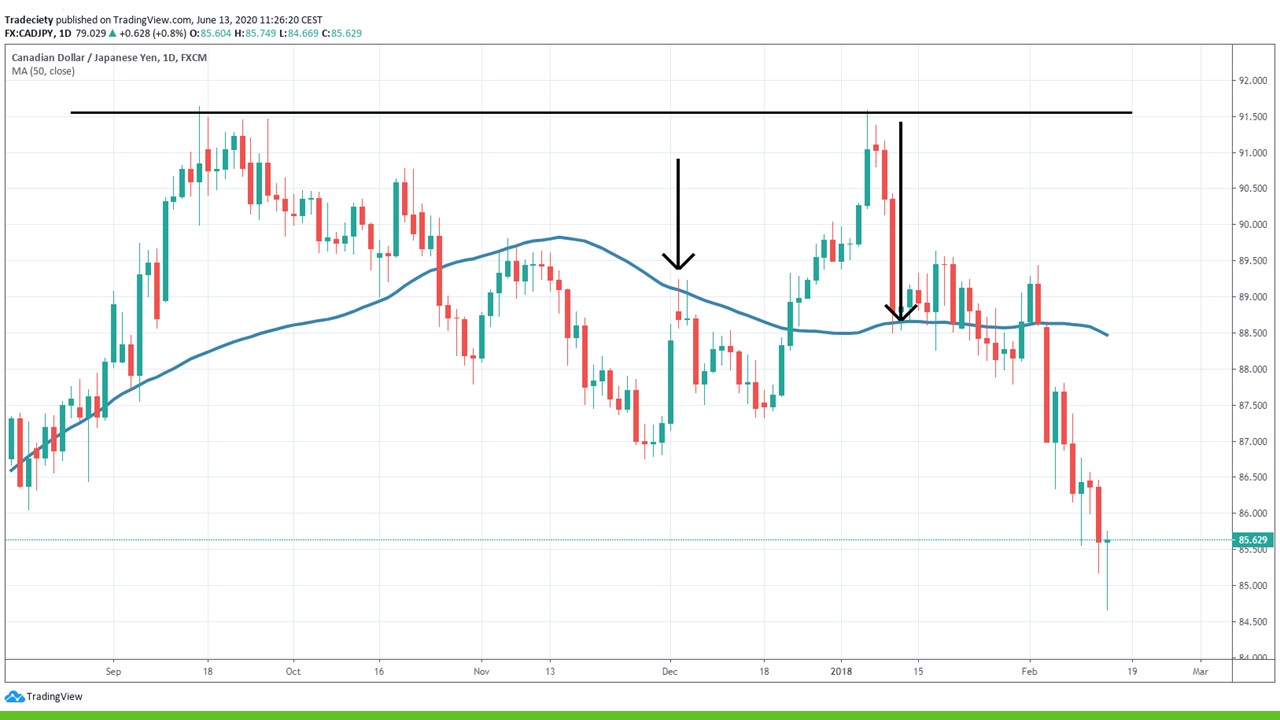
The first concept is called the extendedness of price action. And this has many different implications of how you can use this concept. There are many ways how you can use that. First of all, the most obvious one is that whenever you see that the price action is very far from your central moving average, it means the price is very overextended. Some people may even say that it is oversold or overbought in this case. And the most obvious use cases that you are trading the price action back to the moving average. And this is especially helpful in Forex trading because Forex trading is a mean-reverting market in contrast to stocks, which is generally considered a trending market in Forex. It is much, much more common to see the price fluctuate around a mean, and I use the 50-period moving average. And as an example you can use any moving average, you can use a shorter-term moving average, like the 20, you can use the 100-period moving average for a longer-term approach, but if you are going for somewhere in the middle of the 50, moving average is a good choice.
(02:18):
And what I do in my trading is that I look for scenarios that show me that the price is very overextended. So it’s very far away from the moving average. And then I go to a lower timeframe and then I try to find price patterns and entries, as we will see later that allows you to trade the price action back to the moving average or very close to the moving average. And you avoid scenarios where the market is just fluctuating around the moving average, because obviously then the profit potential when the price is very close to the moving average is not as high as in situations like that. There are obviously other use cases. I know traders who use the moving average as a, as a trend origin. You look for moves away from the moving average in my trading.
(03:10):
I specialize in trading the price action back to the moving average. What I do is I look for situations like in here where the price action is very overextended. It’s very far away from the moving average. It also, hasn’t been back to the moving average in a long time that can help as a, as a, as an additional filter. What you want is that you don’t only want to see the price away from the moving average, but you also want to see a lot of time between the last touchpoints between the moving average and the price action. And then you just look for ways to trade it back on the lower timeframes. And it works exceptionally well. Here are ways how a trader may use a moving average as a pullback approach. When the market is in a trending phase, you look for moves away from the moving average like in here or here or even here or the other traders.
(04:03):
If you use the concept of extendedness, you wait for the price extra to get very far away from the moving average. You wait for signals that could be a divergence as we will see later, or other concepts that we will explore as well in this video. And then you’re just traded back to the moving average.
(05:01):
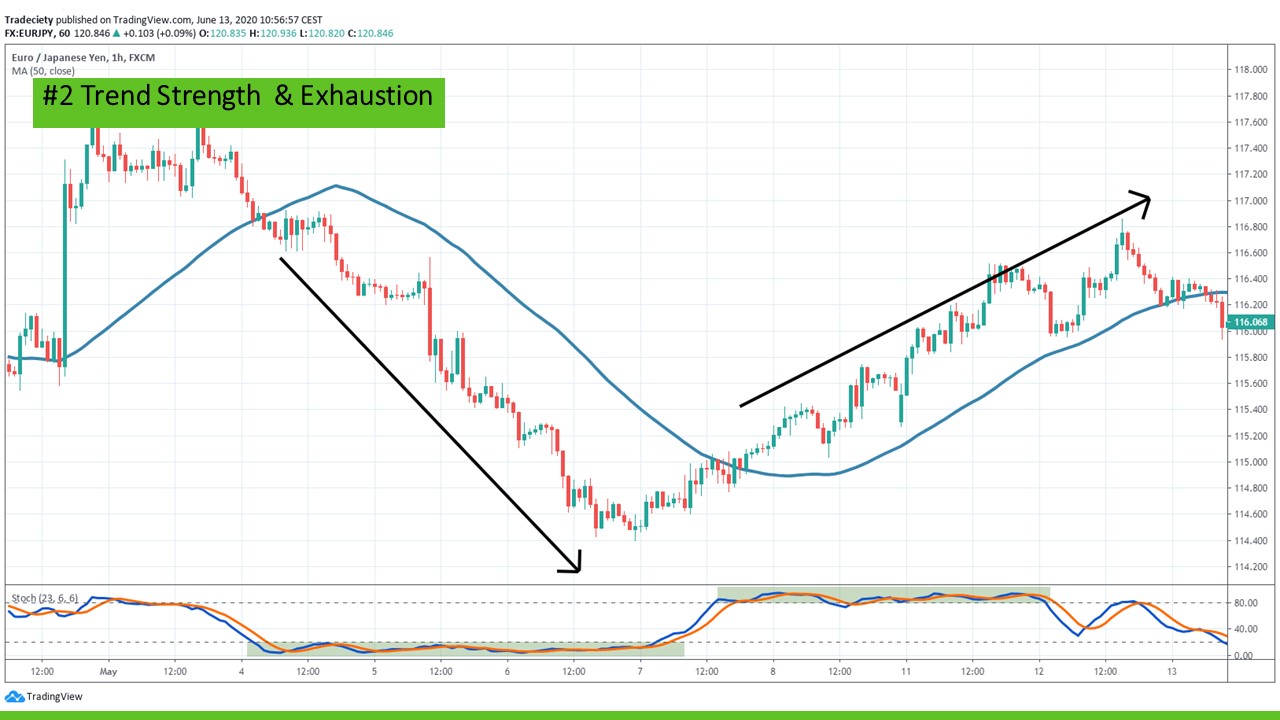
Indicators are very, very helpful when it comes to objective trend analysis, many hedge funds, many big algo firms use them because it’s an objective way to analyze price action. And when it comes to the stochastic, what you want is an oversold market and contrary to popular belief. When the stochastic is oversold, it doesn’t mean that the price will automatically go higher. It means that the market is likely to continue because it is very, very, very weak. The market is in a very strong downtrend as shown here by the stochastic and a stochastic can remain – and it often will remain – in overbought and oversold for a long, long time during strong trending markets. What you want is that you want to have a cross of the price action below the moving average. And then you want to see that the stochastic is entering the oversold area.
(05:55):
And this is then the signal that you are in a strong trend. And as long as the market is really staying in the oversold area and a stochastic is an oversold area. You are looking at a very, very strong trend. The market crossed above the moving average and the stochastic entered the overbought area. And this is where then the trend accelerated and really kept going. And I recommend that you get away from this conventional trading wisdom. Do not use the stochastic to find reversal trades. You look for trend continuation trades. When the stochastic is oversold, you don’t look for buying opportunities. You look for selling opportunities with the trend that is where it’s helpful.
(06:45):
When is this downtrend likely to end? When is this uptrend likely to end? And we can use another method for that. This is the exact same chart. I just took off the moving average, and this is still the same area I market with oversold from the previous picture. And now I add an RSI and we want to see an RSI divergence. So when is the price action not agreeing anymore with the indicator? And we have that here, the price action makes lower lows. The indicator is making higher lows. This is a divergence. And it means that the price action is not as strong to the downside anymore. The downtrend is losing momentum. And then shortly after you can see the stochastic also left the oversold area and started the uptrend shortly after the stochastic entered the overbought area and uptrend really accelerated.
(07:42):
And then we have the same here at the other side, the price action is showing you higher highs. Whereas the RSI is showing lower highs. Another divergence. It means that the uptrend is losing strength is not as strong anymore. And then shortly after the market collapses. So how you can use that as maybe use the stochastic to analyze trends, trends, to find very, very strong trends. And then you can add the concept of a divergence within our I, for example, to help you understand and help you find situations when the trend is losing momentum. So those really, really nicely compliment each other. And here we have another example. So here I use the RSI again, and I have drawn here, a center, a level in the 50 period in a 50 level. And what it does is differentiates it separates the RSI in a bullish and in a bearish area.
(08:40):
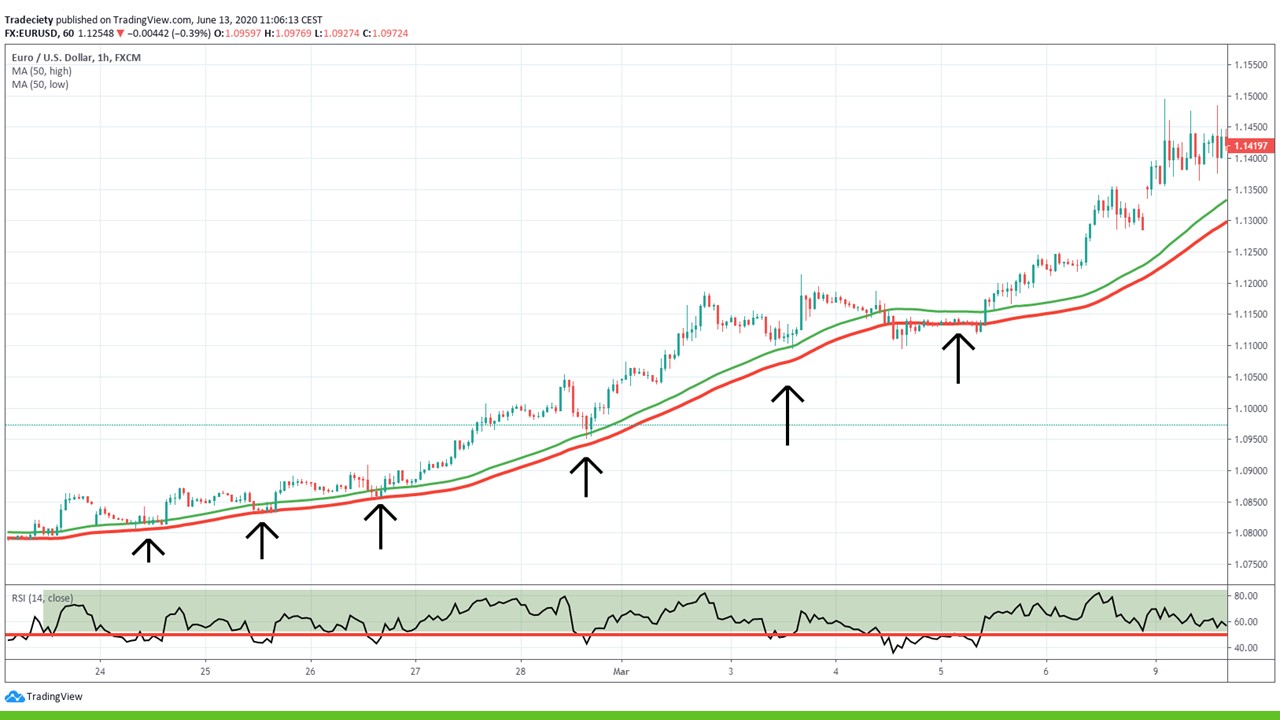
So whenever the RSI is above 50, you are technically in a bull market. When RSI is below 50, you are in a bear market. I also added a moving average channel to your charts that just help you to visualize the trend a little bit better. And what you want is that you want to get in as close to the market, breaking above the moving average and also above the RSI as possible to find new trend following traits. And if we remember, and if we remind ourselves of the first concept where we talked about extended newness, when the market is very close to the moving average, that’s often when new trends emerge. So this is where we are coming back to this concept here again. So this is more of a trend following approach. Whereas if you look for X over overextended markets and traded back to the moving average, that would be considered more of a reversal approach.
(09:33):
And so what we want is that we want to get in as close to the moving average breakout as possible. We need RSI as confirmation. We want to have the RSI above 50, and then you can use it to stay in your traits as long as the trend is still valid. And you can see that there are many ways how you can do that. You can go to the, like in the previous example with the RSI divergence, or you can try to find a Virgin says to get out of your trend, following traits, you can wait for the market to dip back into the moving average you can use at RSI. In general, you look for a cross in the RSI below 50 to get out of bullish traits. And then the same thing happens to the downside. You want to get in as close to a bearish or to a moving average breakout as possible.
(10:20):
Then for new bearish trade, you look for a confirmation. Here is the market still in, over or not below 50. So you have to wait a little bit longer as a confirmation tour. And then you’re in a downtrend as long as the market. And as long as the RSI is below 50 and also below the moving average channel. So there are many, many ways how you can measure trends, strengths, and understand trends, trends. So I really would urge you to find what works well for you. Here’s another approach. I marked this area here in green. This is the four hour timeframe, and we will go to a lower timeframe and observed X, this exact period, the green Mark period on the one hour lower timeframe to get an under other idea of how you can approach that and pull it back. Trading is generally considered a very, very good and exact trading approach.
(11:14):
So what you want is that as long as the market on the higher timeframe is still in the bullish mode, you’re looking for bullish entries and those happen when the market dips back into, into the moving average channel and also then move away from what cross back about 50. And it’s happened multiple times. The market moves into the channel, moves away from it, moves into the channel and moves away from it into the channel, moves away into the channel trends, higher into the channel trades, higher into the channel. It breaks below it, but on the higher timeframe, remember, we are still in the bullish mode. As long as we see this area here, the market is still on the higher timeframe in the uptrend. And then when the market came back above the moving average channel to uptrend accelerated and is this a very basic, but a very effective to put a bag approach in a trend following market.
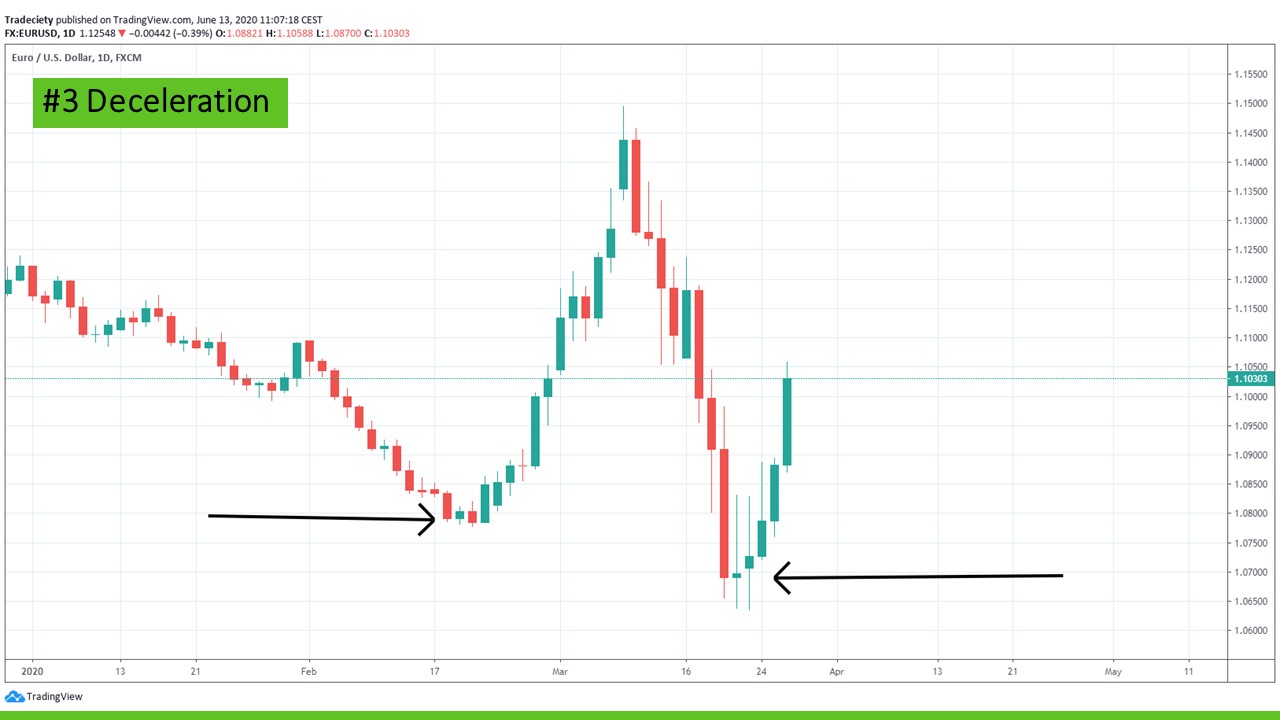
(12:07):
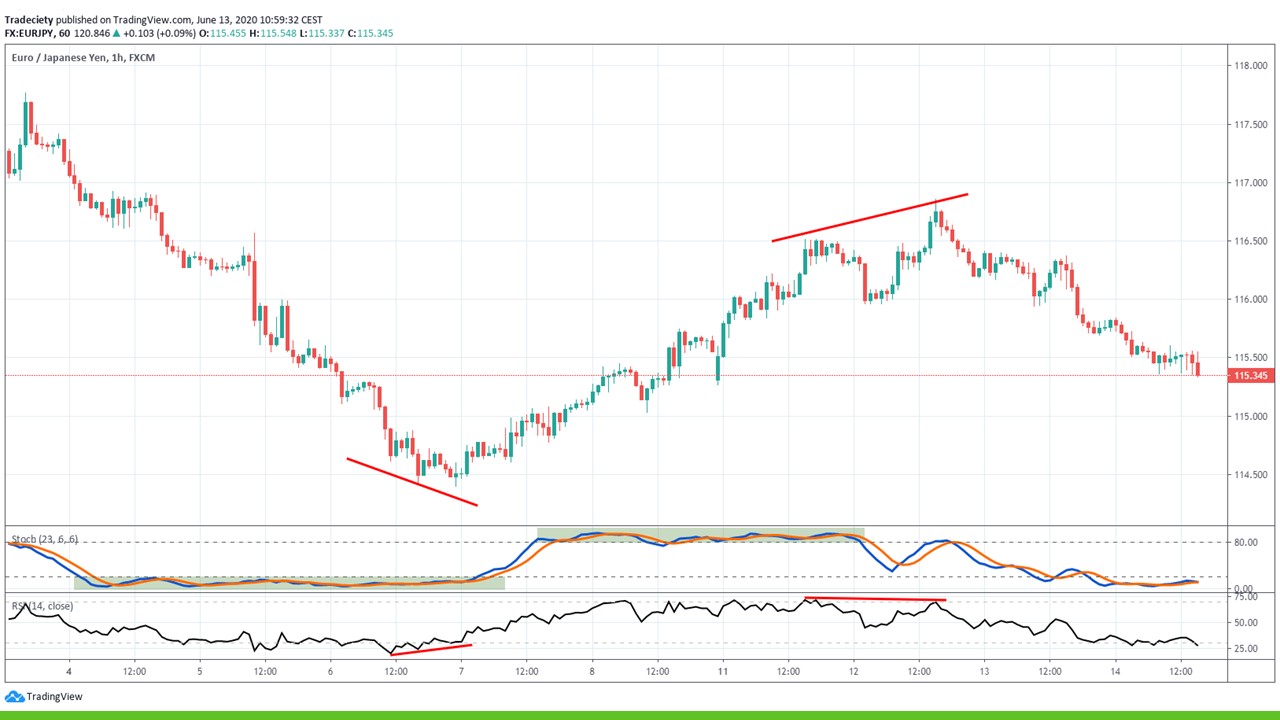
So you go to the higher timeframe like here you look for the bullish period, RSI above 50 price action above the channel. And then you go down to the lower timeframe and look for pullback entries, for example, and this is something that will help you look at Trent trends, strength in a different way. Number three, deceleration. One of my favorite concepts that I have learned actually from Moritz in our masterclass and this is really, really helpful. It has completely changed the way I look at charts and I would encourage all traders to really get the idea of it. And what we are doing for that is we are looking for an established trending market. And then we are looking for candlesticks that show us deceleration. Those are small candles, inside bar candles, small dojis and pinbars.
(13:02):
But what we want is we want to have small candles that exist after a strong trending market. And then we look for reverses. There are many, or they are often smart. There can be often small candles within the trend like here or here, and they don’t lead to a reversal. Why we’re going to learn in 0.4 of this video. But in this point, it is first just important to understand, and that you start looking for those areas. You have a strong bearish candle, then the market completely dies down and then you have a strong bullish candle. It shows the reverse or the slow gradual change to the downside. We have a strong, strong bearish market. This is the largest bearish market in this whole uptrend. And right after this bearish candle, we have two doji candles with long wicks. What do they show? They show a temporary pause in a neutral market.
(13:54):
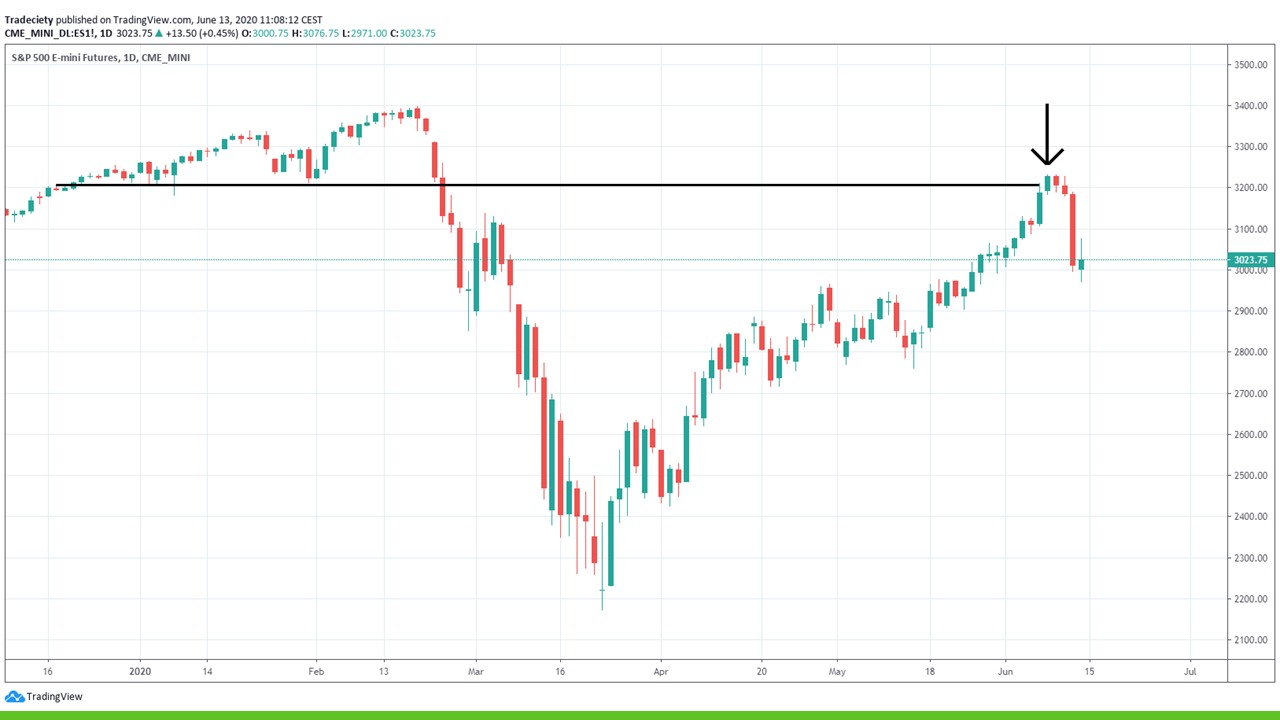
And most importantly, they show that the market has lost conviction in the, in the selling pressure in the short side. So it’s time to get out of your shorts if you’re short and it’s time to go to the lower timeframes and look for potential long entries. And whenever you see after a strong move that the market immediately dies down, that is your clue to start looking for trades into the opposite direction, and you can see the market and accelerated away from it. We have a to here on the S and P we saw that just last week, actually the market traded back in this previous support area. It acted as a resistance. You can see the market came in very, very strong, and then you have two, three very, very small candles. They show deceleration and the bullish momentum dies down, and then you can see this huge bearish drop.
(14:41):
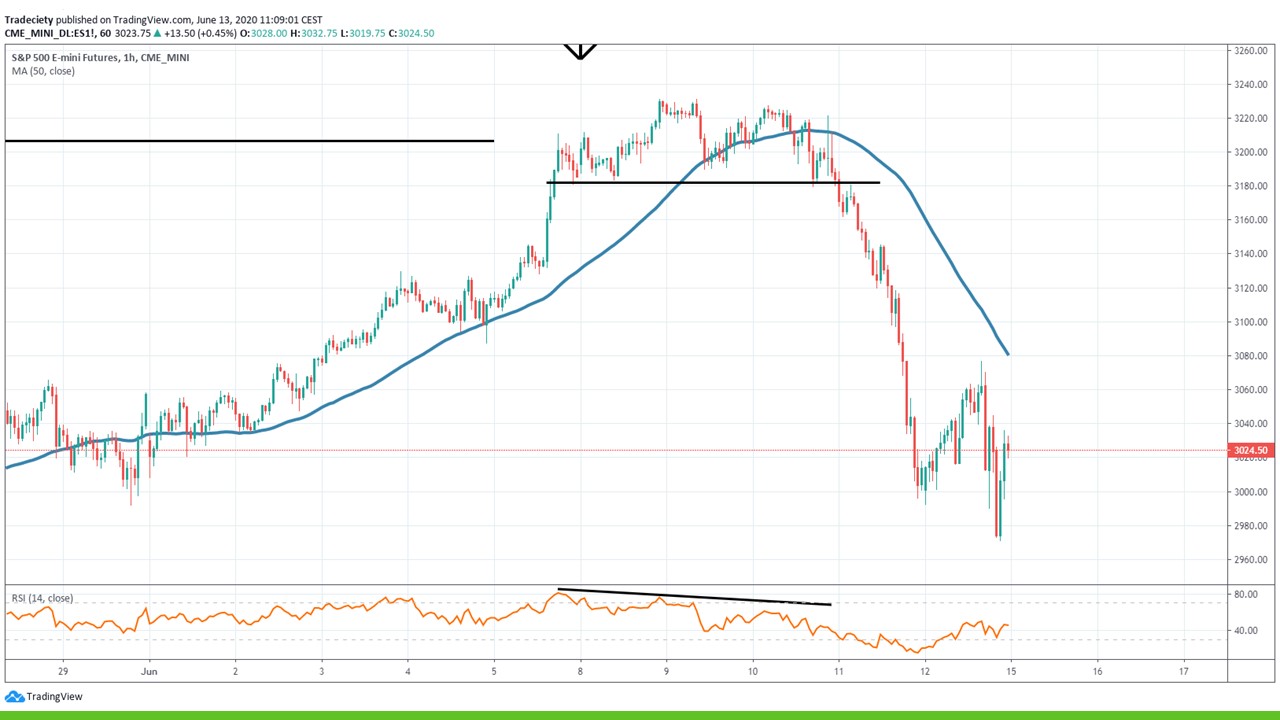
And this is how it looks on the lower timeframes. This is the big level that came in on a daily timeframe on the lower timeframe. Now, the one hour, we have a divergence here on the indicator. It shows us here is the momentum losing strength here, just completely rolling over. And then you even have a nice pet on here. You have a break and retest pattern on the lower timeframes. So this is how you would use or how you could use the deceleration concept with the mighty timeframe approach. We have the Ozzy yen, which I traded with some of my students in the master class. The market Rose rallying very, very strongly into the previous resistance zone. There were two levels on top of each other. The market found resistance at the first one. You can see when we zoom in, there is a strong bet, a bullish candle dead then got reversed into a small doji candle, a very small bearish candor, and then the acceleration to the downside.
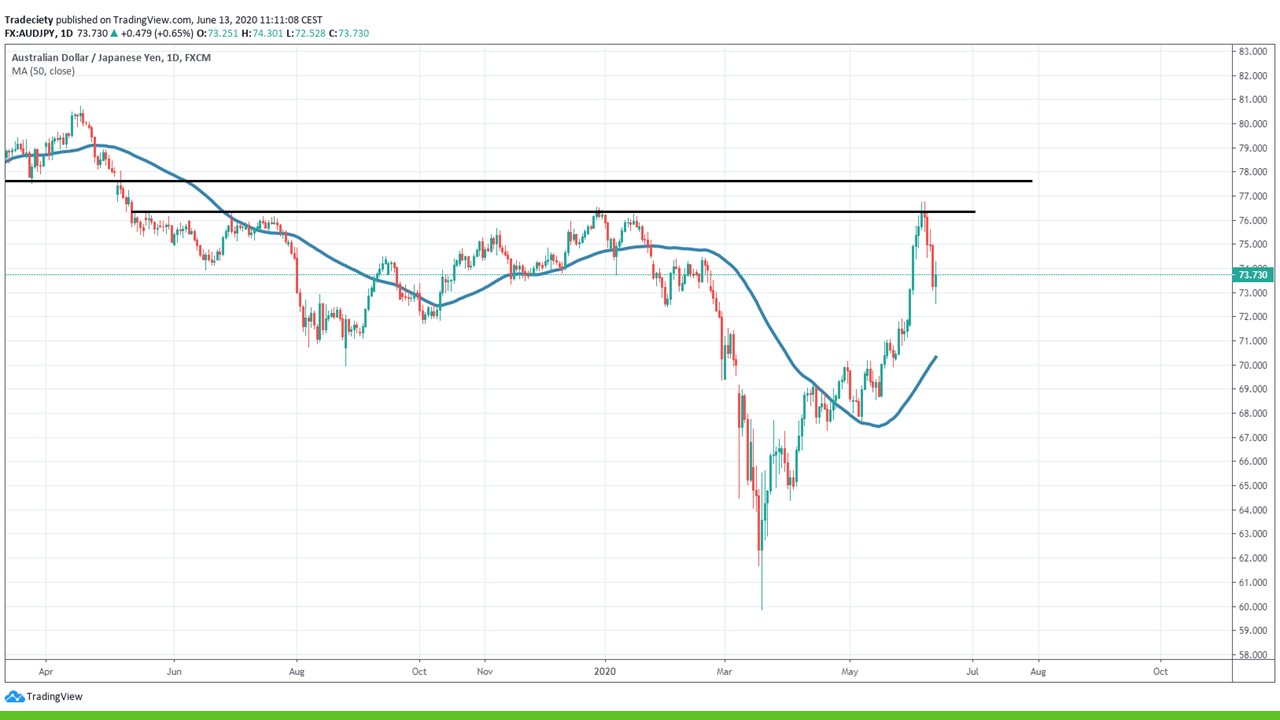
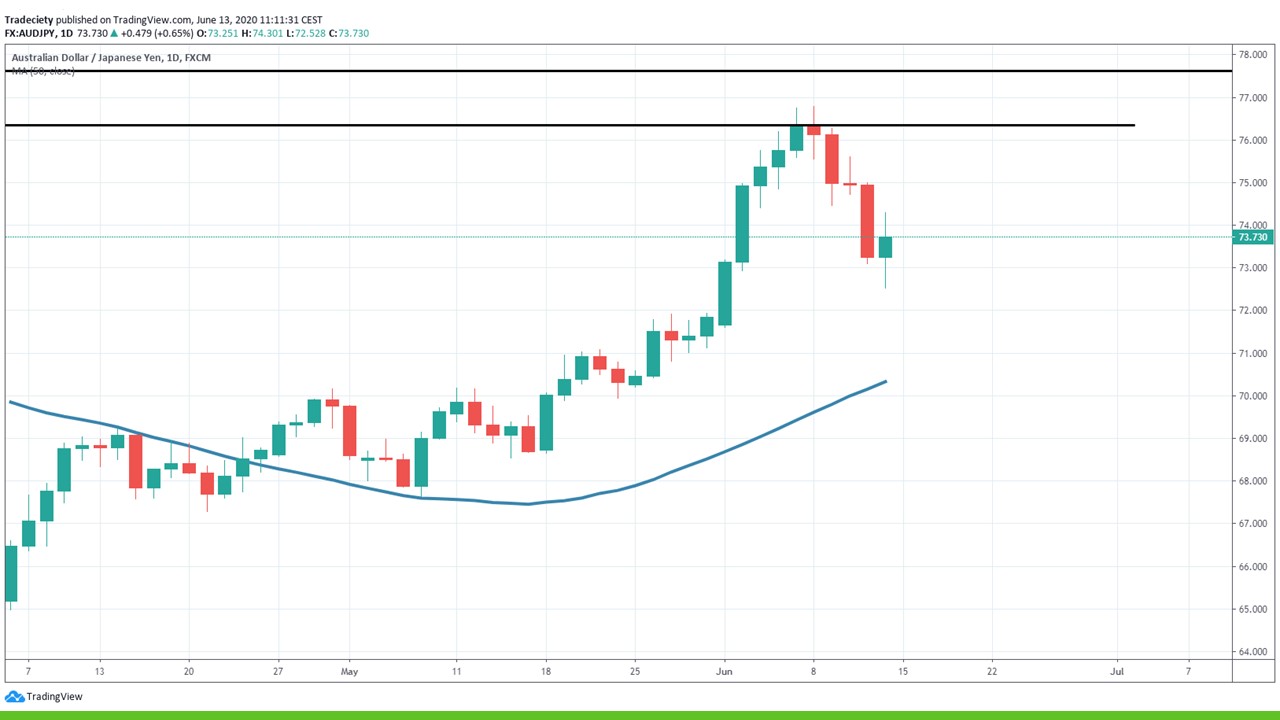
(15:37):
This is how it looks. When we zoom in strong bullish candles now fade and become smaller. This is our deceleration candle. You would go to a lower timeframe, look for an entry opportunity, but whenever you see that the market is giving you this deceleration also very far away from the moving average. So we are in an extended market that is your clue that something is changing in the market dynamics and that maybe a new training opportunity is going to present itself. This is how it looks now on a lower timeframe. So this is the area on a daily timeframe to deceleration it, is it how, how it looks on the lower timeframe. We can draw a very nice trendline in here. We see already that the market is rolling over. After the triple top here, we have lower highs. It breaks. The trendline comes back into the trendline, gives you a retest, builds.
(16:28):
This flag breaks out of the flag and another trend continuation to the downside. Every time it is confirmed by the trend rider, histogram, every breakout is also signaled and confirmed by a red trend rider. And this is how you can put the pieces together in your puzzle with the price action.
(17:17):
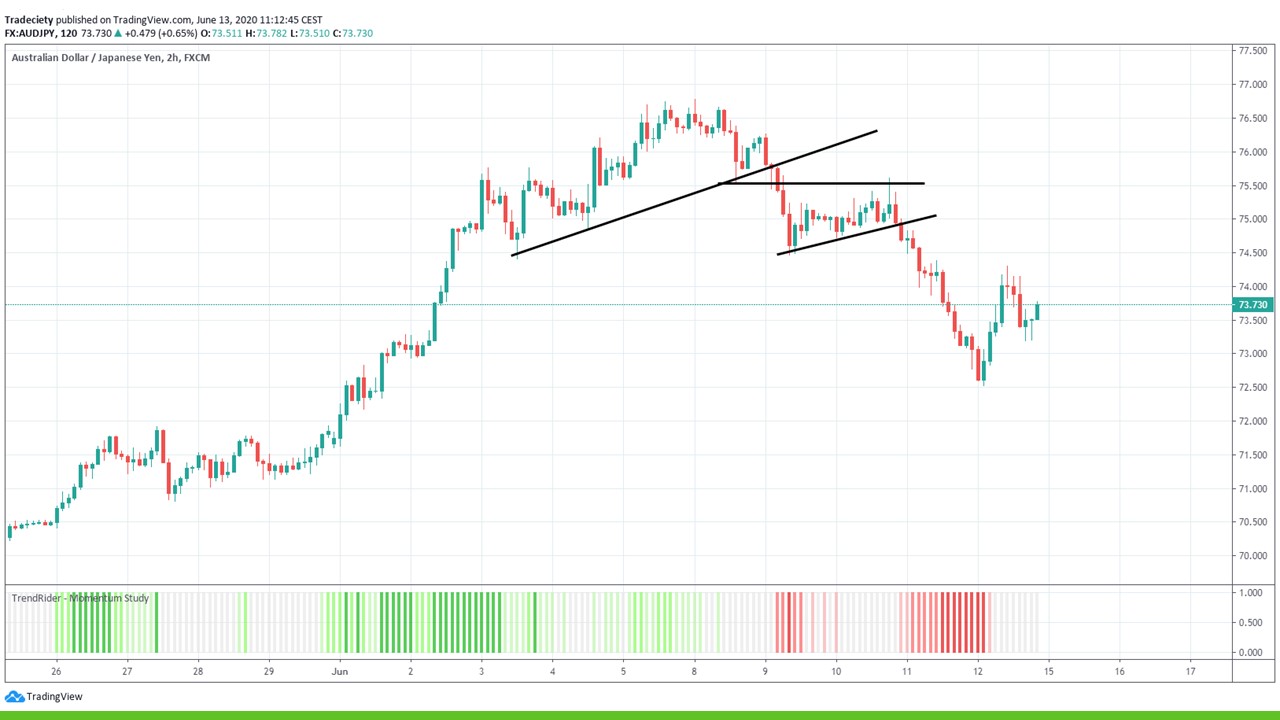
Let’s get to the last key point and the last point, which brings everything together, really, and it is called, or I called it key level. And instead of taking trades at random places all over your charts, you let the price action come to you. And you only take signals and traits at key levels. As we’ve seen in the last point where we talked about deceleration very, very often, you’ll see in a trend that a trend temporary temporarily pauses, and you have small deceleration candlesticks that don’t lead to anything.
(18:16):
And this is very normal. This is normal market behavior, normal market structure. So you have to further outdoors areas and the best way to filter out trades that don’t go anywhere or just situations that don’t trigger them is to only trade signals at important key levels. So here we are on a daily chart and I was watching this downtrend here for a long, long time. There were many situations where the trend actually slowed down, but it didn’t happen anywhere where it made sense. Only here did the reverse entered the deceleration, make actual sense because it happened at a previous support or resistance area that turns into support. And also this is a demand area which started this huge uptrend. So it does make a lot of sense to have a deceleration here. It makes much, much more sense to then to have a deceleration here, which happens in the middle of nowhere.
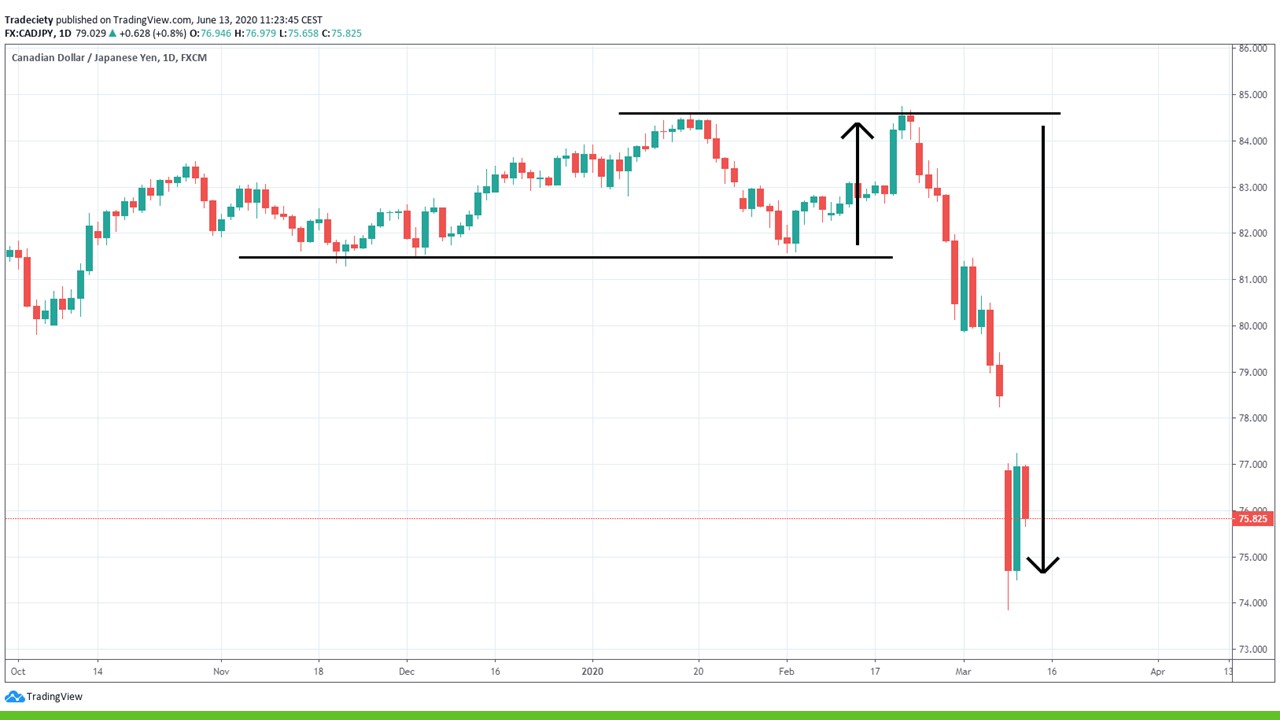
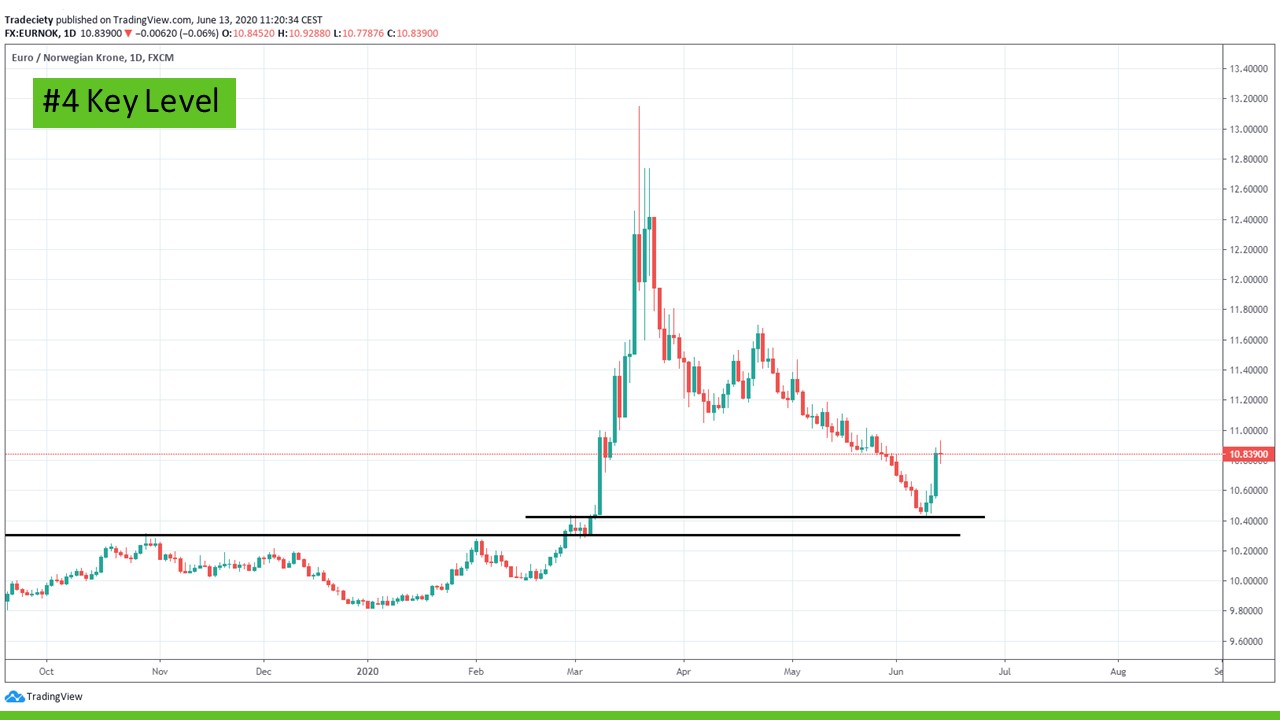
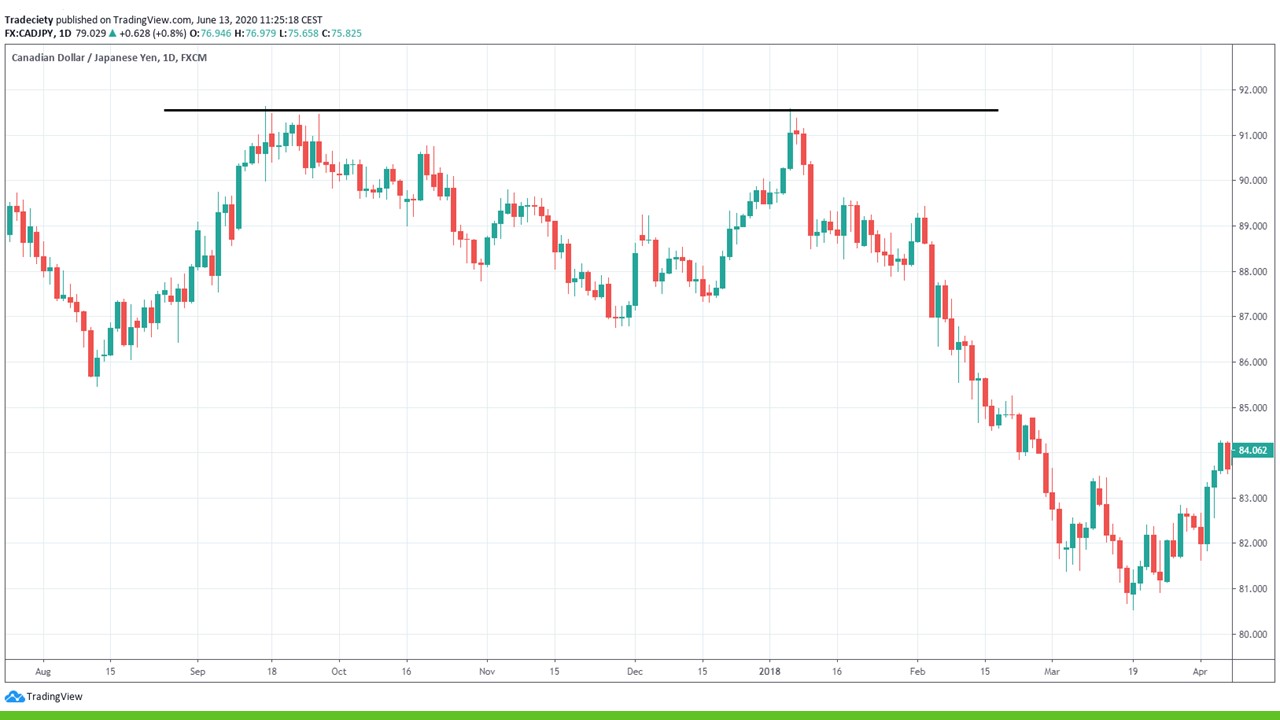
(19:12):
So this is the best approach that you can use to further out trading opportunities that are not as a high probability, and you will let the price a price come to you here. And that example, you have a nicely defined range with a bottom and a top, and you wait for deceleration at key levels. Here is a very good support leather. The market came back into the support lever, a strong bearish candle leads to a deceleration candle, which shows you the end of the trend here. You would then go after the story, you’ll get go lower to the, maybe to the one hour to four hour timeframe. And you look to time your traits, which is what we do in the master class. Here you have. Then the market is coming back into the previous resistance level. It is railing very, very strongly strong bullish Canada, and then it leads to a deceleration candle and as new, huge new downtrend.
(20:04):
And this is very, very important. It’s such a simple photo. It seems very simple, but it can completely change the way you look at the charts. He, again, you draw your levels at previous resistance levels, turning points. You wait for the price to get there. And then you wait for the market to show you a deceleration candor. So whenever you see a complete market shift, strong bullish candle turns immediately into a deceleration neutral candle that should show you that something is really changing in the market dynamics. The buyers are not strong anymore, and maybe the sellers are ready to take over. And then after the story, you just go to the lower timeframe and you look for patterns or other ways to time your traits here. We have another example you could use moving to look for deceleration as well. So when the market shoots back into the moving average, that is where you look for the rejection candles, or you just let the market come back to the previous resistance.
(21:00):
And this is really how you can use those four secrets. They integrate very nicely together. You can see how key levels and deceleration work together. You can see how overextended us work together. So whenever you see a deceleration at a level that is very far or happening very far from the moving average, you’re just traded back to the moving average or you band, you bet on a move away from the moving average. So you wait for the market to get back to the moving average and then traded away from a moving average. And those are all key points that will help you improve your technical analysis skills, your price action, and your understanding for charts. Let me know if you liked those types of videos, if that is interesting for you, make sure to check the link in a description for the master class and all the courses that we offer. And I look forward to hearing from you. I read every single comment, even if I can reply to everyone. I am reading every single comment and I use it as inspiration for next, for my next videos and also for my podcast. Thank you for watching. And until the next time.

external link:


We have been trading supply and demand strategies for over ten years, and they have stood the test of time remarkably well. Supply and demand is...

3 min read
Choosing the right trading journal is essential for traders wanting to analyze performance, refine strategies, and improve consistency. In this...

3 min read
“95% of all traders fail” is the most commonly used trading related statistic around the internet. But no research paper exists that proves this...