3 min read
Scientist Discovered Why Most Traders Lose Money – 24 Surprising Statistics
“95% of all traders fail” is the most commonly used trading related statistic around the internet. But no research paper exists that proves this...

Trendlines can be great trading tools if used correctly and in this post, I am going to share three powerful trendline strategies with you.
But first, keep in mind the two most important concepts when it comes to drawing and using trendlines:
The break and retest strategy is quite a common strategy used by many different traders.
The idea is that once you identified an active trendline, you wait for the price to break out of it. Sometimes, the price will just run away and the price won’t look back. However, if the price trades back into the trendline, the retest can often be traded as a high probability setup. The timing can be done on a lower timeframe or directly on the same timeframe where you identified the trendline.
The trendline acts as both the entry trigger and also helps to place stops. The stop loss is generally placed on the other side of the trendline and the trendline acts as a protection level between the entry price and the stop loss.
The more touchpoints a trendline has, the better it is suited for the break and retest strategy. In the example below, the trendline has at least 3/4 valid touchpoints. During the breakout, there was a lot of volatility in the market and the price hovered around the trendline for quite a while.
The level of aggressiveness of the trader determines how early the entry will be taken. An aggressive and more risk-seeking trader could get into a trade as soon as the price touches the trendline. A more conservative trader would wait for the price to pull away from the trendline and exhibit signs of momentum into the trade direction.
There is no right or wrong and entry timing depends on the preferences of the trader.
Whereas Break & Retest scenarios can be considered reversal trading or early trend-following, flags classify as regular or late trend-following.
With flags trading, you look for an established trend and then wait for a consolidation/pullback. If you can describe the pullback with a trendline, then it may be possible to trade such a flag once the price has broken the trendline and resumed trading into the trend direction.
In the screenshot below, the price was first in a downtrend before the trend paused and established a flag defined by the trendline. Here, we can gain additional insights into the market participants; whereas the initial downtrend was strong and the price fell quickly during a short period of time, the bullish flag patterns only showed weak buying interest. Comparing the trend intensity can help with understanding how likely a trendline break might be. In this example, the downtrend was significantly stronger than the bullish flag pattern which means a higher likelihood for a trend continuation lower.
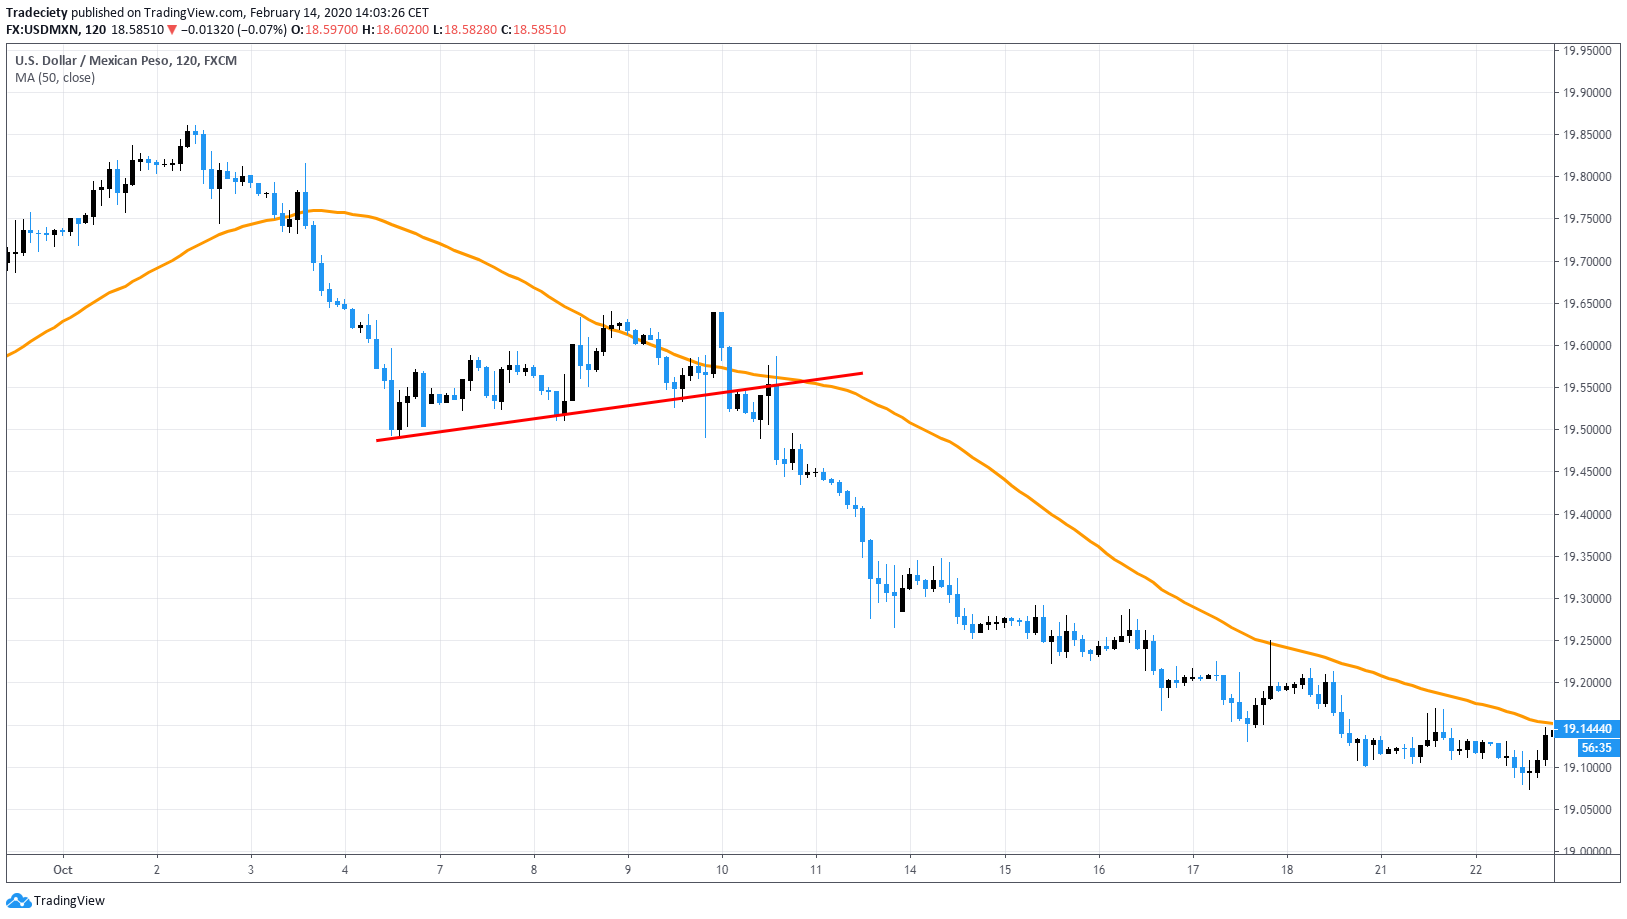
It is also possible to add a longer-term moving average to your charts when it comes to flag trading. The 50 MA helps identifying the long-term trend and such a trader would only look for flag patterns that signal a continuation into the trend direction.
In the screenshot below, the moving average indicates a downtrend because the price was trading below the moving average. The flag pattern indicates a temporary pause and the break of the trendline confirmed the trend continuation.
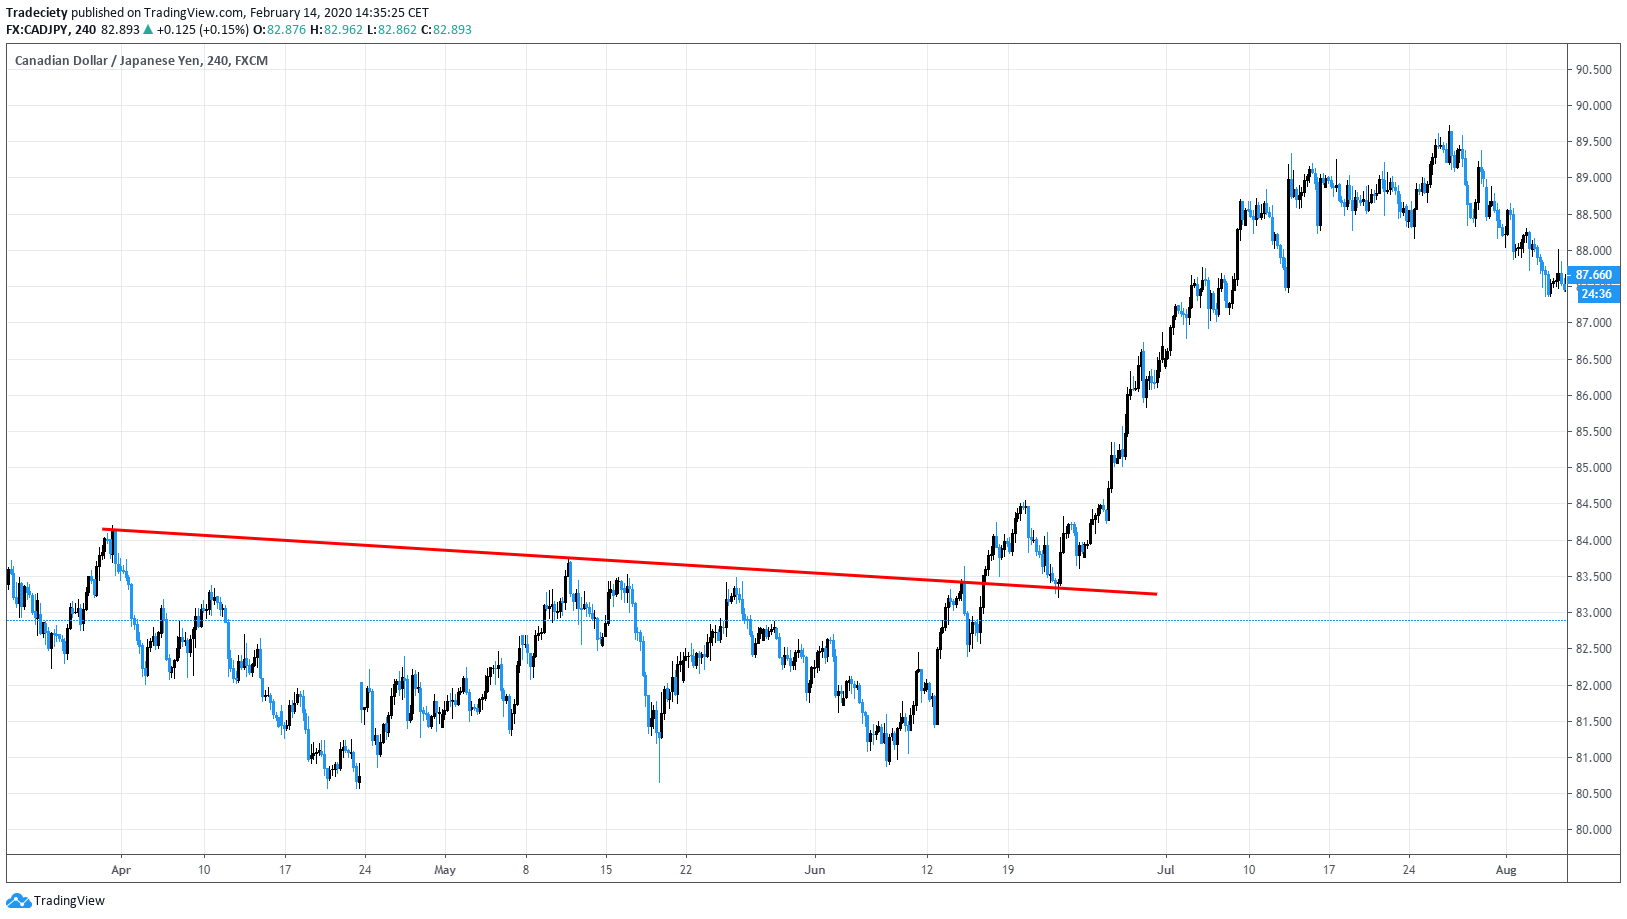
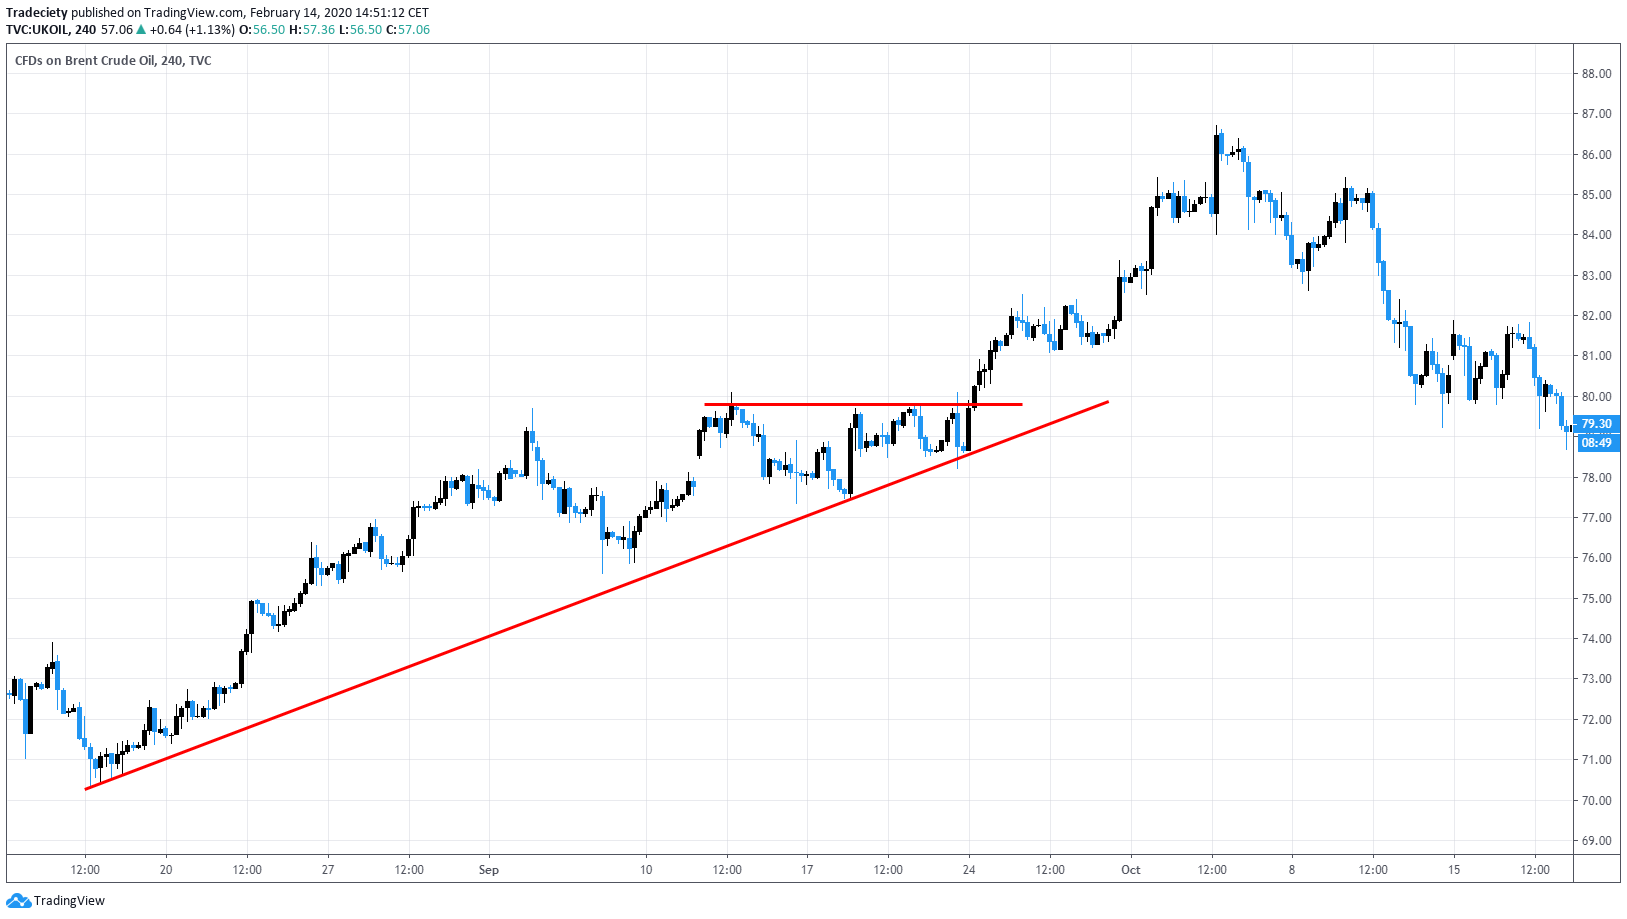
Trendline bounces are also trend-following trading approaches. In contrast to the flag pattern, the trendline is not used to time trade entries, but to identify scenarios where the trendline is acting as support or resistance.
In the screenshot below, the price bounced off the trendline for the 3rd consecutive time, confirming the validity of the trendline. Then, traders would look for other technical patterns around the bounce to time trade entries. In this case, the price has established a horizontal resistance level around the trendine bounce. The horizontal level then allows to time the trades after a breakout.
In this strategy, the trader could either be extra conservative and place the stop loss all the way below the trendline, or use a stop loss below the resistance level.
Again, there is no right or wrong. It all depends on the risk appetite of the trader. I wrote about stop loss techniques before.
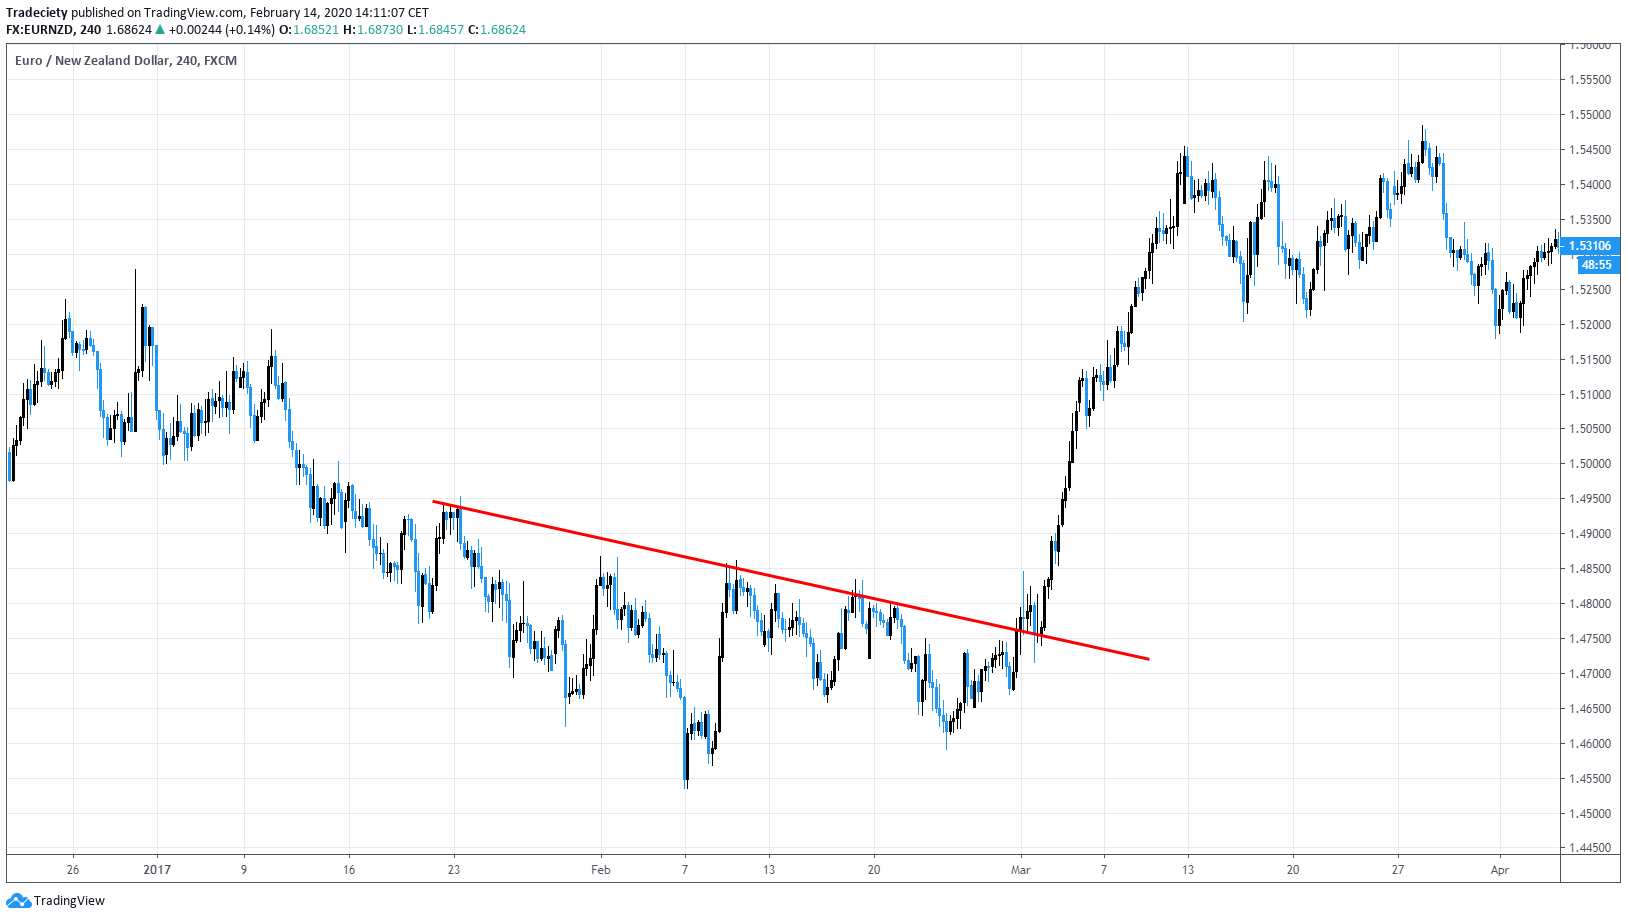
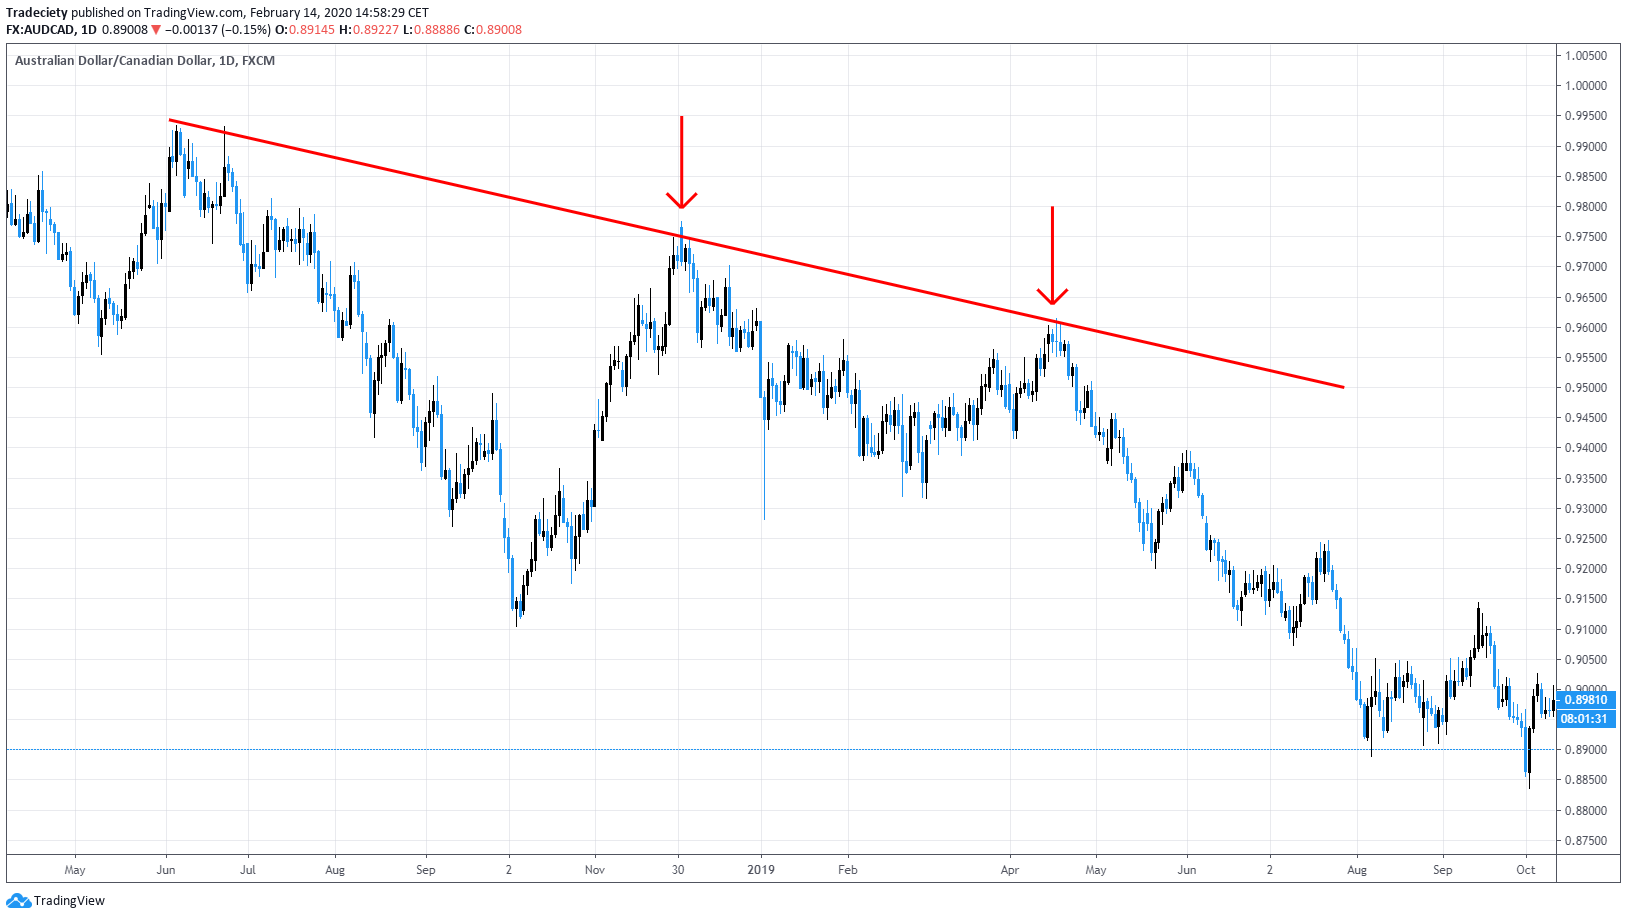
Trendline bounces may also be used in a multi-timeframe approach and once a long-term trendline has been established, like in the screenshot below, a trader could then move to the lower timeframes and time his trades using other technical concepts.
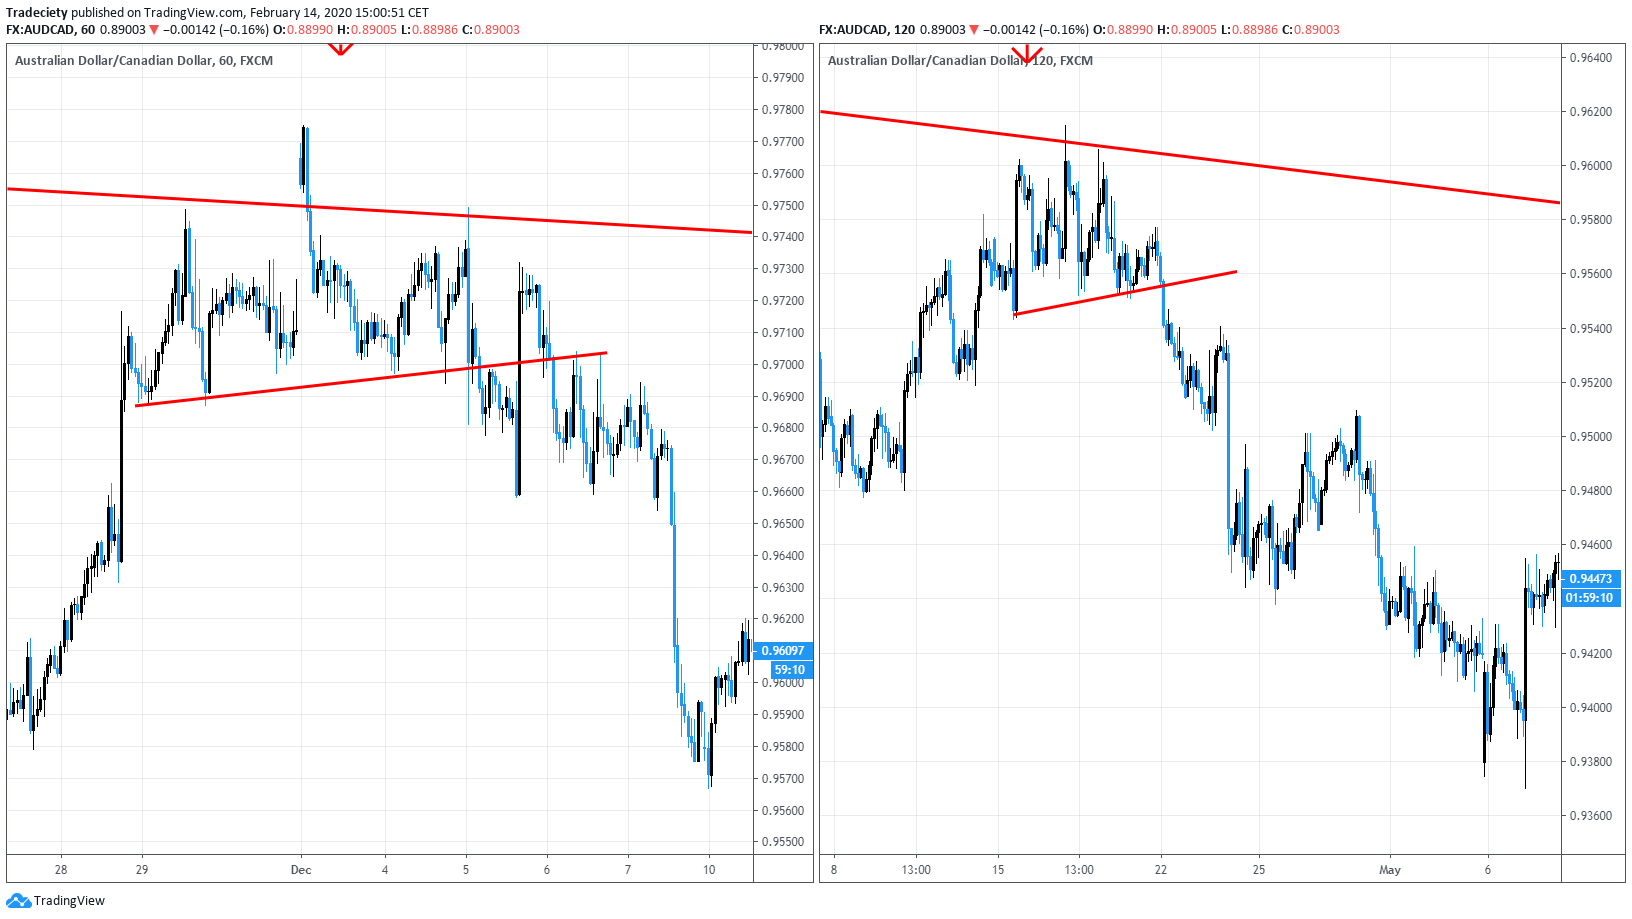
In the following, we are going to take a look at the situation on the lower timeframe for the two trendline bounce scenarios that I marked with red arrows.
On the left, we see the first bounce (first arrow). The price action was rather messy here so probably no trade entry would have taken place here.
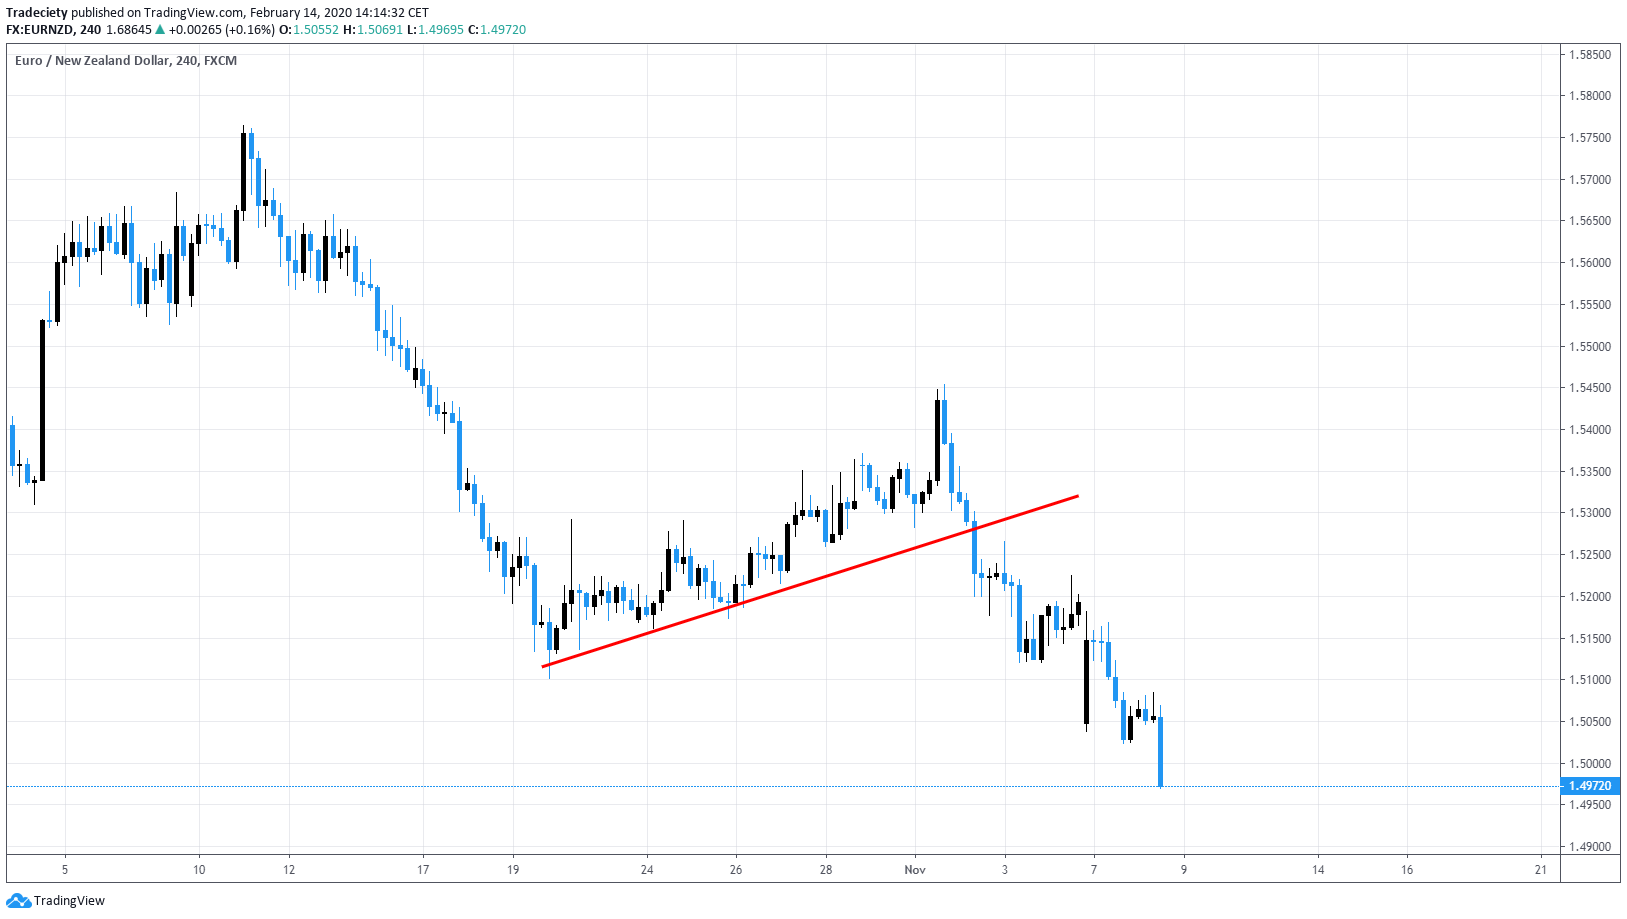
On the right, the price provided a Head and Shoulders structure and with the help of another, short-term trendline, the trader could have timed the trade.
Using a multi-timeframe approach can help some traders get into trades earlier and also find higher reward-risk-ratio scenarios. However, you can also trade the trendline bounce directly on the higher timeframe if a favorable candlestick pattern is present.
Trendlines can be great tools to have in your toolbox as traders and some people find them to be more reliable than regular, horizontal support/resistance.


external link:


3 min read
“95% of all traders fail” is the most commonly used trading related statistic around the internet. But no research paper exists that proves this...
3 min read
Trendlines can be great trading tools if used correctly and in this post, I am going to share three powerful trendline strategies with you.

3 min read
Choosing the right trading journal is essential for traders wanting to analyze performance, refine strategies, and improve consistency. In this...