Supply and Demand Trading in 2026
We have been trading supply and demand strategies for over ten years, and they have stood the test of time remarkably well. Supply and demand is...

Inside bars are among the most popular candlestick patterns price action traders use in their analysis and trading. Defined as (usually) a smaller ranged bar that is totally engulfed by the bar prior to it – these are great to identify halts in momentum that can serve as a crucial cue when looking for trade setups. The general signal of an inside bar is given once price breaks out of the range of the inside bar on the next candle.
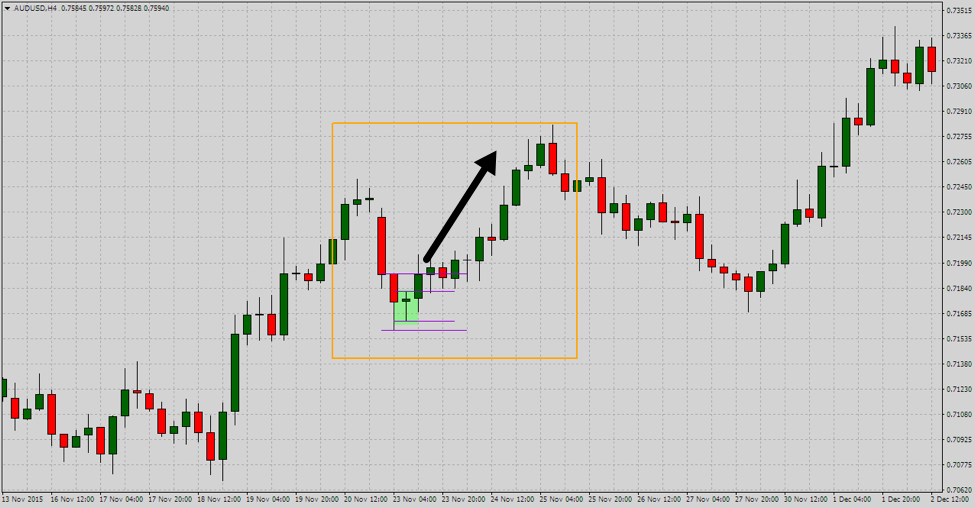
Let’s take a look at a couple of quick examples of inside bars at work:
The two charts above show inside bars marked in light green shade. You can see the relatively smaller range of the inside bars and importantly how their high and low are tucked within the range of the prior bar, giving it the look of being ‘inside’ the preceding bar.
The most popular approach to trading inside bars is on the break of either the high or the low with the stop going above / below the inside bar itself. In the first case above, an entry on the break of the inside bar low would have yielded some solid pips. Conversely an entry on the break of the high of the inside bar on the second chart would have also made for a profitable trade.
But if you have ever scanned your charts for these bars you perhaps know the biggest problem in using them consistently in your analysis: Their damn frequency!
On a random EUR/JPY daily chart attached below I spotted 24 inside bar setups:
If I were to trade all of these as simply inside bar trades using the popular method that calls for entering on the break of either the high or the low of the bar, I would be sitting with a very sorry looking equity curve.
Well surely a bar pattern that is so common cannot be the holy grail of profitability yeah? Well perhaps not, but using the tips listed below you can filter out the higher probability ones to be added in your trading arsenal.
Inside bars represent periods of low volume (momentum) trading, and when the broader market itself is stuck a in a low volume side-ways rhythm, you are bound to come across a lot of ‘noise’ as a trader looking for inside bars.
By noise I mean frequently appearing inside bars that do not quite trigger price moves that you would expect when you trade them. Choppy price action can call for extremely difficult and risky trade management, increasing your problems further.
Notice the EUR/JPY chart attached above actually displays a sideways market for the most part. Where price is generally trending well in a particular direction with decent sized bars, an inside bar (given other factors) showing a halt in momentum is a solid piece of information! And that brings me to my second point.
Even when in a trend, blindly pulling triggers on an inside bar can lead to devastating results! As I have frequently mentioned in my prior articles – it is really all about the story!
Dissecting the inside bar for what it is – i.e a low volume trading period – it could be giving off varying information depending on where it appears on the chart. A key point to understand here is to look beyond the instinctive need to be looking for these bars in the first place, and asking yourself this instead: Where exactly on the chart would you like to understandably see low interest from traders? At a pullback to a major former breakout point maybe?
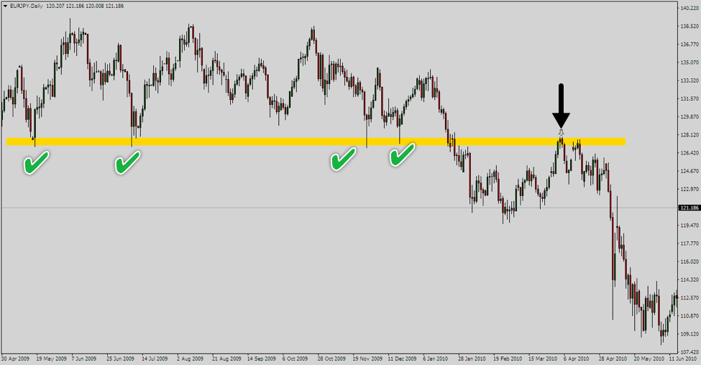
Well check this out:

You do not have to be trading an inside bar wherever it appears. Putting it into the larger perspective is often the key to filtering the high probability ones. In the example above, it is understandable for price to be losing momentum as it approaches such a key former support level. An inside bar just validates that expectation and therefore sets up price for a very likely bounce off of that support and resistance area, while allowing you the opportunity to milk a high probability trade setup.
Locations like these are not a common occurrence, and if you can start pairing your inside bars with such locations, you already have a great tool to cherry pick the strongest of inside bar setups amidst a barrage of them on the chart – using good old price action knowledge.
It is commonly understood that price action is just as relevant across all time frames, and while that is true, I will bravely want to disagree with that when it comes to inside bars.
When we talk about low volume trading being printed on the charts in the form of inside bars, we are actually interested in the order flow/price action aspects of it. But in intra-day markets traders’ interests can be determined by a host of other factors too that may not tie into the technical aspects of trading.
Examples of these situations are important upcoming news announcements that could be holding traders from executing trades temporarily, or the general variation in momentum witnessed throughout the day as markets across the globe go in and out of trading activity (Asian sessions are normally weaker than the European and the American sessions).
An inside bar on the daily will hold trading activity before and after news announcements of the day as well as all the trading sessions of the day and is therefore more telling of a genuine dry-up of momentum as compared to an inside bar appearing on the 15 min chart dead in the middle of the Asian trading session.
Now of course we are talking independently off the crucial aspects of location and the bigger story, which could drastically impact a traders’ decision to trade (or not to trade) the inside bar, but we are talking in general terms here about how intra-day traders are more vulnerable to the ‘noise’ compared to higher time frame traders.
When talking about frequently repeating bar patterns like the inside bar, you better know how to separate the weak ones from the strong ones or you’re fodder for the pros!

We have been trading supply and demand strategies for over ten years, and they have stood the test of time remarkably well. Supply and demand is...

3 min read
Choosing the right trading journal is essential for traders wanting to analyze performance, refine strategies, and improve consistency. In this...

3 min read
“95% of all traders fail” is the most commonly used trading related statistic around the internet. But no research paper exists that proves this...