Supply and Demand Trading in 2026
We have been trading supply and demand strategies for over ten years, and they have stood the test of time remarkably well. Supply and demand is...

Inside and outside bars are quite popular among price action traders – for good reasons. Although trading single candlestick patterns is usually not a robust trading approach, if such candlestick patterns are traded within the right chart context, it is possible to create more robust signals.
An outside bar pattern consists of two candlesticks. The first one is typically much smaller and the second completely engulfs the first candlestick; hence the name outside bar. The outside bar can have various meanings, depending on the chart context. In the following article, we are going to discover three different trading strategies and how the outside bar can act as an important trigger for each one.
At the end of an established trend, one can often recognize the same pattern:
After a long momentum candlestick, the momentum suddenly drops off and signals a lack of trend support. In the screenshot below, the downtrend came to an abrupt end when multiple consecutive small inside bar candles were created after the long momentum candlestick. After three inside bars, the momentum then suddenly turned and a strong outside bar reversed the price higher. This is a classic reversal sequence and it nicely shows the turning momentum.
We can see the same pattern in the screenshot below and the candlestick sequence foreshadowed the upcoming downtrend. After multiple consecutive bullish candlesticks, the momentum slowed down and two very small inside bars signaled the end of the bullish power. Then, a strong bearish outside bar started the new downtrend.
To increase the chances of finding high probability reversals, one would only look for such candlestick sequences during over-extended trends that have been going on for a significant amount of time. The longer a trend has been going on, especially in the Forex market, the higher the chances that such a candlestick pattern is actually the start of an opposite trend.
When outside bar sequences exist during pullback phases, they can act as trend-continuation signals.
In the screenshot below, the market was in a downtrend as indicated by the orange long-term moving average. Consolidations are normal events during trending phases when the market moves sideways temporarily. The trend continues when the powers between buyers and sellers shift again and push the price in the initial trend direction. Such continuation-pushes often occur with an outside bar that signals momentum in the trend direction. It can be an important signal that indicates more momentum to come.
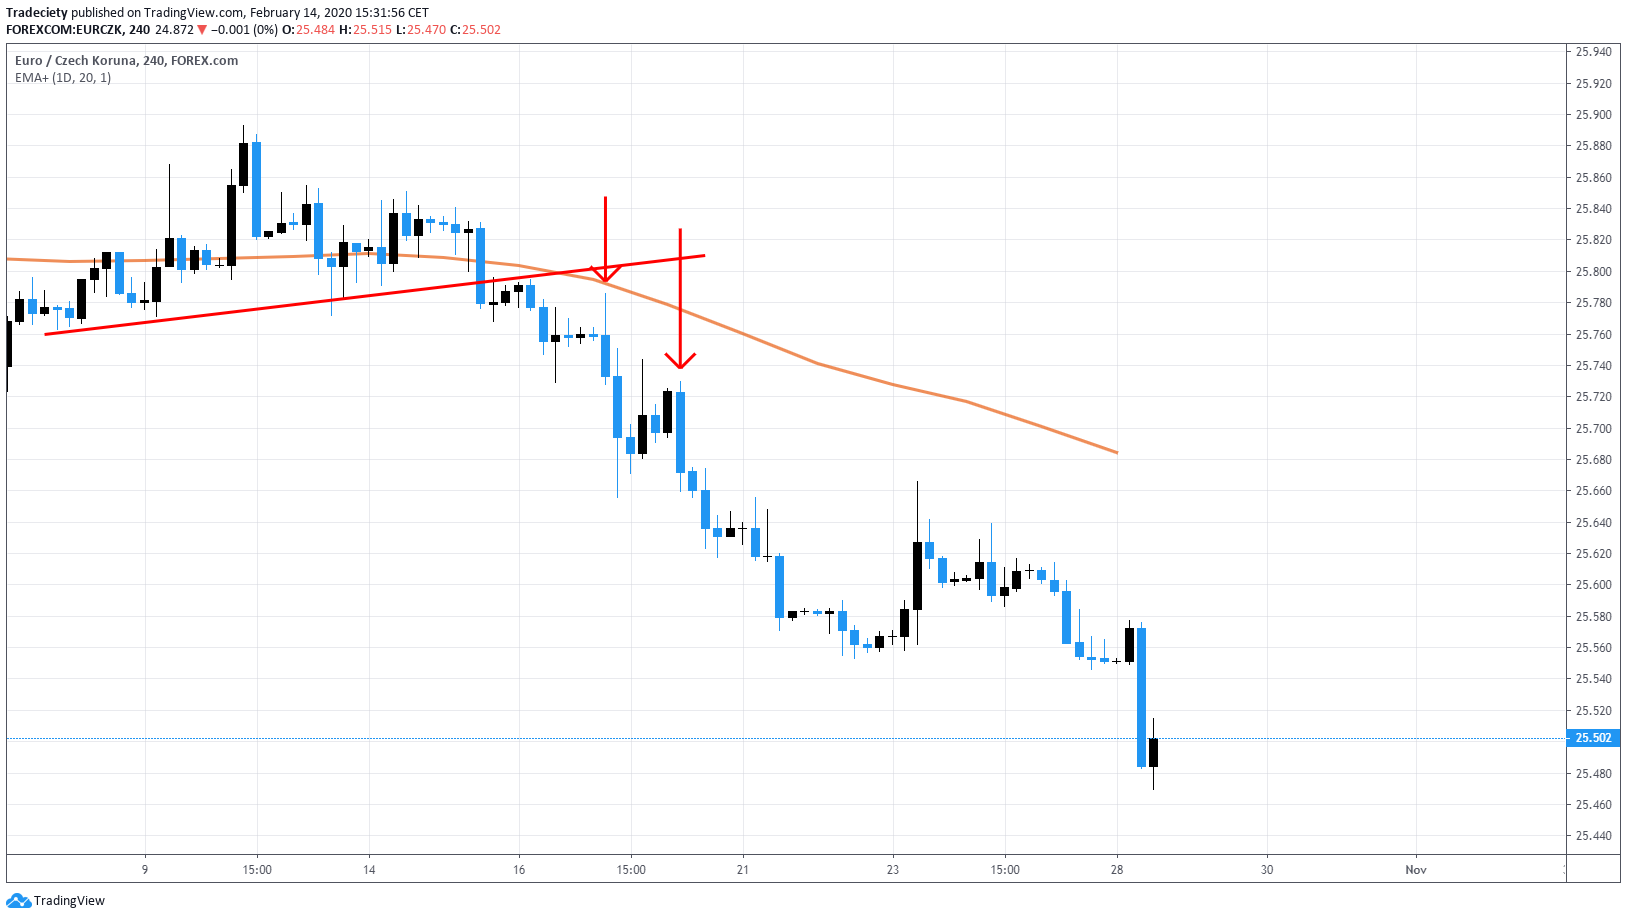
The screenshot below shows a similar situation. The price was in a downtrend as indicated by the position of the price below the long-term moving average. A trader would then wait for a bullish pullback and trade once an outside bar in the initial trend direction occurs.
Of course, trends usually don’t last forever and, therefore, trading only the first or second pullback can mitigate the risks of getting into a trend too late.
The breakout buildup is one of my favorite price action setups and an inside-bar-outside bar combination can often be found at its origin.
In the screenshot below, the price was confined within a well-defined sideways range. The price then kept trading into the red resistance level. Although we will never know if a breakout will happen before the price really breaks out, the buildup before the breakout can often foreshadow an imminent breakout.
The buildup tells us that the price stuck to the level and the market participants that previously caused the price to move away from the level are not as strong anymore. In the context of the scenario below, the sellers were not able to defend the resistance level anymore and the buying power held the price up. This is a clear sign of strength. The buildup candlesticks often have the dimensions of inside bars. The following breakout often happens with a strong momentum candlestick. Not always will it have the characteristics of an outside bar, but it must be significantly larger than the candlesticks during the breakout buildup.
In the screenshot below, the price first showed a breakout buildup with inside candlesticks just underneath the resistance level and the breakout happened with a strong outside bar.
Then, during the trend, another bullish outside bar during the first pullback provided another potential trading opportunity.
As mentioned at the beginning of this article, we do not recommend trading outside and inside bars on their own. But once the trader can put candlestick patterns in the right context and build a trading strategy that makes use of the candlestick patterns in a more sophisticated context, such trading signals may help the trader to time high probability trading opportunities.

We have been trading supply and demand strategies for over ten years, and they have stood the test of time remarkably well. Supply and demand is...

3 min read
Choosing the right trading journal is essential for traders wanting to analyze performance, refine strategies, and improve consistency. In this...

3 min read
“95% of all traders fail” is the most commonly used trading related statistic around the internet. But no research paper exists that proves this...